UDC 614.8.067
DOI: 10.21668/health.risk/2017.2.04.eng
ANALYZING AND DEVELOPING CRITERIA FOR ASSESSING OCCUPATIONAL TRAUMATISM RISKS BASING ON «BEST PRACTICE CODE»*
S.P. Levashov
Kurgan State University, 25 Gogolya Str., Kurgan, 640669, Russian Federation
A system of managing occupational risks is now being implemented in the Russian Federation; it implies developing mechanisms of their assessment. The article presents an assessment procedure for assessing occupa-tional traumatism risks as a part of methodology for complex occupaoccupa-tional risks assessment. Occupaoccupa-tional traumatism risk assessment is based on such criteria as predicted traumatism frequency caused by priority risk factors for examined groups (discrete criteria of traumatism risks) and frequency diagram depending on conse-quences of injuries caused by priority risk factors. They are integral criteria of traumatism risks (known as F–N curves). «Best practice code» means traumatism risks levels which exist now in countries with high occupational safety.
Our research objects were cases and circumstances of traumatism occurring among such an occupational group as «drivers and operators of mobile equipment». We detected that increased risks levels occurred due to a limited number of factors from each group of variables and it, in general, corresponded to Pareto principle. We obtained a dependence of y = c×e–bхtype (F–N curve analogue), which described correlation between relative fre-quency of injuries and gravity of damage caused by them as a median of temporary disability of workers from the examined occupational group (R² > 0,9). The obtained equations for approximating curve can be criterial in as-sessing injuring circumstances significance and risk levels for workers from relevant occupational groups in indus-try and agriculture in the Russian Federation.
Assessment results and assessing priority risks and factors causing them give a possibility to make decisions related to developing strategies, programs, techniques, and activities aimed at raising workers' safety in the exam-ined occupational group.
Key words: occupational risk, risk factor, traumatism, risk assessment criteria, принцип Pareto principle, workers' safety, best practice code.
A standard set of activities which are to be performed by any employer necessarily in-cludes occupational risks assessment. Trauma-tism risk management is a vital task for a lot of industries and it is considered in works by both Russian and foreign researchers [4, 7, 9–11,
12–18, 20]. The order issued by the RF Minis-try of Labor and Social Protection1 fixes the job responsibility of executives and labor pro-tection specialists at all enterprises and organi-zations to perform the complete set of activi-ties on detecting, assessing and managing oc-__________________________
Levashov S.P., 2017
Sergey P. Levashov – Corresponding Member of the International Academy of Sciences, Ecology and
Life Safety, Candidate of Technical Sciences, Associate professor at Ecology and Life Safety Department (e-mail: [email protected]; tel.: +7 (3522) 23-20-92).
* The work is performed within the frameworks of the grant RFFI 14-46-00008Theory and methodology of assessing occupationalrisks for workers employed at industrial enterprises in the RF.
1
On fixing the Integrated job description reference book on executives, specialists, and clerks positions: section «Job de-scriptions of executives and labor protection specialists positions» [web-source]: The Order issued by the RF Ministry of labor and Social Protection No. 559н dated May 17, 2012. // Rossiskaya gazeta. – 2012. – June 22. – No. 141. – URL: https://rg.ru/2012/06/22/doljnosti-dok.html (date of visit June 11, 2016).
2
On obligatory social insurance against industrial accidents and occupational diseases: Federal law No. 125 dated July 24, 1998. [web-source]. – URL: http://docs.cntd.ru/document/901713539 (date of visit June 23, 2016).
3
cupational risks. But still a concept of occupa-tional risks assessment in Russia hasn't been developed as a practical instrument yet.
According to the existing federal law on insurance against accidents2 and regulations on Labor Protection and Working Conditions De-partment and Social Insurance Fund (SIF)3 working conditions and labor protection as well as occupational risks levels are monitored in our country as per economic activity and the RF regions.
Organizations and/or private entrepre-neurs (juridical persons) which are included into the statistical register are statistical obser-vation objects in both cases. Statistical infor-mation provided by the SIF is used as a ground for fixing "occupational risk categories" as well as for choice on priority actions aimed at their elimination.
Methodological problems. We examined statistical data provided by the SIF Kurgan re-gional office for a period of 1999 to 2012; the results revealed that agricultural production was one of the most injury-prone industries both in terms of the total number of grave injuries and total number of fatalities (2160 cases). And more than 47% of all the injuries occurred in the basic occupational group 8300 "Drivers and operators of mobile equipment" [8].
The analysis results showed that causes and circumstances of injuries occurring in cer-tain occupational groups differed significantly both from each other within a group and from those which were characteristic for agricultural production workers as a whole. This fact proves that an existing approach to occupa-tional risks assessment basing on the infor-mation on industrial threats as per industries data is hardly relevant. And yet, analysis of reports on industrial accidents (so called H-1 forms) revealed that injuries circumstances for a specific basic occupational group are in gen-eral rather identical.
The results of traumatism analysis and screening risk assessment on the basis of crite-ria given in the State Standard Р
51901.23-2012 [3] showed that risks for workers from 8300 occupational group, "Drivers and opera-tors of mobile equipment", were extremely high. It made for the necessity to perform a de-tailed analysis aimed at increasing risk assess-ment validity.
Research goal was to give grounds for methodology of assessment criteria creation and occupational traumatism risks assessment on the example of a basic occupational group.
Data and methods. We identified and ranked priority risk factors (risk indexes) which determined high traumatism level in the course of the detailed research (Table 1).
The statistical analysis results prove a hy-pothesis stated in works [1, 5, 6] that accidents and injuries caused by them are not casual events. They are the result of cause-effect inter-actions within "a worker - working environ-ment" system and can therefore be predicted and prevented.
In this context, planning and implementing activities aimed at increasing workers' safety should be performed as per significance of inju-ries causes and consequences; "a worker - work-ing environment" system is to be developed via improvement of elements which are relatively more significant.
We used Fault Tree4 software to assess cause-effect relations significance. We applied calculation modules system in our analysis and accomplished point estimates of probability of both the system failure as a whole (an injury itself) and intermediate events as well. We de-termined minimal logical expressions for calcu-lating events probability and performed point estimates of probable emergency combinations; the paper presents the results of calculating sig-nificance of initial events and their combina-tions.
Criteria choice and foundation. Foreign practices prove that tools and methods used for calculating risk and its components should pro-vide obtaining of such data which in their form are similar to parameters applied for describing threshold (criterial) values of ultimate,
permis-__________________________
4
sible or acceptable risks [6].
Risk criteria determination involves choice and foundation of parameters which determine monitoring system efficiency concerning set
goals. According to our research goal and rec-ommendations given in the State Standard 51901-2002 [2] as well, we chose the following parameters as risk assessment criteria:
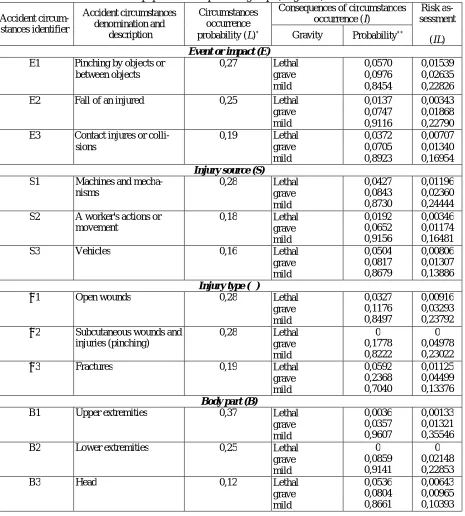
Table 1
Register of risks for "Drivers and operators of mobile equipment" occupational group (fragment)
Accident circum-stances identifier Accident circumstances denomination and description Circumstances occurrence probability (L)∗
Consequences of circumstances occurrence (I)
Risk as-sessment
(IL) Gravity Probability∗∗
Event or impact (E)
E1 Pinching by objects or between objects
0,27 Lethal grave mild 0,0570 0,0976 0,8454 0,01539 0,02635 0,22826
E2 Fall of an injured 0,25 Lethal
grave mild 0,0137 0,0747 0,9116 0,00343 0,01868 0,22790 E3 Contact injures or
colli-sions
0,19 Lethal grave mild 0,0372 0,0705 0,8923 0,00707 0,01340 0,16954
Injury source (S)
S1 Machines and mecha-nisms
0,28 Lethal grave mild 0,0427 0,0843 0,8730 0,01196 0,02360 0,24444 S2 A worker's actions or
movement
0,18 Lethal grave mild 0,0192 0,0652 0,9156 0,00346 0,01174 0,16481
S3 Vehicles 0,16 Lethal
grave mild 0,0504 0,0817 0,8679 0,00806 0,01307 0,13886
Injury type (Т)
Т1 Open wounds 0,28 Lethal
grave mild 0,0327 0,1176 0,8497 0,00916 0,03293 0,23792
Т2 Subcutaneous wounds and injuries (pinching)
0,28 Lethal grave mild 0 0,1778 0,8222 0 0,04978 0,23022
Т3 Fractures 0,19 Lethal
grave mild 0,0592 0,2368 0,7040 0,01125 0,04499 0,13376
Body part (B)
B1 Upper extremities 0,37 Lethal
grave mild 0,0036 0,0357 0,9607 0,00133 0,01321 0,35546
B2 Lower extremities 0,25 Lethal
grave mild 0 0,0859 0,9141 0 0,02148 0,22853
B3 Head 0,12 Lethal
grave mild 0,0536 0,0804 0,8661 0,00643 0,00965 0,10393 Note:
a) a predictable frequency of injuries caused by priority risk factors for workers from the examined occupational group (dis-crete criteria of injuries risks);
b) frequency diagrams depending on consequences of injuries caused by priority risk factors (integral criteria of injuries risks known as F–N curves).
Risk evaluation is a process of comparing an evaluated risk with these risk criteria in or-der to determine its significance. Here we check if a risk in this situation is greater than an ac-ceptable one which is considered to be permis-sible within the existing social values. Absence of occupational traumatism risks criteria in the RF legal regulations as well as absence of ana-lytical tools to calculate such risks made it nec-essary to use relevant analogues from foreign practices as evaluation criteria.
«Best practice code» («Best practical solu-tion»)is a tool which provides practical means and relevant examples from the best domestic or foreign practices. In our context we accept-ed traumatism risk levels which exist now in countries with high occupational safety as a «Best practice code». "Relevance presumption" principle implies that risks which are acceptable for similar occupations, operations, production processes or activities, can be used as a standard, that is, relevant known risk values are used as criteria.
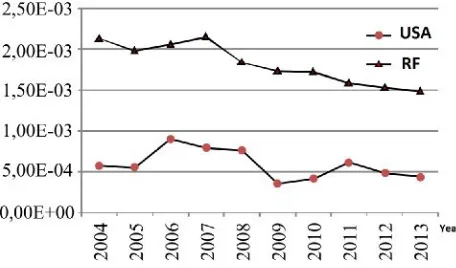
As traumatism levels in the RF are multi-ply higher than those existing in the EU coun-tries and the USA, we chose traumatism pa-rameters in the US agricultural sector as "best practice code" (Figure 1).
Our choice was determined by the fact that information resources of the US Bureau of Labor Statistics which contain more than 20 mil-lion entries are a systematized database on acci-dents for a period of time starting with 1992 and up to present. The data are given on the official web-site of The US National Institute for Occu-pational Safety and Health5.
"Agricultural equipment operators" occupa-tional subgroup 45-2091 was chosen as an
ana-logue for our Russian "Drivers and operators of mobile equipment" occupational group. As per data provided by the US Bureau of Labor Statis-tics, this group consisted of 221.32 thousand workers over 2004-2013; number of non-lethal injuries over the same period amounted to 5,540. 122 people died.
Figure 1. Non-lethal traumatism risks dynamics in agriculture
Analysis of injuries conditions and cir-cumstances. Elimination of causes which make for or directly lead to accidents is one of the most important elements of risk manage-ment. To identify dangers related to occupa-tional activities of injured we analyzed injuries circumstances as per methodology presented in [5]. traumatism dynamics analysis revealed that over 2004-2013 fluctuations in per cent distribution (share) of injuries caused by or related to specific factors were insignificant as they were within confidence interval bounda-ries (µ ± 2σ). It provided a possibility to per-form statistical analysis to determine and rank priority variables/injury circumstances for workers form this occupational group.
Determination of injuries risks discrete criteria. Data on number of workers in the ex-amined occupational group and on a number of accidents made it possible to evaluate injuries risks level.
Risks were evaluated as ratio of a number of injured workers from the "Agricultural
__________________________
5
equipment operators" occupational group (n) to the total number of workers in this occupational group (N):
R = n / N .
Non-lethal injuries risks analysis in the RF over 2004-2013 (see Figure 1) revealed that the observed descending trend of these parameters was within confidence interval boundaries (µ ±
2σ). This regularity was detected for the whole examined set of circumstances and conditions, that is, as per injury character; as per localiza-tion of an injury on a body; as per injury source as well as per impact type (accident type). The results of the performed analysis are shown in Figure 2.
2-3 factors from each group of variables are in increased risks zone which on the whole corresponds to Pareto principle: 20 % means which are required to solve a problem com-pletely, help to solve 80 % of it. It seems obvi-ous that it is those risks which are priority ones in decision-making on strategies and measures aimed at increasing safety of workers in the analyzed occupational group. Basing on trau-matism levels comparison, we can state that quantitative risks values in the US agricultural sector are criterial when workers safety for an-alogical occupations in the RF is assessed.
Analysis of discrete traumatism risks levels allows to evaluate an injury probability without taking their consequences gravity into account. But still data on damage gravity are most signif-icant in developing injuries prevention strate-gies as they most adequately highlight priority trends in increasing workers' safety.
Determination o injuries risks integral criteria. According to «OIICS Guidelines» [19], a number of days during which a worker
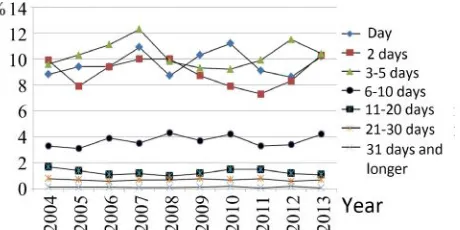
was temporarily disabled is one of the basic parameters indicating injury consequences gravity applied in the US. There are the follow-ing gradations: 1 day; 2 days; 3–5 days; 6–10 days; 11–20 days; 21–30 days; 31 days and longer, but not more than 3 months.
Figure 3 shows data on temporary disabil-ity duration distribution for workers from "Ag-ricultural equipment operators" occupational group over 2004-2013. The results of statistical functions calculations are given in Table 2.
Figure 3. Temporary disability duration distri-bution
T a b l e 2 Statistical functions
Statistical function
Disability duration distribution, % day 2 days 3–5 days 6–10 days 11–20 days 21–30 days
31 days and longer
Median 14,1 11,1 10,3 3,7 1,3 0,7 0,1
Mean deviation 0,90 1,58 0,78 0,37 0,19 0,06 0,01
Standard deviation 1,10 1,85 1,01 0,43 0,23 0,07 0,01
Data analysis revealed that over the whole observation period distribution of consequenc-es gravity probabiliticonsequenc-es Ni was within the
boundaries of confidence interval N±2 N. It makes for statistical research possibility as-suming that injury distribution N with certain consequences gravity i remains unchanged, that is, Ni = const with probability equal to
95 %.
To obtain approximating curve equation in an analytical form and to evaluate validity of the performed approximation with Excel tools, we accomplished regression analysis of the obtained data. When fitting a trend line, Excel automatically calculates R2 value which char-acterizes approximation validity.
R2 as approximation validity value is de-termined as per formula
2 2
2 ˆ
( )
1 ,
( )
i i
i
y y
R
y y
− = −
−
∑
∑
where yi are actual values; yˆi are ap-proximating functions value.
The results showed that maximum value of approximation validity R2 = 0.9267 corre-sponded to exponential distribution
y = ce–bх
Figure 4. Correlation between relative injuries frequency and damage gravity
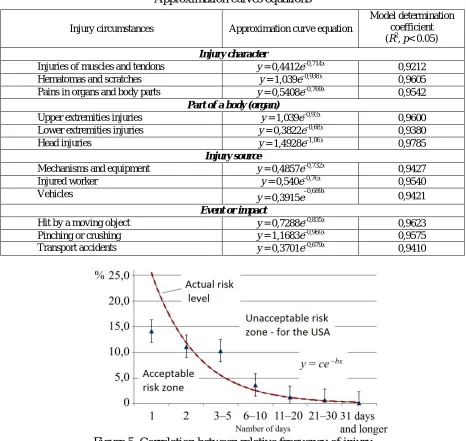
T a b l e 3 Approximation curves equations
Injury circumstances Approximation curve equation
Model determination coefficient (R2, p< 0.05)
Injury character
Injuries of muscles and tendons y = 0,4412e–0,714x 0,9212
Hematomas and scratches y = 1,039e–0,938x 0,9605
Pains in organs and body parts y = 0,5408e–0,769x 0,9542
Part of a body (organ)
Upper extremities injuries y = 1,039e–0,93x 0,9600 Lower extremities injuries y = 0,3822e–0,68x 0,9380
Head injuries y = 1,4928e–1,06x 0,9785
Injury source
Mechanisms and equipment y = 0,4857e–0,732x 0,9427
Injured worker y = 0,540e–0,76x 0,9540
Vehicles y = 0,3915e–0,689x 0,9421
Event or impact
Hit by a moving object y = 0,7288e–0,835x 0,9623
Pinching or crushing y = 1,1683e–0,969x 0,9575
Transport accidents y = 0,3701e–0,679x 0,9410
The obtained dependence is in its essence an analogue of a well-known F–N-curve, which rep-resents a graphic interpretation of correlation be-tween an event probability and gravity. In this case the curve shows correlation between relative injuries frequency (as a % of total number of cas-es) and gravity of damage caused by them (as disability duration median / period) for workers from "Agricultural equipment operators" occu-pational group.
Injuries risks level (R) can be given as:
R = f (F, N),
where F are discrete frequencies of accidents which caused disability days, N is gravity of the given accidents consequences.
We obtained similar dependences for all de-tected priority risk factors during our research. Integral risk levels as per most significant injury circumstances are given in Table 3.
So, allowing for multiply higher injury risks for workers employed at the RF agricul-tural enterprises (see Figure 2), we can state that y = ce–bх curves based on the long-term statistical observation of workers from rele-vant occupational groups in the USA can be used as criterial ones in evaluating acceptabil-ity of relevant injury circumstances and risk levels (Figure 5).
Conclusions. According to our research goal we took predictable frequency of injuries caused by priority risk factors for workers from the examined occupational group (discrete inju-ries risks criteria) and frequency diagrams de-pending on consequences of injuries caused by priority risk factors (integral injuries risks crite-ria known as F–N curves) as criteria of occupa-tional traumatism risks evaluation.
We detected that increased risks levels were caused by a limited number of factors from each group of variables which in general corresponded to Pareto principle: 20 % means
which are required to solve a problem com-pletely, help to solve 80 % of it.
"Relevance presumption" principle implies that risks which are acceptable for similar occu-pations, operations, production processes or ac-tivities, can be used as a standard, that is, rele-vant known risk values are used as criteria. As traumatism levels in the RF are multiply high-er than those existing in the EU countries and the USA, and there aren't any standard values for occupational traumatism risks existing in the RF, we chose traumatism parameters in the US agricultural sector as a standard value.
The y = ce–bх dependence obtained in the course of our research is an analogue of a well-known F–N-curve which shows correlation between an accident probability and gravity. In our case the curve shows correlation between relative injuries frequency and gravity of dam-age caused by them as a disability duration median for workers from the examined occu-pational group.
The research results and the approxima-tion validity values R² > 0.9 which we ob-tained via regression analysis prove that the detected y = ce–bхdependence adequately re-flects the essence of cause and effect relations between injury circumstances and conse-quences they have. Hence, the obtained ap-proximating curve equations can be criterial in evaluating injury circumstances signifi-cance and risks for workers from relevant oc-cupational groups in the RF industry and ag-riculture.
Results of priority risks evaluation as well as assessment of factors which determine them make it possible to take decisions relat-ed to development of strategies, programs, methods and means for increasing safety of workers from an analyzed occupational group.
References
2. Menedzhment riska. Analiz riska tekhnologicheskikh sistem: Gosudarstvennyi standart Rossiiskoi Federatsii [Risk management. Risk analysis of technological systems: The RF State Standard 51901.1-2002.]. Available at: http: //docs.cntd.ru/document/1200030153 (22.03.2016) (in Russian).
3. Menedzhment riska. Reestr riska. Rukovodstvo po otsenke riska opasnykh sobytii dlya vklyucheniya v reestr riska [Risk management. Risk register. Guide on assessment of hazards risk for inclusion in risk register: The RF National Standard 51901.23-2012]. Available at: http: //docs.cntd.ru/document/1200100076 (22.03.2016) (in Russian).
4. Artem'ev V.B., Kilin A.B., Shapovalenko G.N., Osharov A.V., Radionov S.N., Kravchuk I.L. Kontseptsiya operezhayushchego kontrolya kak sredstva sushchestvennogo snizhe-niya travmatizma [Predictive control concept as a mean of substantial traumatism lowering]. Ugol', 2013, no. 5, pp. 82–85 (in Russian).
5. Levashov S.P. Manilo I.I. Otsenka riskov professional'nogo travmatizma [Occupational traumatism risk assessment]. Chelovek i trud, 2013, no. 11–12, pp. 62–70 (in Russian).
6. Levashov S.P., Shkrabak V.S. Professional'nyi risk: metodologiya monitoring i analiza [Occupational risk: Monitoring and analysis methodology]. In: V.S. Shkrabak ed. Kurgan, Izdatel'stvo Kurganskogo gosudarstvennogo universiteta Publ., 2015, 308 p. (in Russian).
7. Lisovskii V.V., Grishin V.Yu., Kravchuk I.L., Galkin A.V. Ob operativnom upravlenii riskami travmirovaniya personala: uderzhanie opasnoi proizvodstvennoi situatsii na priemlemom urovne riska [On operative managing risks of workers' traumatism: keeping a dangerous production situation at an acceptable risk level]. Ugol', 2013, no. 11, pp. 46–52 (in Russian).
8. Obshcherossiiskii klassifikator zanyatii [Russian Classification of Occupations 010-2014 (MSKZ-08)]. Available at: URL: http: //docs.cntd.ru/document/1200121893 (24.04.2016) (in Russian).
9. Pustovit A.E., Kozlov V.I. Prognozirovanie travmatizma sredi shakhterov posredstvom analiza riskov travmirovaniya [Miners traumatism forecasting by means of injury risk analysis]. Sibbezopasnost'-Spassib, 2013, no. 1, pp. 234–238 (in Russian).
10. Sevast'yanov B.V., Shadrin R.O. Prognozirovanie riskov travmirovaniya rabotayushchikh v munitsipal'nykh obrazovaniyakh Udmurtskoi respubliki [Prediction of injury risks to workers employed in municipalities of the Udmurt Republic]. Problemy prognozirovaniya, 2012, no. 1, pp. 152–157 (in Russian).
11. Selivanov L.K. Otsenka riska travmirovaniya v Rossiiskoi Federatsii i federal'nykh okrugakh [Assessment of the risk of injury in the Russian Federation and federal districts]. Aktual'nye problemy aviatsii i kosmonavtiki, 2016, vol. 1, no. 12, pp. 975–977 (in Russian).
12. Suvorov S.B. Strukturirovanie riskov travmirovaniya na rabochikh mestakh [Structuring risks of traumatizing at working places]. Izvestiya vysshikh uchebnykh zavedenii. Gornyi zhurnal, 2007, no. 5, pp. 42– 44 (in Russian).
13. Susoeva I.V., Bukalov G.K., Repin V.M. Metod otsenki riska travmirovaniya s uchetom ushcherba na tekstil'nom predpriyatii [The Method of Estimation of Traumatizing Risks Taking into Account Damages at Textile Enterprises]. Izvestiya vysshikh uchebnykh zavedenii. Tekhnologiya tekstil'noi promyshlennosti, 2012, vol. 338, no. 2, pp. 137–141 (in Russian).
14. Feyer A., Williamson A.W. A Classification System for Causes of Occupational Accidents for Use In Preventive Strategies. Scand. J. Work Environ. Health, 1997, vol. 17, pp. 302–311.
15. Jovanović D., Bašić S., Mitrović J. Injury risk to young car drivers in traffic on territory of Republic of Serbia. Transport Problems, 2010, vol. 5, no. 2, pp. 21–30.
16. Leigh J.P., Du J., McCurdy S. A. An estimate of the U.S. government’s undercount of nonfatal occupational injuries and illnesses in agriculture. Annals of Epidemiology, 2014, vol. 24, no. 4, pp. 254– 259.
17. Mitropoulos P., Namboodiri M. New method for measuring the safety risk of construction activities: task demand assessment. Journal of Construction Engineering and Management, 2011, vol. 137, no. 1, pp. 30–38.
19. Occupational Injury and Illness Classification System. Centers for Disease Control and Prevention. Available at: http: //wwwn.cdc.gov/wisards/oiics/Trees/MultiTree.aspx?Year=2012 (12.02.2016).
20. Schaufler D.H., Yoder A.M., Murphy D.J., Schwab C.V., Dehart A.F. Safety and health in on-farm biomass production and processing. Journal of Agricultural Safety and Health, 2014, vol. 20, no. 4, pp. 283–299.
Levashov S.P. Analyzing and developing criteria for assessing occupational traumatism risks basing on «Best Practice Code». Health Risk Analysis, 2017, no. 2, pp. 35–44. DOI: 10.21668/health.risk/2017.2.04.eng