Vol. 5, No. 4 (2015): 1100-1107 Research Article
Open Access
I
ISSSSNN::22332200--6688110 0
Stability Indicating HPLC Method Development and
Validation for the Simultaneous Estimation of
Propyphenazone, Caffeine and Paracetamol by
Gradient Elution Technique
Narottam Pal
1*, A. Srinivasa Rao
2and P. Ravi Kumar
31
Assistant Professor, Department of Pharmaceutical Analysis, Bhaskar Pharmacy College (JB Group of Educational Institutions), Yenkapally (V), Moinabad (M), R.R.District, Hyderabad.
2
Principal, Bhaskar Pharmacy College (JB Group of Educational Institutions), Yenkapally (V), Moinabad (M), R.R. District, Hyderabad.
3
Manager, Bio-analytical Department, Aizant Drug Research Solutions Pvt. Ltd, Hyderabad, India.
* Corresponding author: Narottam Pal, e-mail: [email protected]
ABSTRACT
The present work is a method development and validation for the simultaneous estimation as well as stability studies for the combined tablet formulation of Paracetamol, Caffeine and Propyphenazone by using reverse phase liquid chromatography with gradient elution where the stationary phase used was ODS column (150 mm,4.6 mm,5 µ) , mobile phases were buffer (Ortho phosphoric acid 0.1%):Acetonitrile(85:15) at the initial stage and buffer : Acetonitrile (15:85) at the later stage, pH of the system was maintained 3.0, flow rate 1.5 ml/min, eluent was monitored at 280 nm., retention time was found to be in minutes 2.268 , 3.059 and 8.5 for Paracetamol, Caffeine and Propyphenazone respectively. Linearity range was 62.5 µg/ml to 375 µg/ml, 12.5 µg/ml to 75 µg/ml and 37.5 µg/ml to 225 µg/ml respectively. The developed method was validated as per ICH guideline and found to be an ideal one for regular analysis in the laboratory.
Keywords:
HPLC, Gradient elution, Propyphenazone, Paracetamol, and Caffeine.1. INTRODUCTION
Paracetamol[1,2] is considered as one of the safest antipyretic and analgesics as it does not cause significant side effects except hepato toxicity a little in some cases when it is used for a long period of time or overdose. The main mechanism proposed is the inhibition of cyclo-oxegenase (COX), and recent finding suggests that it is highly selective for COX-2. Paracetamol is metabolized primarily in the liver, into toxic and non toxic products. Figure1 represents the chemical structure of Paracetamol. Chemically the compound is known as N-(4-hydroxyphenyl) ethanamide.
Caffeine [1,3] is a centrally acing drug used mostly along with pain relievers, cough formulation etc. Even though it is a drug but is found in many soft drinks, chocolate and some other OTC products. Figure 2
represents chemical structure of Caffeine. Chemically the compound is known as 1,3,7-Trimethylpurine-2,6-dione.
Figure 1: Chemical Structure of Paracetamol
Propyphenazone [1,4] is an analgesics, mostly used as a combination along with other antipyretic or anti inflammatory or analgesics for faster onset of action. It is one of the most popular choices indicated for headache. Figure 3 represents chemical structure of Propyphenazone.Chemically the compound is known as
4-Isopropyl-1,5-dimethyl-2-phenyl-1,2-dihydro-3H-pyrazol-3-one.
Figure 2: Chemical Structure of Caffeine
Figure 3: Chemical Structure of Propyphenazone
According to literature Survey [5-9] it was noted that there were very less number of work done for the combined formulation(tablet) of Propyphenazone, Paracetamol and Caffeine. Certain methods are available like JULIA AVRAMOVA[5] developed a method for determination of this drugs from blood sample by High Performance Liquid Chromatography, Deniz Emre, Nuran Ozaltin have innovated a method by capillary chromatography, but no good method was suggested for the above said three compounds in bulk as well as combined formulation like tablet by High Performance Liquid Chromatography. In fact the tablet form of these three combined drugs is extensively used in pain management. Therefore a good analytical method was required to develop for determination of the same. Hence we made a sincere attempt to find out a new, simple, rapid and accurate HPLC method for the assay of Propyphenazone, Caffeine and Paracetamol simultaneously.
2. MATERIALS AND METHODS
2.1 Instruments:
HPLC Waters 2695 Separations Module equipped with Quaternary pump with Auto sampler and Auto injector, PDA Detector 2996, Sonicator (Sartorius), Digital balance (Sartorius-M500P), PH meter (Thermo scientific).
2.2 Chemicals:
All the chemicals and reagent [10] were of analytical grade. Various chemicals used were Ortho phosphoric Acid (RFCL), Acetonitrile (Rankem), Methanol (Merck) and Milli Q water (Rankem).
2.3 Chromatographic Condition:
Mobile Phase- (A)Buffer : Acetonitrile(85:15)- zero to four minutes, (B)Buffer : Acetonitrile (15:85)- four to
twelve minutes, Stationary Phase- ODS column(150mm,4.6mm,5µ), Flow rate 1.5 ml/min, PH 3.0, Temperature 30º C, Detecting wave length 280 nm.
2.4 Preparation of Mobile Phase:
Buffer: (0.1%OPA) 1 ml of Ortho phosphoric acid solution was taken in a 1000 ml of Volumetric flask, added about 100 ml of milli-Q water and final volume was made up to 1000 ml with milli-Q water. Buffer and Acetonitrile were taken in the ratio 85:15 “A” (initial). Buffer and Acetonitrile were taken in the ratio 15:85 “B” (final).
2.5 Diluent:
First dissolved in Methanol and made up the volume with the mixture of water and Acetonitrile (50:50).
2.6 Preparation of standard:
Accurately Weighed and transferred 15 mg of Propyphenazone, 25 mg of Paracetamol and 5 mg of caffeine working Standards into a 10 ml clean and dry volumetric flask, added 3/4th volume of diluent, sonicated for 5 minutes and made up to the final volume with diluents. 1 ml from the above stock solutions was taken into a 10 ml volumetric flask and made up to 10 ml.
2.7 Preparation of sample:
Ten tablets were weighed, powdered and required calculated quantity was transferred into a 100 ml volumetric flask, 30 ml of diluent was added and sonicated for 25 min, further the volume was made up with diluent and filtered. From the filtered solution 0.4 ml was pipetted out into a 10 ml volumetric flask and made up to 10 ml with diluent. The new method was developed and analytical/ chromatographic parameters were established after several trials.
2.8 Validation Parameters:
The method was validated as per ICH Guideline [11]. The validation parameters considered were accuracy, precision, intermediate precision, linearity, and limit of detection, limit of quantification and robustness studies.
2.9 System suitability:
The method was developed after considering many chromatographic parameters[12]. Initially the separation of compounds were done by Isocratic elution using C12 column, retention time was optimum
for Paracetamol and Caffeine but for Propyphenazone it was more than 20 minutes. Tried with up to 90% organic part in mobile phase, Propyphenazone eluted in reasonable time, but again plate count was much less. With C18 column plate count was acceptable but
2.10 Assay of marketed formulation:
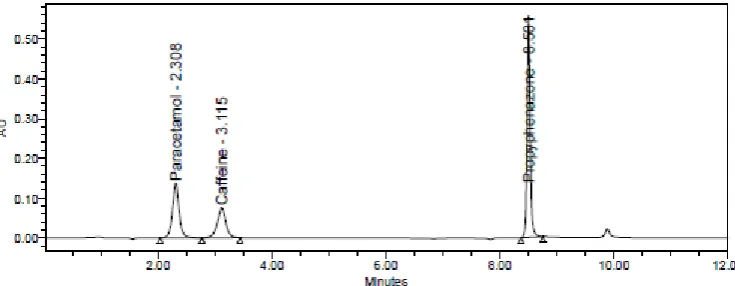
The formulation (Tablet- Saridon) was purchased from local medical store and was assayed. Figure-4 is a representing typical chromatogram of paracetamol,
Caffeine and Propyphenazone. The result in terms of percentage purity was found to be 99.89 %, 100.69% and 100.21% for paracetamol, Caffeine and Propyphenazone respectively.
Figure 4: A typical chromatogram of Paracetamol, Caffeine and Propyphenazone
2.11 Stability Studies:
Force degradation or stability studies [13] were conducted by providing different physic-chemical environment. Figure 5 to Figure 10 represents the chromatograms due to stress degradation of the compounds.
2.12 Oxidation:
To 1 ml of stock solution of Paracetamol, caffeine and Propyphenazone, 1 ml of 20% hydrogen peroxide (H2O2) was added separately. The solutions were kept for 30 min at 600c. For HPLC study, the resultant solution was diluted to obtain 150 µg/ml, 250 µg/ml and 50 µg/ml solution and 10 µl was injected into the system and the chromatograms were recorded to assess the stability of sample.
2.13 Acid Degradation Studies:
To 1ml of stock s solution Paracetamol, caffeine and Propyphenazone, 1 ml of 2N Hydrochloric acid was added and refluxed for 30 minutes at 60 0C.The
resultant solution was diluted to obtain 150 µg/ml, 250 µg/ml and 50 µg/ml solution with mobile phase and 10 µl solutions were injected into the system and the chromatograms were recorded to assess the stability of sample.
2.14 Alkali Degradation Studies:
To 1 ml of stock solution Paracetamol, caffeine and Propyphenazone, 1 ml of 2N sodium hydroxide was added and refluxed for 30 minutes at 60 0C. The
resultant solution was diluted to obtain 150 µg/ml, 250 µg/ml and 50 µg/ml solution with mobile phase and 10 µl was injected into the system and the chromatograms were recorded to assess the stability of sample.
2.15 Dry Heat Degradation Studies:
The standard drug solution was placed in oven at 105 °C for 6 hours to study dry heat degradation. For HPLC
study, the resultant solution was diluted to get 150 µg/ml, 250 µg/ml and 50 µg/ml solution with mobile phase and10 µl was injected into the system and the chromatograms were recorded to assess the stability of the sample.
2.16 Photo (UV) Stability Studies:
The photochemical stability of the drug was also studied by exposing the standard drug solution to UV Light by keeping the solution in a beaker inside the UV Chamber for 7 days. For HPLC study, the resultant solution was diluted to obtain 150 µg/ml, 250 µg/ml and 50 µg/ml solutions with mobile phase and 10 µl was injected into the system and the chromatograms were recorded to assess the stability of sample.
2.17 Neutral (water) Degradation Studies:
Stress testing under neutral conditions was studied by refluxing the standard drug solution in water for 6 hrs at a temperature of 60 ºC. For HPLC study, the resultant solution was diluted to 150 µg/ml, 250 µg/ml and 50 µg/ml solution with mobile phase and 10 µl were injected into the system and the chromatograms were recorded to assess the stability of the sample.
3. RESULTS AND DISCUSSION
3.1 Method Validation:
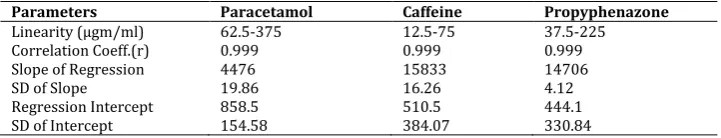
For Linearity test gradually increased concentration of three drugs Paracetamol ranging from 62.5 µgm/ml to 375 µgm/ml, Caffeine 12.5 µgm/ml to 75 µgm/ml and Propyphenazone 37.5 µgm/ml to 225 µgm/ml in combined form was injected in the column. Concentration Vs area was used to build calibration curve. The Calibration curves for all the three drugs were linear at specified range and the value of ‘r2’ was
Table 1: Regression Analysis of Calibration Curve
Parameters Paracetamol Caffeine Propyphenazone
Linearity (µgm/ml) 62.5-375 12.5-75 37.5-225
Correlation Coeff.(r) 0.999 0.999 0.999
Slope of Regression 4476 15833 14706
SD of Slope 19.86 16.26 4.12
Regression Intercept 858.5 510.5 444.1
SD of Intercept 154.58 384.07 330.84
Accuracy test was performed by spiking method. Table-2 describes the accuracy results. Each time (three replicates) with sample standard was added by 50%,
100% and 150%. The recovery was observed in terms of area and found to be within limit.
Table 2: Accuracy study
Amount of Sample Amount of Standard Amount recovered % recovered
Para Caff propy Para Caff propy Para Caff propy Para Caff propy
250 50 150 125 25 75 124.15 25.04 74.70 99.32 100.01 99.60
250 50 150 250 50 150 251.13 49.80 150.49 100.45 99.61 100.33
250 50 150 375 75 225 374.68 74.09 223.26 99.91 98.78 99.22
Precision test was performed by injecting similar concentration for each compound six times into the column. Table-3 describes about precision observations, Limit of Detection, Limit of Quantification
and other parameters. The result was analyzed in terms of standard deviation and %RSD. Limit of detection and quantification were calculated taking slope and standard deviation in consideration.
Table 3: Summary of Validation Parameters
Parameters Paracetamol Caffeine Propyphenazone
Retention Time(min) 2.299 3.101 8.486
LOD (µgm/ml) 0.18 0.03 0.05
LOQ (µgm/ml) 0.55 0.09 0.14
Accuracy % 99.32-100.45 98.78-100.01 99.22-100.33
Intraday Precision RSD% 1.5 0.7 1.2
Inter day precision RSD% 0.8 1.0 0.6
Robustness study was done by changing chromatographic parameters. Table No.4 describes the Results of robustness studies. Chromatographic
parameters like varying flow rate of mobile phase, temperature and mobile phase composition etc. were considered.
Table 4: Summary of Robustness Study
Paracetamol
Chromatographic Condition Retention Time (minutes)
USP Theoretical Plates
Asymmetric
Factor % Assay
Flowrate1.8ml/min 2.125 1137 0.96 99.22
Flowrate1.2ml/min 2.310 637 1.01 100.04
Buffer: ACN(93.5:6.5) 2.330 1141 1.04 99.03
Buffer: ACN(76.5:23.5) 2.110 635 0.96 99.98
Temperature(350c) 2.259 2564 1.05 99.99
Temperature(250c) 2.299 2498 1.06 98.01
Caffeine
Flowrate1.8ml/min 2.774 1307 0.91 98.51
Flowrate1.2ml/min 3.133 772 1.00 100.96
Buffer: ACN(93.5:6.5) 3.150 1135 1.08 99.58
Buffer: ACN(76.5:23.5) 2.781 766 0.92 100.55
Temperature(350c) 3.020 2800 0.98 100.28
Temperature(250c) 3.102 2748 1.02 98.97
Propyphenazone
Flowrate1.2ml/min 8.502 81438 0.98 99.00
Flowrate0.8ml/min 8.505 65655 0.98 99.89
ACN: Buffer (93.5:6.5) 8.501 73961 1.01 100.05
ACN: Buffer (55:45) 8.785 65575 0.98 99.62
Temperature(350c) 8.489 131352 1.14 98.88
Temperature(250c) 8.491 152912 1.10 99.09
System suitability parameters are described in Table-5.
Stability studies were conducted in different
physicochemical condition. Tables 6 to Table 11 describe results of force degradation.
Table 5: System suitability parameters
Parameters Paracetamol Caffeine Propyphenazone
Retention Time 2.299 3.101 8.486
Retention Time RSD 0.45 0.44 0.32
Theoretical plates 2610 2862 156648
Asymmetric Factor 1.04 0.98 1.12
Resolution - 3.5 32.9
Capacity Factor 1.3 2.0 7.5
3.2 Acid environment
Figure 5: Chromatogram after acid degradation
Table 6: Acid Degradation Results
Peak Name RT Area %Area Purity1
Angle Purity1 Threshold USP Plate Count USP Tailing
1 Paracetamol 2.304 1108250 28.04 0.072 0.282 2609 1.1
2 Caffeine 3.105 755919 19.30 0.296 0.427 2858 1.0
3 Peak1 5.188 557 0.01 82.410 90.000 7783 0.6
4 Peak2 5.975 875 0.02 50.922 90.000 23852 0.7
5 Propyphenazone 8.481 2161725 52.63 0.181 0.275 156781 1.2
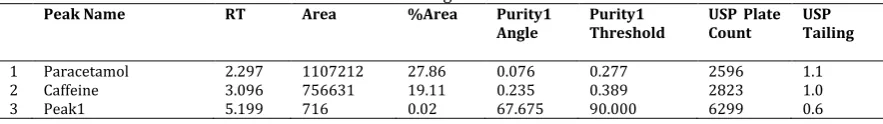
3.3 Alkali environment
Figure 6: Chromatogram after alkali degradation
Table 7: Alkali Degradation Results
Peak Name RT Area %Area Purity1
Angle Purity1 Threshold USP Plate Count USP Tailing
1 Paracetamol 2.297 1107212 27.86 0.076 0.277 2596 1.1
2 Caffeine 3.096 756631 19.11 0.235 0.389 2823 1.0
4 Peak2 5.986 608 0.02 66.057 90.000 13556 0.6
5 Propyphenazone 8.495 2168151 53.00 0.211 0.276 135881 1.1
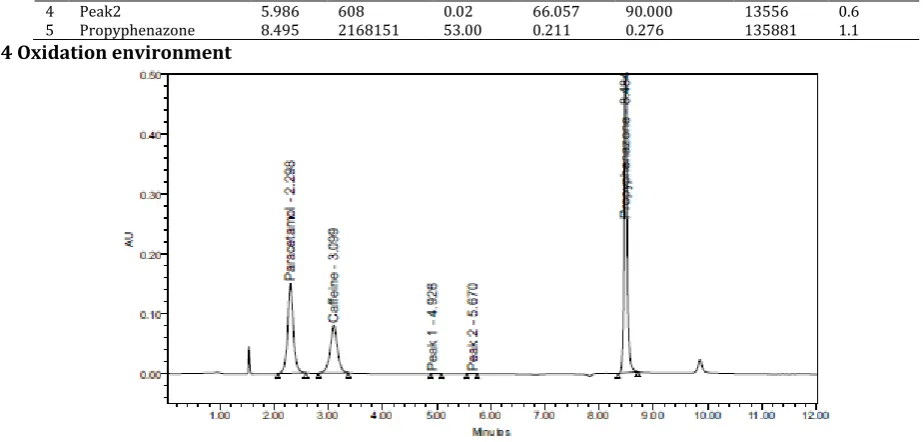
3.4 Oxidation environment
Figure 7: Chromatogram after Oxidation
Table 8: Results of Oxidation Degradation
Peak Name RT Area %Area Purity1
Angle Purity1 Threshold USP Plate Count USP Tailing
1 Paracetamol 2.298 1129619 27.86 0.079 0.282 2561 1.0
2 Caffeine 3.099 770061 19.18 0.301 0.430 2748 1.0
3 Peak1 4.926 751 0.02 2631 2.2
4 Peak2 5.670 436 0.01 20065 0.8
5 Propyphenazone 8.484 2170375 52.93 0.221 0.280 144539 1.1
3.5 Elevated heat environment
Figure 8: Chromatogram after dry-heat degradation
Table 9: Dry-heat Degradation Results
Peak Name RT Area %Area Purity1
Angle
Purity1 Threshold
USP Plate Count
USP Tailing
1 Paracetamol 2.298 1134765 27.71 0.076 0.284 2499 1.0
2 Caffeine 3.099 776853 19.08 0.265 0.441 2792 1.0
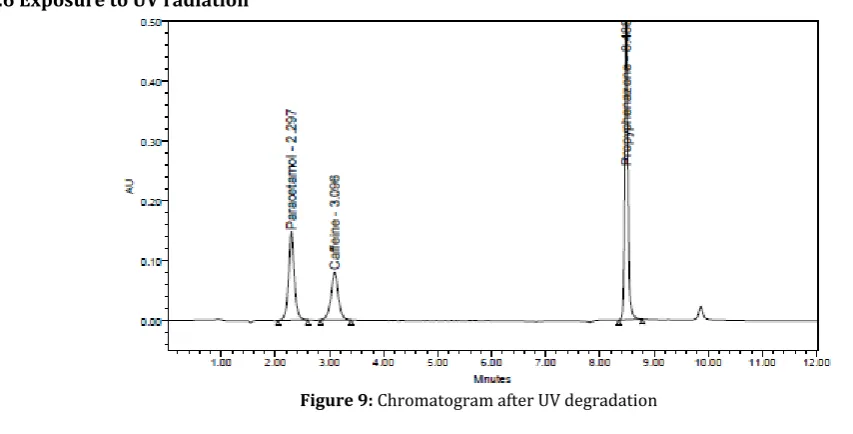
3.6 Exposure to UV radiation
Figure 9: Chromatogram after UV degradation
Table 10: UV Degradation Results
Peak Name RT Area %Area Purity1
Angle Purity1 Threshold USP Plate Count USP Tailing
1 Paracetamol 2.297 1149143 27.82 0.073 0.280 2455 1.0
2 Caffeine 3.095 774778 19.10 0.256 0.417 2709 1.0
3 Propyphenazone 8.488 2097161 53.08 0.219 0.280 136406 1.1
3.7 Neutral environment
Figure 10: Chromatogram after Water degradation
Table 11: Water Degradation Results
Peak Name RT Area %Area Purity1
Angle Purity1 Threshold USP Plate Count USP Tailing
1 Paracetamol 2.304 1137987 27.80 0.073 0.280 2528 1.0
2 Caffeine 3.111 784400 19.02 0.250 0.418 2729 1.0
3 Propyphenazone 8.488 2151606 53.18 0.202 0.283 131296 1.1
4. CONCLUSION
A rapid, simple accurate, precise and economic HPLC method was developed for the simultaneous estimation and stability studies of Propyphenazone, Caffeine and
method can be used for the determination of the above mentioned drugs in the laboratory on regular basis.
5. ACKNOWLEDGEMENT
We express our sincere gratitude to J.B.Group of Educational Society for providing continuous support in every aspect of our work and also creating an encouraging as well as positive environment for new, innovative, creative and research work. We thank Minnova Life Sciences, Bangalore, Lee Pharma Hyderabad for providing adequate ideas on practical HPLC method development work, S.L. Drugs Hyderabad for giving reference standard for our research work. We also thank to the leader and entire team of Spectrum Lab. Hyderabad for valuable support.
6. REFERENCES
1. Indian Pharmacopoeia 2014, volume II, page 1237; volume
III, page 2429 and 2586.
2. www.nhs.uk/condions/painkillers-paracetamol/pages/Ir
3. kidshealth.org/teen/food_fitness/nutrition/caffeine.html
4. en.wikipedia.org/wiki/saridon
5. JULIA AVRAMOVA. simultaneous determination of
Propyphenazone, Paracetamol and Caffeine in blood by high
performance liquid chromatography, Journal of
pharmaceutical and biomedical analysis, vol-7,no.10, page.1221-1224,
6. Deniz Emre, Nuran Ozaltin, simultaneous determination of
Paracetamol, Caffeine and Propyphenazone in ternary
mixture by miceller electrokinetic capillary chromatography, journal of chromatography –B Vol.847, issue 2, page: 126-132,
7. KULDEEP DEL VADIYA, RIYU KIMBAHUNE, PRACHI KABRA
et al, spectrophotometric simultaneous analysis of paracetamol, propyphenazone and caffeine in tablet dosage form, International journal of pharmacy and pharmaceutical sciences, Vol. 3, suppl 3, page-170-174
8. Erdal Dink, Filiz Yurtsever, Feyyaz Onur, simultaneous
determination of acyive ingredients in binery mixture containing caffeine using liquid chromatography and spectroscopy method, Turkish journal of pharm sci, 1 (2), 115-138,
9. M.Levent ALTUN, HPLC method for the analysis of
paracetamol, caffeine and dipyrone, Turkish j of chemistry, vol 26, 521,
10.Budavari S (2001) The Merck Index, Edn- 13, Merck & Co., Whitehouse station, NJ.
11.ICH HARMONISED TRIPARTITE GUIDELINE ; VALIDATION
OF ANALYTICAL PROCEDURES: TEXT AND METHODOLOGY---Q2(R1)
12.Practical HPLC Method Development; Second Edition, Lloyd
R. Snyder, Joseph J. Kirkland, Joseph L. Glajch
13.S. Yoshioka, V. Stella (2000). Stability for Drugs and Dosage
Forms. Kluwer Academic Plenum Publishers, New York, pp. 11-12.
*****