DOI:10.31142/etj/v4i5.01, I.F. - 4.449
© 2019, ETJ
585
Dr. Ogunsina Olusola
1, ETJ Volume 04 Issue 05 May 2019
Developing Regression Based Approximate Quantities Models for
Quantification of Electrical Cables for Residential Building
Construction in Nigeria
Dr. Ogunsina Olusola
1, Dr. Ugochukwu, Stanley C.
2, Oguejiofor Josiah E.
3, Dr. Agu Nathan N.
41,2,3,4 Department of Quantity Surveying, Nnamdi Azikiwe University, PMB 5025, Awka, Nigeria
Corresponding Author: Dr. Ugochukwu, Stanley C
Abstract:
In quantity surveying practice, the building and engineering standard method of measurement 4th edition stipulates that electrical final circuits should be enumerated during quantity take-off of electrical cables. This approach poses challenges during estimation and material scheduling because it does not readily provide the quantity (length) and estimate of cables needed for the electrical installation works. This study was aimed at developing regression based approximate quantities models which can be used by quantity surveyors to predict lighting and power electrical cables quantities for proposed residential building projects. Take-off(measurement) of thirty architectural and electrical drawings designed by registered architects and electrical engineers was carried out to obtain data on the number of lighting points and socket outlets as well as the corresponding length of cables, which was further validated by an experienced quantity surveyor and electrical engineer and analysed using linear regression. Twolinear regression models were generated as follows (1) PC qty = 317.237 + 14.358 SOqty, Where: PC qty = power cable quantities
(in metres); SOqty= number of socket outlets (2) LC qty = 363.867 + 13.518 LPqty Where: LC qty = Lighting cable quantities(in
metres); LPqty= number of lighting points. These models have time saving potentials, but their efficacy relies heavily on the
accurate measurement of the number of lighting and power points. These models are recommended for use by practicing quantity surveyors to generate realistic feasibility estimates of electrical cables and beat short tender deadlines.
Keywords:
Approximate Quantities, Electrical cables, Quantification, Nigeria, Regression Models, Residential Buildings.I. INTRODUCTION
According to Ashworth1 , quantification of construction
works has an important role in the project-planning phase since many cost relevant decisions (such as materials selection and pricing) are made at this stage. Unfortunately, accurate quantities and estimates are hard to obtain at that stage due to the fact that construction projects are recently becoming highly complicated diversified and even bigger, with the level of uncertainty of the success is rising.
The afore-mentioned scenario applies to a large extent to electrical installation works. These works are specialized construction works performed during the erection or reconstruction of buildings or structures intended for various purposes and that entails the installation of electric wiring and electrical equipment. In addition to this, cables and wires are laid and are connected to the installed electrical equipment.
Taking-off or Measurement of electrical works from electrical drawings which is aimed at generating the quantities and cost of such works is carried out by the quantity surveyor(QS).The Nigerian Institute of Quantity
Surveyors (NIQS)2,3defines the QS asa cost and
procurement management expert who is concerned with financial probity and achieving value for money in the
conceptualization, planning and execution of development projects for both new and rehabilitation/refurbishment or maintenance works. He is thus the development cost adviser in the building, civil and other engineering projects. Lee,
Trench and Willis4 surmise that the training and knowledge
of the modern Quantity Surveyor equips him to provide services in all aspects of procurement, contractual and project cost management. The quantity surveying profession is primarily concerned with the detailed calculations and assessment of quantities of materials and labour required for all construction activities such as building, civil and heavy engineering works. The QS uses the Standard Method of Measurement (SMM) as a technical guide for measurement of construction works. The SMM currently used in Nigeria is the Building and Engineering Standard Method of
Measurement, 4th edition (BESMM4) which encompasses
measurement of Building and engineering works.
Engineering services in building projects comprise of mechanical and electrical services. Basic categories of electrical services include; normal and emergency systems, life safety systems, audio and video systems, electric heating, specialized grounding systems and items associated
with these categories. NIQS5 categorizes electrical
586
Dr. Ogunsina Olusola
1, ETJ Volume 04 Issue 05 May 2019
systems and communications/security/controls systems as specified in appendix B of the BESMM4.
The consumer’s controller circuit(final circuit) starts from a service cable which enters the building to consumer’s unit or distribution board. Part of consumer’s controller consists of service fuse, main switch. The final circuit starts from the consumer’s unit or distribution board to load. This part consists of fuse circuit breaker, socket outlet, ceiling rose, and lamp holder. The number of final circuits will depend on the types of load supplied, and must be designed to comply with the requirements for over current protection, switching and the current-carrying capacity of conductors. Every circuit must be separate from others and must be connected to its own over current protective fuse or circuit breaker in a switch fuse, distribution board, and consumer’s unit.
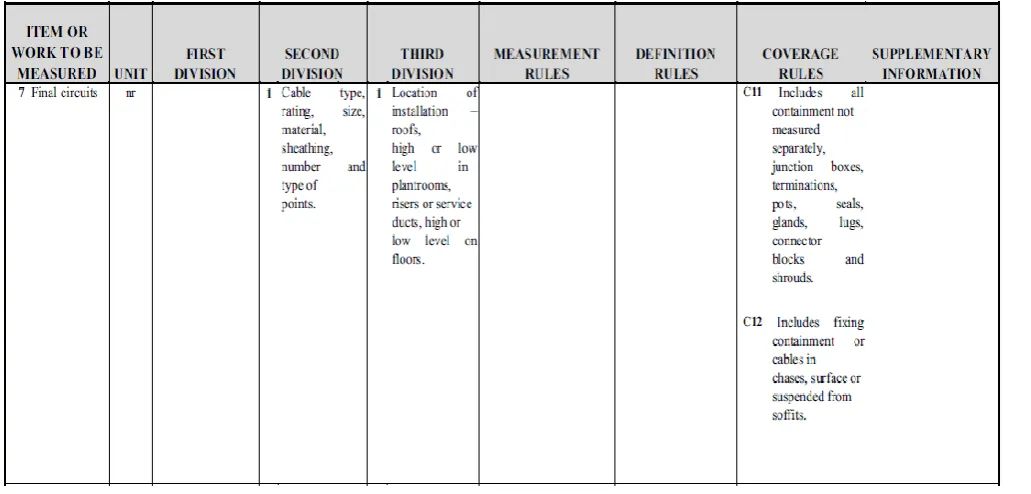
The BESMM4; a publication of the NIQS5 stipulates that
final circuits’ measurement should be enumerated (see Table
1) and this is the practice that quantity surveyors in Nigeria
rely on when measuring or taking-off electrical works. For short pre-tender durations or when there is limited time to
submit tenders, this often poses difficulty in quantifying and pricing or estimating the length of cables needed because it cannot be readily obtained except with vast experience in electrical measurement. Quantities of cables in buildings vary from project to project considering the nature, type or use of the building, hence, the need for models to quantify
for the cable for pricing in different scenarios. To make
matters worse, there are no currently easy-to-measure techniques for electrical components in existence especially in Nigeria’s quantity surveying practice.
It is against this backdrop that this study sets out to develop models that can be used to quantify the length of lighting and power cables where the number of lighting points and socket outlets are known. It is pertinent to note that the models developed in this study are very useful, especially in its time saving potential, simplicity and ability to be handled with a calculator or a simple computer program. It is beneficial in estimating the cost of cables at early stages of a residential building construction since the information needed could be gotten at the sketch design stage.
Table 1: Page extract of measurement of electrical final circuits from the BESMM4
II. AIM AND OBJECTIVES OF THE STUDY
The aim of the study is to develop models for predicting cable quantities of residential buildings. This aim will be achieved via the following objectives
1. To determine the relationship between the number
of lighting points and length of lighting cables.
2. To determine the relationship between the number
of socket outlets and length of power cables.
3. To develop predictive models for estimating the
quantity(lengths) of lighting and power cables based on number of lighting points and socket outlets respectively
III. METHODOLOGY
The methodology (comprising data collection sources/ instruments, methods of analysis and analysis software) adopted in addressing the objectives of this study is summarised as shown in Table 2. However, data was analysed using Pearson correlation and regression analysis which is briefly described as follows:
A. Pearson Correlation and Regression Analysis
587
Dr. Ogunsina Olusola
1, ETJ Volume 04 Issue 05 May 2019
analysis was used to investigate the relationship between the number of lighting points/socket outlets and the lengths of lighting/power cables obtained from measurement. The formula for Pearson correlation coefficient is expressed as:
R = Nσ x y – Σ x Σ y (1)
(1) [(Nσ x 2-( Σ x2) (Nσ y2- (Σ y)2)]
When y<+ 0.5, a weak positive relationship exists When y ≥ + 0.5, a strong positive relationship exists When y< - 0.5, a strong negative relationship exists When y ≤ - 0.5, a weak negative relationship exists When y = + 1, a perfect positive relationship exists When y = - 1, a perfect negative relationship exists When y = 0, no relationship exists.
Regression analysis on the other hand is used to predict one variable based on another variable. It may also be said to be
a technique that will find a formula or mathematical model which best describes some set of data collected. The factor whose value we wish to estimate is referred to as dependent variable and denoted by Y. the factor from which these estimates is made is called the independent variable and is denoted by X.
Therefore the relationship between the dependent and independent variables could be expressed with the generic linear regression model as shown in equation 2
Y = a + b x (2)
Where: Y is the dependent variables or quantity being predicted.
X = the independent variables
a = the value of Y when = 0, i.e. the interceptor of the line with Y – axis
b = the slope or gradient. It estimates the rate of change in Y for a unit change in X. It is positive for direct and negative for inverse relationships.
Table 2: Summary of methodology of the Study
S/N Objective Research method
Data source/collection instrument Data analysis method
Data analysis soft ware
1 To determine the
relationship between the number of lighting points and length lighting cables.
Quantity take-off(measurement)of
thirty architectural and electrical drawings validated by an experienced QS and electrical engineer
Correlation analysis
SPSS (Statistical
Packages for the Social Sciences) version 22
2 To determine the
relationship between the number of socket outlets and length of power cables.
Quantity take-off(measurement)of
thirty architectural and electrical drawings validated by an experienced QS and electrical engineer
Correlation analysis
SPSS version 22
3 To develop predictive
models for estimating the quantities(length) of lighting and power cables
Quantity take off (measurement)of thirty architectural and electrical drawings validated by an experienced QS and electrical engineer
Regression analysis
SPSS version 22
IV. DATA PRESENTATION AND RESULTS
Data for lighting points obtained from the taking-off/
measurement of the surveyed electrical drawings are shown in Table 3.
Table 3: Measured quantities of selected electrical items for lighting points in surveyed residential buildings
Project ID Floor ID Cable size Number of lighting points Cable quantity(m)
1 gf &ff 2x1.5mm2 33 780
2 gf &ff 2x1.5mm2 35 789
3 gf &ff 2x1.5mm2 60 1413
4 gf 2x1.5mm2 22 624
5 gf&ff 2x1.5mm2 46 976
6 gf&ff 2x1.5mm2 48 985
7 gf&ff 2x1.5mm2 50 988
8 gf &ff 2x1.5mm2 40 890
9 gf &ff 2x1.5mm2 49 987
588
Dr. Ogunsina Olusola
1, ETJ Volume 04 Issue 05 May 2019
11 gf&ff 2x1.5mm2 37 879
12 gf &ff 2x1.5mm2 49 980
13 gf&ff 2x1.5mm2 32 788
14 gf&ff 2x1.5mm2 34 930
15 gf&ff 2x1.5mm2 15 560
16 gf&ff 2x1.5mm2 21 742
17 gf &ff 2x1.5mm2 48 986
18 gf &ff 2x1.5mm2 41 897
19 gf&ff 2x1.5mm2 30 770
20 gf 2x1.5mm2 22 674
21 gf &ff 2x1.5mm2 30 940
22 gf&ff 2x1.5mm2 25 650
23 gf&ff 2x1.5mm2 37 890
24 gf 2x1.5mm2 20 620
25 gf&ff 2x1.5mm2 32 870
26 gf&ff 2x1.5mm2 28 691
27 gf &ff 2x1.5mm2 55 990
28 gf &ff 2x1.5mm2 35 800
29 gf&ff 2x1.5mm2 36 790
30 gf&ff 2x1.5mm2 17 600
gf = ground floor; ff= first floor
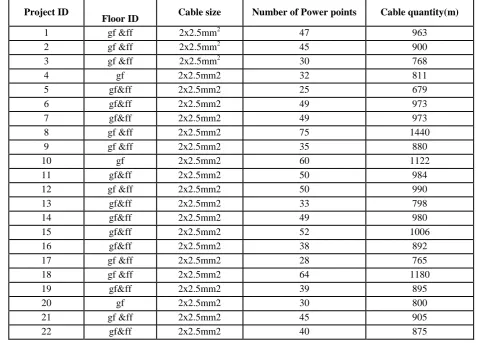
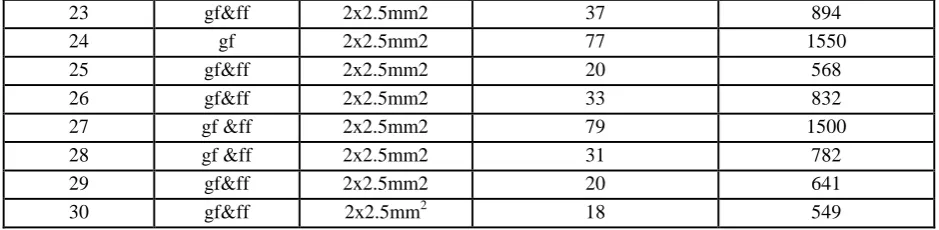
Furthermore, data for power points obtained from the measurement of the selected electrical drawings are shown in Table 4.
Table 4: Measured quantities of selected electrical items for power points in surveyed residential buildings
Project ID
Floor ID Cable size Number of Power points Cable quantity(m)
1 gf &ff 2x2.5mm2 47 963
2 gf &ff 2x2.5mm2 45 900
3 gf &ff 2x2.5mm2 30 768
4 gf 2x2.5mm2 32 811
5 gf&ff 2x2.5mm2 25 679
6 gf&ff 2x2.5mm2 49 973
7 gf&ff 2x2.5mm2 49 973
8 gf &ff 2x2.5mm2 75 1440
9 gf &ff 2x2.5mm2 35 880
10 gf 2x2.5mm2 60 1122
11 gf&ff 2x2.5mm2 50 984
12 gf &ff 2x2.5mm2 50 990
13 gf&ff 2x2.5mm2 33 798
14 gf&ff 2x2.5mm2 49 980
15 gf&ff 2x2.5mm2 52 1006
16 gf&ff 2x2.5mm2 38 892
17 gf &ff 2x2.5mm2 28 765
18 gf &ff 2x2.5mm2 64 1180
19 gf&ff 2x2.5mm2 39 895
20 gf 2x2.5mm2 30 800
21 gf &ff 2x2.5mm2 45 905
589
Dr. Ogunsina Olusola
1, ETJ Volume 04 Issue 05 May 2019
23 gf&ff 2x2.5mm2 37 894
24 gf 2x2.5mm2 77 1550
25 gf&ff 2x2.5mm2 20 568
26 gf&ff 2x2.5mm2 33 832
27 gf &ff 2x2.5mm2 79 1500
28 gf &ff 2x2.5mm2 31 782
29 gf&ff 2x2.5mm2 20 641
30 gf&ff 2x2.5mm2 18 549
A. Power Points
Table 5: Descriptive statistics of power points and power cables
N Minimum Maximum Mean Std. Deviation
Std. Error Statistic
Power Points 30 18.00 79.00 42.6667 2.97473 16.29329
Power Cable 30 549.00 1550.0 929.83 43.6225 238.930
Table 6: Table of coefficients of the model for power points and power cables
Model
Unstandardized Coefficients
Standardized Coefficients
t Sig. B Std. Error Beta
(Constant) 317.237 25.693 12.347 .000
Power Points 14.358 .564 .979 25.468 .000
From Table6, the model showing the relationship between the power cable quantity and corresponding number of power points is thus generated as follows:
outlets)
socket
of
(number
qty
cable
Power
(3)Where
and
are constants that are gotten from theTable of coefficients.
Model (1) can thus be fitted as:
Power cable quantity = 317.237 + 14.358 SOqty (4)
Where: SOqty= number of socket outlets
Table 7: Model summary
Model R R Square Adjusted R Square Std. Error of the Estimate
1 .979 .959 .957 49.46511
Table 7shows that the coefficient of correlation R = 0.979and the coefficient of Determination (R Square) = 95.9%. These imply a very high relationship between number of socket outlets and length of power cables and that
only 4.1% (1-0.959) of change in the number of socket outlets is not explained by change in length of power cables. Thus, the predicted equation 7 can be considered statistically significant.
Table 8: ANOVA result of model adequacy of power points
Model Sum of Squares df Mean Square F Sig.
Regression 1587035.839 1 1587035.839 648.618 .000
Residual 68510.327 28 2446.797
Total 1655546.167 29
The ANOVA Table above was used to test the model adequacy, and a significant value 0.000 shows that the
590
Dr. Ogunsina Olusola
1, ETJ Volume 04 Issue 05 May 2019
B. Lighting PointsTable 9: Descriptive statistics of lighting points and lighting cables quantities
N Minimum Maximum Mean Std. Deviation
Std. Error
Lighting points 30 15.00 60.00 35.1333 2.12794 11.65520
Lightning cable 30 560.00 1413.00 838.800 31.6582 173.3993
Table 10: Coefficients of the model of lighting points and lighting cables quantities
Model
Unstandardized Coefficients Standardized
Coefficients t Sig.
B Std. Error Beta
(Constant) 363.867 43.390 8.386 .000
Lighting
points 13.518 1.174 .909 11.513 .000
From Table 10, the model showing the relationship between lighting cable quantity and corresponding number of lighting points is expressed as follows:
points) lighting of (no. qty
cable
Lighting (5)
Where
and
are constants that are gotten from theTable of coefficients. Model (2) can be fitted as:
Lighting cable quantity = 363.867 + 13.518 LPqty (6)
Where: LPqty= number of lighting points
Table 11: Coefficients of the model for lighting points and lighting cables quantities
Model R R Square Adjusted R Square Std. Error of the Estimate
2 .909 .826 .819 73.69501
Table 11 indicates that the coefficient of correlation R = 0.909 and the coefficient of Determination (R Square) = 82.6%. These imply a very high relationship between number of lighting points and length of lighting cables and
that only 17.4% (1-0.826) of change in the number of lighting points is not explained by change in length of lighting cables. Hence, the predicted equation 6 is statistically significant.
Table 12: ANOVA result for model adequacy of lighting points
Model Sum of Squares df Mean Square F Sig.
Regression 719886.080 1 719886.080 132.552 .000b
Residual 152066.720 28 5430.954
Total 871952.800 29
The ANOVA Table (Table 12) above was used to test the model adequacy, and a significant value 0.000 shows that the model is adequate, and can be used to generate a reliable quantity of lighting cables.
V. SUMMARY, CONCLUSION AND RECOMMENDATIONS
This study developed two time saving models for estimating cable quantities in residential buildings construction in Nigeria using a linear regression technique. These models attempts to contribute to existing bodies of knowledge on approximate quantification in the discipline of quantity surveying by proving that strong positive statistical relationships actually exist between lighting points/socket
outlets and length of lighting and power cables. The models
used data from taking-off/measurement of thirty
architectural and electrical drawings, collected from registered architects and electrical engineers.
These models will undoubtedly prove useful to quantity surveyors and other construction cost professionals, especially in its simplicity and ability to handled using the calculator or a simple computer program. It has a good benefit in estimating the cable cost at early stages of the residential building projects since the information needed could be gotten at the sketch design.
591
Dr. Ogunsina Olusola
1, ETJ Volume 04 Issue 05 May 2019
First determine the number of points in each cable
(for lighting and power points)
Then put in the number of lighting points/socket
outlets in the model for lighting points/power points to determine the quantity of cables needed. The accuracy or efficacy of the generated models relies heavily on accurate determination of the number of lighting points and socket outlets. In view of this, the study recommends that quantity surveyors who intend generate reliable approximate quantities, material schedules and beat tight tender deadlines must not only employ the model, they should also exercise care and be judicious in taking off(measurement) of lighting and socket points quantities of light from the relevant drawings.
VI. ACKNOWLEDGMENT
This study was carried out by the authors independently to demonstrate their skills as researchers in Quantity surveying. This study was done on a self-supporting basis.
REFERENCES
1. Ashworth, A.(1988). Cost studies of buildings. U.K:
Longman Scientific and Technical, Harlow, Essex.
2. NIQS.(2010). Public Private Partnership Approach to
Infrastructure Provision in Nigeria. A 3-day
International Workshop held at Shehu Musa Yar’Adua Center, Abuja, 13th – 15th July.
3. NIQS. (2011). Investiture of Fellows and Induction of
New Members, held at Shehu Musa Yar’Adua Center,
Abuja, 6th May.
4. Lee, S., Trench, W. and Willis, A.(2005). Willis
Elements of Quantity Surveying, 10th edn. Oxford: Blackwell.
5. NIQS. (2015). Building and Engineering Standard
Method of Measurement, 4th edn. Abuja: NIQS