Incorporating learning characteristics into
automatic essay scoring models: What
individual differences and linguistic
features tell us about writing quality
Scott A. Crossley
Georgia State University [email protected]Laura K. Allen
Arizona State University [email protected]
Erica L. Snow
SRI International [email protected]Danielle S. McNamara
Arizona State University [email protected]This study investigates a novel approach to automatically assessing essay quality that combines natural language processing approaches that assess text features with approaches that assess individual differ-ences in writers such as demographic information, standardized test scores, and survey results. The results demonstrate that combining text features and individual differences increases the accuracy of au-tomatically assigned essay scores over using either individual differences or text features alone. The findings presented here have important implications for writing educators because they reveal that essay scoring methods can benefit from the incorporation of features taken not only from the essay itself (e.g., features related to lexical and syntactic complexity), but also from the writer (e.g., vocabulary knowledge and writing attitudes). The findings have implications for educational data mining researchers because they demonstrate new natural language processing approaches that afford the automatic assessment of performance outcomes.
Key Words:Automated essay scoring; Natural Language Processing; Individual differences; Intelli-gent tutoring systems; Writing quality
1.
INTRODUCTION
such as video views, forum post reads, and assignment attempts (Baker & Siemens, 2014). Additional approaches to assessing student performance include the use of individual difference measures such as demographics, content knowledge, and literacy skills (DeBoer, Ho, Stump, & Breslow, 2014).
More recently, EDM researchers have begun to use text analysis tools to provide more spe-cific information about the characteristics of students’ learning processes. For instance, Ezen-Can and Boyer (2015) used part of speech tagging along with raw word counts to automatically model dialog acts for student utterances in an online tutor. In a similar study, Samei, Rus, Nye, and Morrison (2015) classified dialog acts using token types and length of utterances. Text analysis tools have also been used to investigate success in MOOCs. For instance, Crossley and colleagues (2015) calculated natural language processing (NLP) indices for students’ forum posts to predict their MOOC success. They found that a number of linguistic features related to text quality, cohesion, sentiment, and the lexicon successfully predicted course completion. Similarly, Wen, Yang, and Rose (2014a, 2014b) used text analysis tools to examine the sentiment of MOOC forum posts and its relationship to students’ opinions toward the course and course tools. Wen and colleagues reported that students that used more motivation words and personal pronouns had a lower risk of dropping out of the course. Finally, one of the most common uses of text analysis tools is for the automated scoring of student writing samples in MOOCs (Jing, 2015; Liu et al., 2016) and ITSs (Crossley, Roscoe, & McNamara, 2013).
In the current study, our focus is on the automatic assessment of writing samples in an online ITS using both individual difference measures and text analysis tools. The automatic assessment of writing quality has been an important component of standardized testing (e.g., the Graduate Record Exam; GRE, and the Test of English as a Foreign Language; TOEFL) and feedback de-livery in computer-based writing instruction such as the Writing-Pal (W-Pal; McNamara, Raine et al., 2013; Roscoe, Allen, Weston, Crossley, & McNamara, 2014). Traditionally, automated essay scoring (AES) systems have focused on calculating text features of a particular essay to assess its quality. These features generally include linguistic elements related to word frequency, syntactic complexity, and cohesion along with discourse features related to text structure, theses, and topic sentences. AES systems have been quite successful at scoring essays, demonstrating strong correlations with human scores of essay quality. However, exact matches between raters and automatic scores have remained relatively low (between 30-60%).
One potential avenue for increasing the accuracy of AES systems is to consider the role of individual differences (e.g., demographic information, standardized text scores, and survey results) in statistical models of essay quality. While relatively common in EDM approaches, the use of individual differences as predictors in assessments of essay quality is rare and, to date, we have found no evidence of their inclusion in essay scoring models. Measuring individual differences in writer’s abilities (i.e., literacy skills, cognitive abilities, and affective states) has the potential to increase the sensitivity of AES algorithms by providing a means to go beyond the written word. If the inclusion of such predictors explains elements of essay quality beyond a text’s linguistic features, such an approach may help to alleviate concerns that typical AES scoring models fail to fully measure the writing construct (Deane, 2013).
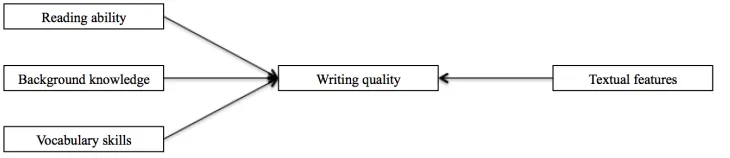
Figure 1: Overview of writing quality assessment incorporating individual differences and lin-guistic features.
& McNamara, 2014; Graham, 2006; Scardamalia & Bereiter, 1987). These studies demonstrate that the production of higher quality essays is often associated with strong reading skills (Allen, Snow, Crossley et al., 2014; Fitzgerald & Shanahan, 2000; Tierney & Shanahan, 1991), vocab-ulary knowledge (Allen & McNamara, 2014; Allen, Snow, Crossley et al., 2014; Stæhr, 2008), flexibility (Allen, Snow, & McNamara, 2014; 2016), and writing-specific knowledge (Saddler & Graham, 2007). On the other hand, AES developers have tended to focus on how text fea-tures relate to essay quality (Applebee, Langer, Jenkins, Mullis, & Foertsch, 1990; Crossley, Roscoe, McNamara, & Graesser, 2011; Ferrari, Bouffard, & Rainville, 1998; McNamara et al., 2010; Varner, Roscoe, & McNamara, 2013; Witte & Faigley, 1981). These studies have found that writers who produce more complex linguistic features are more likely to compose higher quality essays. Such studies have not focused on writers’ prior skills or abilities; albeit because individual difference measures are either not available or are rarely collected in the context of AES systems. Theoretically, however, one would assume that individual differences in abilities such as reading skill, vocabulary, and domain knowledge will contribute to writing quality be-cause a constellation of skills are brought to bear when a student composes an essay (Graham, 2006). At the same time, essay features are assumed to serve as proxies both to the quality of the essay (McNamara, Crossley, & Roscoe, 2013) and to individual differences (Crossley, Allen, & McNamara, 2014).
One potential problem with relying solely on linguistic features is that successful writing is likely not the product of specific linguistic features, but a combination of various features. That is to say, writers have a number of different approaches to combining linguistic features in order to produce a successful essay. For instance, writers may take a purely academic approach to writing and use a greater number of linguistic features related to nominalizations, syntactic complexity, and lexical sophistication. On the other hand, writers may make their writing more accessible by producing more cohesive essays that contain greater lexical and semantic over-lap between text segments, more causal verbs and particles, and more connectives (Crossley, Roscoe, & McNamara, 2014). Both approaches can lead to essays that are scored as higher quality, calling into question the idea that a single combination of specific linguistic features can reliably assess essay quality for all writers. However, it may be the case that individual differences found among writers may help to account for differences in the production of lin-guistic features and how these features lead to assessments of writing quality. Thus, in this study, we assume that individual differences in writers can provide information that goes beyond text features about how human judgments of essay quality are derived (as illustrated in Figure 1).
auto-mated feedback. Our overarching objective in this study is to enhance the accuracy of feedback within W-Pal. For this study, we use natural language processing tools to calculate linguistic and rhetorical features of essays composed by students interacting with W-Pal. We also col-lected individual difference measures from these students (i.e., demographic information, prior knowledge, literacy skills). The linguistic features and/or the individual differences for the writ-ers were then included in a series of regression analyses to examine the extent to which they predicted essay quality (as scored by trained, expert raters). Our goal is to investigate the po-tential to use individual differences to predict essay quality and to examine the extent to which a combination of text features and individual differences increases accuracy in these scoring models. Such findings may afford additional avenues to automatically assess essay quality and provide new data mining approaches that can be used in tutoring systems, standardized writ-ing assessments, and massive open on-line courses (MOOCs) to more accurately model writwrit-ing proficiency.
1.1. THEWRITING PAL
W-Pal is an intelligent tutoring system designed to provide writing strategy instruction to high school and entering college students (McNamara et al., 2013; Roscoe et al., 2014). Unlike AES systems, which focus on essay practice and sometimes provide support and instruction in the form of feedback (traditionally referred to as automatic writing evaluation, AWE, systems), W-Pal emphasizes strategy instruction first, followed by targeted strategy practice and then whole-essay practice.
1.2. TEXTFEATURES AND AUTOMATIC WRITING EVALUATIONSYSTEMS
The traditional approach to automatically assessing writing quality has been through the use of text features. Such features are calculated using computational applications such as part-of-speech taggers and syntactic parsers. Such applications are often aggregated into tools that can measure a number of linguistic features automatically. Common tools used in the past to ex-amine essay quality include the Biber tagger (Biber, 1988, 1995), STYLEFILES (Reid, 1992), Coh-Metrix (McNamara, Graesser, McCarthy, & Cai, 2104), and the Writing Assessment Tool (WAT; Crossley, Roscoe, & McNamara, 2013; McNamara et al., 2013). For instance, the Biber Tagger can automatically calculate features related to lexical sophistication (e.g., type/token ra-tio and word length), cohesion and rhetorical features (e.g. conjuncts, hedges, amplifiers, and emphatics), grammatical features (e.g. nouns, verbs, nominalizations, and modals), and clause-level features (e.g. subordinations, complementation, and passives). Coh-Metrix calculates a number of text-based linguistic features related to lexical sophistication (word frequency, word concreteness, word familiarity, polysemy, hypernymy), syntactic complexity (incidence of in-finitives, phrase length, number of words before the main verb), and cohesion (word overlap, se-mantic similarity, incidence of connectives). WAT, in addition to reporting the above-mentioned Coh-Metrix and Biber Tagger features, measures n-gram frequency, rhetorical features, as well as additional measures of global cohesion and lexical and syntactic complexity.
Text features such as those discussed above can be used to develop AES and AWE systems. These systems use a number of linguistic features to automatically score a student’s essay. The systems are important because they can provide opportunities for students to practice writing and receive automatic feedback on the quality of the writing. AES systems can also be used in standardized testing situations such as the TOEFL or the GRE (Dikli, 2006). In standardized tests such as these, AES systems reduce the demands and complications often associated with human writing assessment, such as time, cost, and reliability (Bereiter, 2003).
AWE systems that provide opportunities for students to write and receive feedback (e.g.,
CRITERION (Attali & Burstein, 2006; Burstein et al., 2004) and MYACCESS (Grimes &
However, unlike traditional scoring methods that rely on linear multiple regression models be-tween text features and scores, the AWE in W-Pal uses hierarchical classification (McNamara, Crossley, Roscoe, Allen, & Dai, 2015). This hierarchical modeling provides opportunities to give users summative and formative feedback at different conceptual levels on a variety of lin-guistic and rhetorical features (Crossley, Roscoe, & McNamara, 2013). For instance, for shorter essays, differences in scoring are related to the use of more sophisticated nominals and grammar (e.g., nominalizations, plural nouns, sentence relative clauses, commas), higher cohesion (lexi-cal diversity, paragraph-to-paragraph) and the absence of specific topics such as social processes and religion. For longer essays, scores are based on some similar indices such as nominaliza-tions and sentence relative clauses, but the algorithm also includes indices more reflective of the semantic content of the essay (e.g., lower bigram frequency, more frequent use of amplifiers and adjectives) and the use of more sophisticated verbs (i.e., less frequent use of public verbs, private verbs, verbs in base form, and auxiliary verbs).
In general, the aforementioned AES and AWE systems are able to provide accurate and re-liable holistic essay scores. These scores show correlations with human judgments of essay quality that range between .60 and .85. The scores from AES and AWE systems also report perfect agreement (i.e., exact matches between a human score and a score provided by the scor-ing system) from 30-60% and adjacent agreement (i.e., scores reported by the scorscor-ing system that are 1 point above or below the score provided by the human rater) from 85-99% (Attali & Burstein, 2006; McNamara, Crossley, & Roscoe, 2013; Rudner et al., 2006; Warschauer & Ware, 2006).
Although AES systems show strong correlations and accuracy, some critics argue that the systems are impersonal, lack human sensitivity, and cannot respond to elements of writing qual-ity that fall outside of the available algorithms (Hearst, 2002). Specifically, educators and re-searchers are concerned that AES and AWE systems cannot address issues of argumentation and rhetorical effectiveness, both hallmarks of quality writing (Deane, 2013; Haswell, 2006; Perel-man, 2012). In addition, accurate scoring on the part of AES and AWE systems does not appear to strongly relate to instructional efficacy, with studies suggesting that students who use AES systems improve in writing mechanics but not overall essay quality (Attali & Burstein, 2006). Finally, while AWE systems can facilitate writing practice and improve motivation, some AWE users are skeptical about their scoring reliability and researchers worry about the potential for AWE systems to overlook infrequent writing problems that, while rare, may be frequent to an individual writer (Grimes & Warschauer, 2010). In fact, the Conference on College Composi-tion and CommunicaComposi-tions, the largest writing conference in North America, published a posiComposi-tion paper that categorically opposed the use of AES systems in writing assessment (College Board, 2011).
1.3. INDIVIDUAL DIFFERENCES AND AUTOMATIC WRITING EVALUATIONSYSTEMS
One approach to improving not only the accuracy of AWE systems but also their underlying va-lidity is the inclusion of student information in scoring algorithms. Because one of the common critiques of AES systems is the failure to measure the full writing construct (Deane, 2013), the addition of individual difference information (e.g., literacy skills, cognitive abilities, affective states, etc.) to algorithms may increase the sensitivity of the algorithms to the more general context of the writing assignment. This contextualization of writing assessment is important, particularly if systems aim to provide adaptive instruction and formative feedback to students on an individual basis.
Recently, this potential link between individual differences among students and automated text features has begun to be empirically explored (Allen & McNamara, 2015; Attali & Powers, 2008; Roscoe, Crossley, Snow, Varner, & McNamara, 2014). Roscoe et al. (2014), for instance, examined whether the essay scores from an AWE system correlated with individual differences in students’ literacy skills and prior knowledge (e.g., Gates-MacGinitie Reading and Vocabulary tests, prior world knowledge, etc.). Results from this study indicated that the computational algorithms were significantly related to a number of the individual differences among students, though human raters were more sensitive to the literacy and knowledge-based measures. Attali and Powers (2008) also examined relationships between automatically scored essays and indi-vidual differences (grade level, gender, race, first language, and years of schooling in English). They found essay scores increased as grade level increased. Demographically, they reported that females scored higher than males (although there was a small negative interaction with grade level for females) and that White and Asian students scored better than non-White students (al-though there was a negative interaction with grade level for Asian students). In addition, they reported no difference between native and non-native speakers of English on essay scoring, but they did report gains in essay scores for the number of years of English schooling.
Similarly, Allen et al. (2015) investigated relations between students’ vocabulary knowledge and the lexical characteristics of their writing. Results suggested that the word-level properties of students’ essays were significantly predictive of students’ vocabulary knowledge, and that this model generalized to a separate set of students’ essays. Overall, the analysis confirmed that automated text analysis tools successfully detected and provided important information about the role of individual differences in students’ writing processes.
1.4. CURRENT STUDY
2.
METHOD
2.1. PARTICIPANTS
For this study, we recruited 86 students from public high schools in the metro Phoenix area. Students’ average age was 15.6 years, with an average grade level of 10.4. Of the 86 participants, 62.1% were female and 37.9% were male. Thirty-eight of the participants self-identified as English Language Learners (ELLs). The remaining participants self-identified as native speakers of English (NS).
2.2. PROCEDURES
Students attended 10 sessions (1 session/day) over a 2-4 week period. Participants wrote a pretest essay during the first session and a posttest essay during the last session. In addition, the first and final sessions included assessments of reading comprehension, vocabulary, writing proficiency, strategy knowledge, and writing attitudes (discussed below). For this study, we used only the pretest essays and individual difference measures collected from the students (N = 86).
2.3. ESSAY SCORING
Each essay in the corpus was scored independently by two expert raters using a 6-point rating scale developed for the SAT (see Appendix 1 for scoring rubric). The ratings were anonymous in that the raters had no access to information pertaining to the students’ individual differences. The rating scale was used to holistically assess the quality of the essays and had a minimum score of 1 and a maximum score of 6. Raters were first trained to use the rubric with a small sample of argumentative essays that were not part of the corpus analyzed in this study. A Pearson correlation analysis was used to assess inter-rater reliability between raters. When the raters reached a correlation of r = .70, the ratings were considered reliable and the raters scored the essays in the corpus. The final inter-rater reliability across all raters for all the essays used in the analysis wasr>.70. Average scores between the raters were calculated for each essay.
2.3.1. Individual differences
Demographic information. Students’ demographic information was collected at pretest. The demographic survey asked students to report basic information, such as their age, gender, grade point average, first language status, as well as their perceptions towards reading and writing. Additionally, the demographic survey assessed students’ performance orientation, as well as their comfort and excitement towards using computers.
Reading comprehension. Students’ reading comprehension ability was assessed through the Gates-MacGinitie (4thed.) reading skill test (form S) level 10/12 (MacGinitie & MacGinitie, 1989). The test consisted of 48 multiple-choice questions that measured students’ ability to comprehend both shallow and deep level information across 11 short passages. In the current study, students’ comprehension scores on this test ranged from 10 to 45 (M=24.59, SD=8.91).
is most closely related to the underlined word. In the vocabulary portion of this experiment, students’ scores ranged from 6 to 45 (M=26.63,SD=8.89).
Writing apprehension. Students’ apprehension toward writing was measured with the Daly-Miller Writing Apprehension Test (WAT; Daly & Miller, 1975). The Daly-Miller WAT assesses an individual’s level of apprehension toward writing. This assessment includes items related to evaluation apprehension (fear of evaluation), stress apprehension (general fear of writ-ing manifestwrit-ing early in the writwrit-ing process), and product apprehension (fear of writwrit-ing mani-festing as a general disdain for writing).
Prior knowledge. Prior knowledge was measured with a 30-question assessment that was designed for high school students. It has been previously used in research related to strategy training and reading comprehension (O’Reilly, Best, & McNamara, 2004; O’Reilly & McNa-mara, 2007). This measure assesses knowledge in the domains of science, literature, and history.
WASSI.The Writing Attitudes and Strategies Self-Report Inventory (WASSI) is a self-report measure that was administered to test students’ writing attitudes and strategy use. Students respond to statements about themselves by indicating their level of agreement on a 6-point scale ranging from strongly disagree to strongly agree. The WASSI comprises four different subscales (prewriting, drafting, attitudes, and self-efficacy) each targeting a different aspect important to writing performance.
2.4. TEXTFEATURES
Linguistic features from the text were computed using Coh-Metrix and the Writing Assessment Tool (WAT). These features are discussed briefly below. More detailed descriptions for the tools and the features on which they report can be found in (Crossley, Roscoe, & McNamara, 2014; McNamara et al., 2013; McNamara et al., 2014).
Coh-Metrix. Coh-Metrix represents the state of the art in computational tools and is able to measure text difficulty, text structure, and cohesion through the integration of lexicons, pattern classifiers, part-of-speech taggers, syntactic parsers, shallow semantic interpreters, and other components that have been developed in the field of computational linguistics. Coh-Metrix re-ports on linguistic variables that are primarily related to text difficulty. These variables include indices of causality, cohesion (semantic and lexical overlap, lexical diversity, along with inci-dence of connectives), part of speech and phrase tags (e.g., nouns, verbs, adjectives), basic text measures (e.g., text, sentence, paragraph length), lexical sophistication (e.g., word frequency, familiarity, imageability, familiarity, hypernmy, concreteness), and syntactic complexity (e.g., words before the main verb, noun phrase length, and incidence of infinitives). These Coh-Metrix indices have been used successfully in a number of studies that focus on predicting essay quality (Crossley et al., 2014; McNamara, Crossley et al., 2013; McNamara et al., 2014). For additional information about the types of indices calculated by Coh-Metrix and how the calculations are made, we refer the reader to (McNamara et al., 2014).
such as hedges, conjuncts, amplifiers, and conclusion statements. The features reported by WAT have been used in a number of studies that have successfully investigated links between essay quality and text features (Crossley et al., 2013; 2014; McNamara, Crossley, et al., 2013). For additional information about the types of indices calculated by WAT and how the calculations are made, we refer the reader to (McNamara, Crossley, et al., 2013).
2.5. STATISTICALANALYSES
Prior to analysis, training and test sets were created from the corpus. The training sets were comprised of approximately 67% of the essays while the test sets were comprised of approx-imately 33% of the essays. Correlational analyses using the training data were conducted to examine the strength of relations between the selected indices and the human essay scores for those indices that were normally distributed. If an index demonstrated a significant correlation, it was considered for the analysis. Multicollinearity was then assessed between the indices (r
>.90). When two or more indices demonstrated multicollinearity, we retained the index that correlated more strongly with the essay scores. Three stepwise regression analyses were then calculated to address our research questions (i.e.,Can text features, individual differences, and both text features and individual differences predict essay quality?). Exact and adjacent accu-racy are reported for the scores calculated by the resulting regression models. Exact matches demonstrate perfect agreement between human and regression scores while adjacent agreement occur when human and automated scores are within one point of each other.
3.
RESULTS
3.1. CORRELATIONS ANDNORMALITY CHECKS
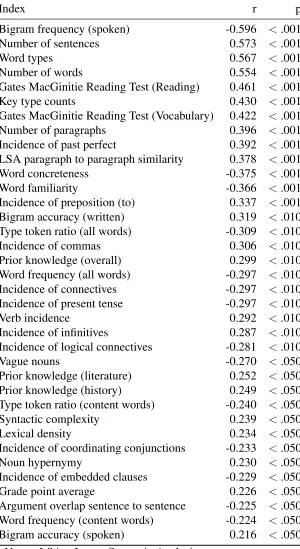
Of the 292 selected features, 72 of the features demonstrated significant correlations with the essay scores. Of these 72 variables, 11 of the variables demonstrated multicollinearity with other variables that correlated more strongly with the essay quality scores. These 11 variables were removed. Of the remaining 61 variables, 25 of the variables were not normally distributed and were removed. This trimming of the variables left us with 36 features with which to predict essay quality. Of these 36 variables, 30 were text features and 6 were individual differences including 2 standardized test scores and 5 variables from survey answers (see Table 1 for correlations).
3.2. MULTIPLEREGRESSION: INDIVIDUAL DIFFERENCES
3.2.1. Regression Analysis Training Set.
The linear regression using the selected variables yielded a significant model,F(1, 50) = 12.868,
p<.001,r= .451,r2= .203. One variable was a significant predictor in the regression:
Gates-MacGinitie reading test scores (GMRT). The remaining variables were not significant predictors and were not included in the model. The regression model is presented in Table 2. The results from the linear regression demonstrate that the one variable accounts for 20% of the variance in the human judgments of writing quality.
3.2.2. Regression Analysis Test Set.
con-Table 1: Correlations between NLP indices and essay scores
Index r p
Bigram frequency (spoken) -0.596 <.001 Number of sentences 0.573 <.001
Word types 0.567 <.001
Number of words 0.554 <.001
Gates MacGinitie Reading Test (Reading) 0.461 <.001
Key type counts 0.430 <.001
Gates MacGinitie Reading Test (Vocabulary) 0.422 <.001 Number of paragraphs 0.396 <.001 Incidence of past perfect 0.392 <.001 LSA paragraph to paragraph similarity 0.378 <.001 Word concreteness -0.375 <.001 Word familiarity -0.366 <.001 Incidence of preposition (to) 0.337 <.001 Bigram accuracy (written) 0.319 <.010 Type token ratio (all words) -0.309 <.010 Incidence of commas 0.306 <.010 Prior knowledge (overall) 0.299 <.010 Word frequency (all words) -0.297 <.010 Incidence of connectives -0.297 <.010 Incidence of present tense -0.297 <.010
Verb incidence 0.292 <.010
Incidence of infinitives 0.287 <.010 Incidence of logical connectives -0.281 <.010
Vague nouns -0.270 <.050
Prior knowledge (literature) 0.252 <.050 Prior knowledge (history) 0.249 <.050 Type token ratio (content words) -0.240 <.050 Syntactic complexity 0.239 <.050
Lexical density 0.234 <.050
Incidence of coordinating conjunctions -0.233 <.050
Noun hypernymy 0.230 <.050
Incidence of embedded clauses -0.229 <.050 Grade point average 0.226 <.050 Argument overlap sentence to sentence -0.225 <.050 Word frequency (content words) -0.224 <.050 Bigram accuracy (spoken) 0.216 <.050
Table 2:
Entry Variable Added/Removed r R2 B SE B
Entry 1 Gates MacGinitie Reading Test (Reading) 0.451 0.203 0.029 0.008 0.451
Notes: Estimated Constant Term is 2.074;Bis unstandardized Beta; SE is standard error; B is standardized Beta
Table 3: Linear regression results for text features only
Entry Variable Added/Removed r R2 B SE B
Entry 1 Frequency spoken bigrams 0.613 0.376 -88.606 12.614 -0.607 Entry 2 Word concreteness 0.709 0.502 -0.006 0.002 -0.299 Entry 3 Incidence of coordinating conjunctions 0.743 0.552 -0.011 0.004 -0.230 Notes: Estimated Constant Term is 6.683;Bis unstandardized Beta; SE is standard error; B is standardized Beta
data set. The model produced an estimated value for each essay in the test set. A Pearson corre-lation was then conducted between the estimated scores and the actual scores. This correcorre-lation along with itsr2was then used to demonstrate the strength of the model on an independent data set. The model for the test set yieldedr = .469,r2 = .220. The results from the test set model demonstrate that the one variable accounted for 22% of the variance in the evaluation of the essays comprising the test set.
3.2.3. Exact and Adjacent Matches.
The regression model produced exact matches between the predicted essay scores and the human scores for 48 of the 86 essays (56% exact accuracy). The model produced adjacent matches for 85 of the 86 essays (99% adjacent accuracy).
3.3. MULTIPLEREGRESSION: TEXT FEATURES
Regression Analysis Training Set.The linear regression using the selected variables yielded a significant model, F(3, 64) = 25.005,p< .001,r = .743, r2 = .552. Three variables were
sig-nificant predictors in the regression: frequency of spoken bi-grams, word concreteness, and the incidence of coordinating conjunctions. The remaining variables were not significant predictors and were not included in the model. The regression model is presented in Table 3. The results from the linear regression demonstrate that the combination of the three variables accounted for 55% of the variance in the human judgments of writing quality.
Regression Analysis Test Set. The model for the test set yieldedr = .674, r2 = .454. The
results from the test set model demonstrate that the combination of the three variables accounted for 45% of the variance in the evaluation of the essays comprising the test set.
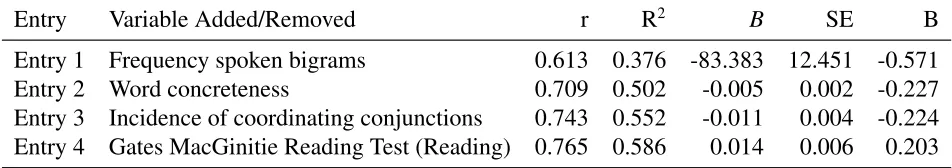
Table 4: Linear regression results for individual differences and text features
Entry Variable Added/Removed r R2 B SE B
Entry 1 Frequency spoken bigrams 0.613 0.376 -83.383 12.451 -0.571 Entry 2 Word concreteness 0.709 0.502 -0.005 0.002 -0.227 Entry 3 Incidence of coordinating conjunctions 0.743 0.552 -0.011 0.004 -0.224 Entry 4 Gates MacGinitie Reading Test (Reading) 0.765 0.586 0.014 0.006 0.203 Notes: Estimated Constant Term is 5.701;Bis unstandardized Beta; SE is standard error; B is standardized Beta
Table 5: Fisher r-z transformation results between models
Comparison z p
Individual differences<Text features 3.04 < .050 Individual differences<Combined 3.36 < .010 Combined = Text features 0.33 > .050
3.4. MULTIPLEREGRESSION: COMBINED FEATURES
Regression Analysis Training Set. The linear regression using the selected variables yielded a significant model, F(4, 64) = 21.195, p < .001, r = .765, r2 = .586. Four variables were significant predictors in the regression: frequency of spoken bi-grams, word concreteness, the incidence of coordinating conjunctions, and Gates-MacGinitie reading test scores (GMRT). The remaining variables were not significant predictors and were not included in the model. The regression model is presented in Table 4. The results from the linear regression demonstrate that the combination of the 4 variables accounts for 59% of the variance in the human judgments of writing quality.
Regression Analysis Test Set. The model for the test set yieldedr = .723, r2 = .523. The
results from the test set model demonstrate that the combination of the four variables accounted for 52% of the variance in the evaluation of the essays comprising the test set.
Exact and Adjacent Matches. The regression model produced exact matches between the predicted essay scores and the human scores for 58 of the 85 essays (68% exact accuracy). The model produced adjacent matches for 85 of the 86 essays (99% adjacent accuracy).
3.5. COMPARISONS BETWEENREGRESSION MODELS
4.
DISCUSSION
We have investigated the potential for individual differences alone, and in combination with text features, to predict essay quality in a small sample of persuasive essays. The findings demonstrate that individual differences can be used to predict the quality of essays written in the W-Pal system, but not as strongly as text features or a combination of text features and individual differences. This study is representative of a burgeoning area of EDM research – namely, the use of NLP tools in text analysis. More importantly, this study provides a proof of concept for the combination of NLP variables with more traditional variables commonly used in EDM research (i.e., individual differences). In addition, it provides evidence that these tools can be used in the context of a specific domain that is of interest to many educational researchers -- student writing. Specifically, we compared individual differences, text features, and the combination of the two in predicting writing quality in a (relatively) small sample of persuasive essays. The findings demonstrate that individual differences can be used to predict essay quality, but not as strongly as text features or a combination of text features and individual differences. The combination of individual differences with text features marginally increased the amount of variance explained in the regression model (i.e., test set r2 = .52 vs. r2 = .45) and the exact and adjacent matches in essays scored using the model. While these gains are relatively small, they are nevertheless important because increases in the accuracy of scoring models promotes increased confidence in feedback provided to students and in the confidence of the system in general. In turn, such improvements have the potential to increase learning gains (Grimes & Warschauer, 2010). In ad-dition to increasing theaccuracyof the score, the inclusion of individual differences in scoring models opens up new avenues for improving the personalization of the scoring models. Specifi-cally, the use of personalized data could allow tutoring and AES/AWE systems to provide more effective feedback to students. By incorporating student information into essay scoring mod-els, the formative feedback in these writing systems could focus on the needs of the individual students rather than on individual essays. Additionally, the use of this student data may allow automated writing systems to adapt lessons to users based on their writing performance and individual characteristics.
The individual difference model explained 20% to 22% of the variance in the human scores (in both the training and test models). The correlations reported for this model are lower than reported for a number of AES systems that rely on text features alone (usually around .60 to .85; Attali & Burstein, 2006; McNamara, Crossley et al., 2013; Rudner et al., 2006; Warschauer & Ware, 2006) and lower than those reported for the text features model and the combined model. However, the exact and adjacent matches reported for the model were relatively strong and in the expected range with exact matches at 56% and adjacent matches at 99%. The models demonstrate that the strongest individual difference predictor of essay quality is students’ read-ing scores. In this case, positive correlations with essay quality were reported indicatread-ing that students with greater reading skills produced more successful essays, aligning with individual difference studies that show moderate to strong correlations (r .30 to .50) between reading and writing (Tierney & Shanahan, 1991)
The model demonstrated that higher quality writing used less frequent bigrams, less concrete words, and fewer coordinating conjunctions. Thus, higher quality writing can be marked by more sophisticated lexical choices and fewer markers of local cohesion. Similar findings have been reported in previous studies (Crossley et al., 2014; McNamara, Crossley et al., 2013).
Our combined model reported the highest overall correlations and the strongest exact matches. Statistically, the model was stronger than the individual difference model, but equiva-lent to the text features model. The model included indices related to both individual differences and text features, providing evidence that a combination of both features can lead to gains in scoring accuracy (as hypothesized). The model reported was well within the expected accuracy range as found in previous published models and reported an exact accuracy that was higher than previous models. There was an increase in exact matches of 13% when compared to the individual differences model and an increase in exact matches of 2% when compared to the text features model. Textually, the model loaded the same indices as the text feature model (less frequent bigrams, less concrete words, and fewer coordinating conjunctions). From an individ-ual difference perspective, higher qindivid-uality essays were written by students with greater reading skills (Allen Snow, Crossley, et al., 2014; Stæhr, 2008). The results from the combined analysis demonstrate that both student and text features can act in unison to provide more accurate essay scores for students who use the W-Pal system.
The inclusion of both individual differences and text features could help improve feedback mechanisms and increase the validity of the W-Pal AES system. Improved feedback that is both more accurate and personalized could benefit W-Pal users, both in terms of their overall writing performance and their effective use of writing strategies. The feedback reported in this study is summative (i.e., a single score of overall writing), but we envision that similar feedback models could be developed at the formative level to provide specific feedback to students on introduction, body, and conclusion quality, overall essay cohesion, and paraphrasing quality. In addition, models that include both text features and individual differences could be used to assess discourse elements of texts (e.g., thesis statements and strength of arguments) as well as more traditional features such as grammar and spelling accuracy. These models may rely on a greater number of individual differences than the single individual difference that loaded into the current model, providing AWE systems with greater construct validation.
In general, the reported models show how groups of features can act both independently and dependently to assess essay quality. The results indicate that text features can increase the exact agreement for models above the use of individual differences and that a combination of the two features provides the strongest exact matches. We do not see improvements in the adjacent matches but note that an adjacent accuracy of 99%, as reported in the models, is quite strong and leaves little room for improvement. However, adjacent accuracy does not allow for precise feedback as compared to that found with exact accuracy, so there is a need to continue to improve models in terms of exact matches.
assign scores to essays.
More importantly, there are a number of individual differences that were not included in the current algorithm that could be collected in future studies. These could include simple survey questions related to writing strategy use, socio-economic status, future educational plans, amount of writing or reading completed at home or in the students’ free time, and specific grades in specific classes (to name but a few) to cognitive data such as working memory scores. Standardized test scores related to writing ability, math skills, and content knowledge could also be included in the models. Some of the variables investigated in this study may be problematic as well. For example, if a variable like gender were included in a regression model, it might bias a model toward one gender (although gender did not show a significant correlation with essay score in this study). In addition, because the essay was collected prior to engaging with W-Pal, the current models do not take into consideration sequential information such as the students’ score on a prior essay or the students’ scores on the games and quizzes included in each W-Pal writing module. Such scores could be used to provide an updated model of the students’ current knowledge and help improve overall scoring accuracy. Lastly, the model reported in this analysis takes a linear approach to essay scoring. Other approaches including a hierarchical approach or a clustering approach might also lead to improved results.
5.
CONCLUSION
Overall, the findings from this study provide evidence for the use of both text features and individual differences in conjunction to improve automatic essay scoring within an intelligent tutoring system. The results also give an indication of which features are most predictive of writing quality, providing a snapshot of how text features affect human judgments of writing quality and how individual differences relate to writing success. These findings have important implications for both educators and EDM researchers because they reveal that essay scoring approaches may benefit from incorporating measures not only about the essay itself, but also about the writer. The inclusion of such indices have the potential to improve the accuracy of the scores assigned to essays in a computerized writing intervention, as well as increase the validity and the personal nature of the feedback provided to students on their writing. Importantly, the study provides additional evidence that text features can be used to flesh out learning patterns within educational data sets and provides support for using NLP tools in EDM research. This is especially important considering that the text features reported in this study are automati-cally calculated and the individual differences discussed here are not difficult to collect in the sense that they can be compiled automatically using simple survey techniques. The simplicity of collecting these measures makes the effort to include them in current scoring models quite straightforward.
ACKNOWLEDGEMENTS
This research was supported in part by the Institute for Education Sciences (IES R305A080589 and IES R305G20018-02). Ideas expressed in this material are those of the authors and do not necessarily reflect the views of the IES. We thank various members of the SoLET lab at Arizona State University especially Jianmin Dai and Matthew Jacovina and members of the Institute for Intelligent Systems at The University of Memphis, in particular Zhiqiang Cai and Art Graesser.
REFERENCES
ALLEN, L. K., SNOW, E. L., & MCNAMARA, D. S. (2014). The long and winding road: Investigating the differential writing patterns of high and low skilled writers. In J. Stamper, S. Pardos, M. Mavrikis, & B. M. McLaren (Eds.), Proceedings of the 7th International Conference on Educational Data Mining(pp. 304-307). London, UK.
ALLEN, L. K., SNOW, E. L., & MCNAMARA, D. S. (2016). The narrative waltz: The role of flexibility on writing performance.Journal of Educational Psychology. doi: 10.1037/edu0000109
APPLEBEE, A. N., LANGER, J. A., JENKINS, L. B., MULLIS, I., & FOERTSCH, M. A. (1990). Learn-ing to write in our nation’s schools. Washington, DC: U.S. Department of Education, Office of Edu-cational Research and Improvement.
ATTALI, Y., & POWERS, D. (2008). A developmental writing scale. ETS Research Report Series, 2008(1). Princeton, NJ: ETS
BAKER, R., & SIEMENS, G. (2014). Educational data mining and learning analytics. In Sawyer, K. (Ed.) Cambridge Handbook of the Learning Sciences: 2nd Edition, pp. 253-274.
BAKER, R. S, DE CARVALHO, A. M., RASPAT, J., ALEVEN, V., CORBETT, A. T., & KOEDINGER, K. R. (2009). Educational software features that encourage and discourage ”gaming the system”. Proceedings of the 14th International Conference on Artificial Intelligence in Education, 475-482. BAKER, R.S., & YACEF, K. (2009). The State of Educational Data Mining in 2009: A Review and
Future Visions.Journal of Educational Data Mining, 1 (1), 3-17.
BECK, J.E., CHANG, K., MOSTOW, J., CORBETT, A.T. (2008). Does help help? Introducing the Bayesian evaluation and assessment methodology. Proceedings of Intelligent Tutoring Systems, ITS 2008, 383–394.
BOWERS, A.J. (2010). Analyzing the longitudinal K-12 grading histories of entire cohorts of students:
Grades, data driven decision making, dropping out and hierarchical cluster analysis. Practical Assess-ment, Research & Evaluation (PARE), 15(7), 1-18.
CROSSLEY, S. A., MCNAMARA, D. S., BAKER, R., WANG, Y., PAQUETTE, L., BARNES, T., & BERGNER, Y. (2015). Language to completion: Success in an educational data mining massive open
online class. In Santos, O. C., Boticario, J. G., Romero, C., Pechenizkiy, M., Merceron, A., Mitros, P., Luna, J. M., Mihaescu, C., Moreno, P., Hershkovitz, A., Ventura, S., & Desmarais, M. (eds.) Proceedings of the 8thInternational Conference on Educational Data Mining (EDM).(pp. 388-392). CROSSLEY, S. A., ROSCOE, R. D., MCNAMARA, D. S., & GRAESSER, A. C. (2011). Predicting
hu-man scores of essay quality using computational indices of linguistic and text features. In G. Biswas, S. Bull, J. Kay, & A Mitrovic (Eds.),Proceedings of the 15thInternational Conference on Artificial Intelligence in Education(pp. 438-440). Auckland, New Zealand: AIED.
EZEN-CAN, A., & BOYER, K. E. (2015). Understanding student language: An unsupervised dialogue
FERRARI, M., BOUFFARD, T., & RAINVILLE, L. (1998). What makes a good writer? Differ-ences in good and poor writers’ self-regulation of writing. Instructional Science, 26, 473-488. doi:10.1023/A:1003202412203
FITZGERALD, J. & SHANAHAN, T. (2000). Reading and writing relations and their development. Edu-cational Psychologist, 35,39-50.
JING, S. (2015). Automatic grading of short answers for MOOC via semi-supervised document
cluster-ing. In Santos, O. C., Boticario, J. G., Romero, C., Pechenizkiy, M., Merceron, A., Mitros, P., Luna, J. M., Mihaescu, C., Moreno, P., Hershkovitz, A., Ventura, S., & Desmarais, M. (eds.)Proceedings of the 8thInternational Conference on Educational Data Mining (EDM).
MACGINITIE, W. H., & MACGINITIE, R. K. (1989).Gates-MacGinitie reading tests. Chicago:
River-side.
MCNAMARA, D. S., CROSSLEY, S. A., & MCCARTHY, P. M. (2010). The linguistic features of writing quality.Written Communication, 27, 57-86.
SAMEI, B., RUS, V., NYE, B., & MORRISON, D. (2015). Hierarchical dialogue act classification in online tutoring sessions, In Santos, O. C., Boticario, J. G., Romero, C., Pechenizkiy, M., Merceron, A., Mitros, P., Luna, J. M., Mihaescu, C., Moreno, P., Hershkovitz, A., Ventura, S., & Desmarais, M. (eds.)Proceedings of the 8th International Conference on Educational Data Mining (EDM).
VARNER, L. K., ROSCOE, R. D., & MCNAMARA, D. S. (2013). Evaluative misalignment of 10th-grade student and teacher criteria for essay quality: An automated textual analysis. Journal of Writing Research, 5,35-59.
WEN, M., YANG, D., & ROSE, C. P. (2014a). Sentiment analysis in MOOC discussion forums: What does it tell us? In the Proceedings of the 7th International Conference on Educational Data Mining, 130-137.
WEN, M., YANG, D., & ROSE, C. P. (2014b). Linguistic reflections of student engagement in
mas-sive open online courses.In the Proceedings of the International Conference on Weblogs and Social Media.
6.
A
PPENDIX1
SCORE OF 6: An essay in this category demonstrates clear and consistent mastery, although it may have a few minor errors. A typical essay effectively and insightfully develops a point of view on the issue and demonstrates outstanding critical thinking, using clearly appropriate examples, reasons, and other evidence to support its position is well organized and clearly fo-cused, demonstrating clear coherence and smooth progression of ideas exhibits skillful use of language, using a varied, accurate, and apt vocabulary demonstrates meaningful variety in sen-tence structure is free of most errors in grammar, usage, and mechanics.
SCORE OF 5: An essay in this category demonstrates reasonably consistent mastery, al-though it will have occasional errors or lapses in quality. A typical essay effectively develops a point of view on the issue and demonstrates strong critical thinking, generally using appropri-ate examples, reasons, and other evidence to support its position is well organized and focused, demonstrating coherence and progression of ideas exhibits facility in the use of language, us-ing appropriate vocabulary demonstrates variety in sentence structure is generally free of most errors in grammar, usage, and mechanics.
SCORE OF 4: An essay in this category demonstrates adequate mastery, although it will have lapses in quality. A typical essay develops a point of view on the issue and demonstrates competent critical thinking, using adequate examples, reasons, and other evidence to support its position is generally organized and focused, demonstrating some coherence and progression of ideas exhibits adequate but inconsistent facility in the use of language, using generally appro-priate vocabulary demonstrates some variety in sentence structure has some errors in grammar, usage, and mechanics
SCORE OF 3: An essay in this category demonstrates developing mastery, and is marked by ONE OR MORE of the following weaknesses: develops a point of view on the issue, demon-strating some critical thinking, but may do so inconsistently or use inadequate examples, reasons, or other evidence to support its position is limited in its organization or focus, or may demon-strate some lapses in coherence or progression of ideas displays developing facility in the use of language, but sometimes uses weak vocabulary or inappropriate word choice lacks variety or demonstrates problems in sentence structure contains an accumulation of errors in grammar, usage, and mechanics.
SCORE OF 2: An essay in this category demonstrates little mastery, and is flawed by ONE OR MORE of the following weaknesses: develops a point of view on the issue that is vague or seriously limited, and demonstrates weak critical thinking, providing inappropriate or insuf-ficient examples, reasons, or other evidence to support its position is poorly organized and/or focused, or demonstrates serious problems with coherence or progression of ideas displays very little facility in the use of language, using very limited vocabulary or incorrect word choice demonstrates frequent problems in sentence structure contains errors in grammar, usage, and mechanics so serious that meaning is somewhat obscured.
SCORE OF 1: An essay in this category demonstrates very little or no mastery, and is severely flawed by ONE OR MORE of the following weaknesses: develops no viable point of view on the issue, or provides little or no evidence to support its position is disorganized or un-focused, resulting in a disjointed or incoherent essay displays fundamental errors in vocabulary demonstrates severe flaws in sentence structure contains pervasive errors in grammar, usage, or mechanics that persistently interfere with meaning