Comparative Study on Different Turbulent
Models for Internal Flow in a Three
Dimensional Car Model Using CFD
Lakshminarasimha N1, Dr M S Rajagopal2
Assistant Professor, Department of Mechanical Engineering, New Horizon College of Engineering, Bengaluru, India1 Professor and Chairman, Department of Mechanical Engineering, Dayananda Sagar University, Bengaluru, India2
ABSTRACT: Human comfort is one of the major concerns in designing any vehicle passenger cabin. Investigation on air flow requirement and temperature distribution becomes very much essential in order to ensure thermal comfort and hence considering this as top priority, an air conditioning system need to be developed without affecting the vehicle performance. In present study, a symmetric three dimensional car model is considered and passengers are with no heat generation. Numerical investigation is carried out using ANSYS Fluent to understand the velocity and temperature distribution in passenger car cabin for two different inlet velocity conditions. Also a comparative analysis is been carried out for the same using different turbulent models such as standard k-epsilon model, RNG k-epsilon model and SST k-omega model to understand computation time and results variation. From the analysis, temperature results obtained around the passengers found to be in thermal comfort zone as per requirement of ASHRAE 2003 and among three turbulent models, SST k-omega model gives better results with same accuracy in less computation time.
KEYWORDS:Thermal comfort, ANSYS Fluent, Turbulent models
I.INTRODUCTION
Travelling is the major part in Humans life during in where would feel relaxed and need to be memorable. Vehicle used for travelling should be with comfort and safety hence an enclosed cabin is required with an HVAC system. An enclosed air conditioned cabin results in Thermal or human comfort, Smoke and dust avoid travel, protection from weather condition and other environmental influences. In designing such a cabin it is extremely important to ensure that HVAC system incorporated should not affect the vehicle performance and hence investigation on airflow requirement and temperature distribution is essential to ensure vehicle performance optimization.
Computational Fluid Dynamics (CFD) tool is being playing a major role in designing such a complex systems involving huge and complex flow and heat equations which is impossible through human analytical evaluation and calculation. Hence CFD tool has become a major role player in Automobile industry in aerodynamic design vehicle, Engine optimization combustion and thermal comfort cabins.
In present paper, CFD analysis using different turbulent models is been carried out to investigate the air flow requirement and temperature distribution for different velocity conditions using commercial CFD tool ANSYS Fluent.
II.LITERATURESURVEY
A literature survey is been conducted to find if any analysis on an internal flow of a car has been conducted on similar ground of present work. Several internal flow analysis conducted by few individuals were found but those analysis was dependent on other factors and parameters. The summary of those reports are as given below.
[1] Haslinda Mohamed Kamar et.al., 2012
Aim of the study was to investigate air flow requirement and air temperature in passenger compartment considering glazing effect in analysis
The passengers are considered to be solid bodies without heat generation
Results showed that, when glazing material is used the air temperature around the driver was slightly lower than at rear passenger and when Green insulated laminate is used the air temperature in both front and rear end was found to be reduced
[2] Zvar Baskovic et.al. 2014
This research article describes numerical adiabatic flow simulation conducted for “mute- electric car”.
The car has seven vents. Three are under the windshield window, two on dashboards sides and two in the passengers foot well in which air enters the cabin through these vents
Heat generation by the passenger was not considered Analysis was carried out only for air velocities in a cabin
Air velocities were compared for with and without passengers using different turbulent models such as standard k-epsilon, RNG k-epsilon and SST k-omega model in comparison with three different wall treatments such as standard, scalable and enhanced wall treatments and compared with experimental results
Study finds SST k-omega model gives better overall performance compared to standard k-epsilon and RNG k-epsilon models
[3] Om Prakash Singh, 2015
Paper presents the study on air flow inside a passenger car cabin with varied angle of inlet vents
Analysis were carried out in three stages; In first stage, temperature was measured experimentally, In second stage 3D cad model was generated by measuring design data and finally CFD car model was developed to validate the experimental data
Results shown that faster cooling and uniform air distribution is possible through varied angle of vents
Paper highlights the empirical formulas for calculating solar heat flux and convective heat transfer co-efficient and also air velocities to be chosen for analysis through experimental data’s
It is observed that many literatures are available on similar grounds of present work. However only few important articles are discussed under this section, remaining journals related is listed in reference. These articles help as a ready reckoner in choosing turbulent models, boundary conditions and discretization schemes.
III.METHODOLOGY
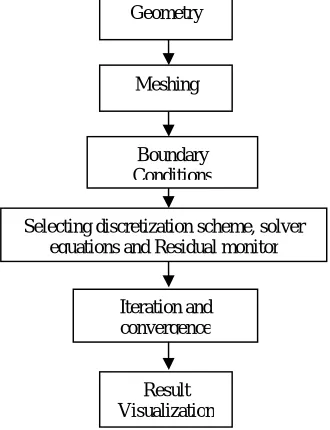
In any analysis process, the steps involved are creating Geometry, Meshing and Analysis. The present work is carried in the following process as shown in Figure 1.
Figure 1: Analysis process
Geometry
Meshing
Boundary Conditions
Selecting discretization scheme, solver equations and Residual monitor
Iteration and convergence
The three dimension model of car geometry is made by using CATIA, Meshing and Analysis is carried out using ANSYS products.
3.1 Geometry
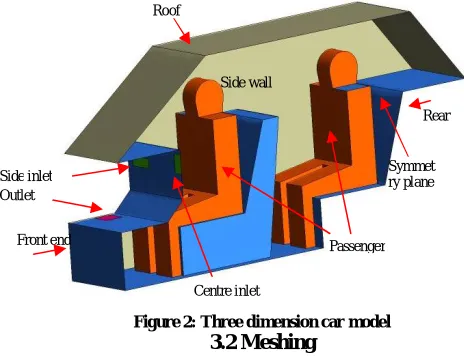
The three dimension car model is a “Proton Wira” consists of four passengers, front end with inlet and outlet vents, rear end, side wall and a roof wall. For simplicity, model is considered to be planar symmetry as shown in Figure 2. The front end of the cabin consists of two inlet vents one is side vent and other is centre vent and bottom of front end consist of outlet vent. The passenger body is made flat for simplicity and placed in 90 degree view.
Figure 2: Three dimension car model
3.2 Meshing
The three dimension mesh model is as shown in Figure 3 and side view of the same model is as shown in Figure 4. The Mesh is tetrahedral type with 353237 elements and 69039 nodes. The same mesh model is used for all the different cases of analysis.
Figure 3: Three dimension mesh model Figure 4: Side view of mesh model
The analysis is been carried out for above mesh model for two different inlet velocity conditions as shown in Table 1, in comparison with three different turbulent models such as standard k- epsilon model, RNG k-epsilon model and SST k-omega model.
Side inlet Outlet
Centre inlet
Passenger Symmet ry plane
Front end
Rear Roof
Table 1: Different inlet velocity conditions
Location Case 1 Case 2
Velocity (m/s)
Side inlet vent 2 3
Centre inlet vent 2 3
For all the cases, Residuals for continuity, x-y-z velocity and turbulent models are 10-3 and for energy 10-6 is considered for convergence.
The convergence criterion for continuity, x-y-z velocity, energy and standard k-epsilon (ske) for case 1 is as shown in Figure 5 and for case 2 is as shown in Figure 6.
Figure 5: Convergence criteria for ske- case 1 Figure 6: Convergence criteria for ske- case 2
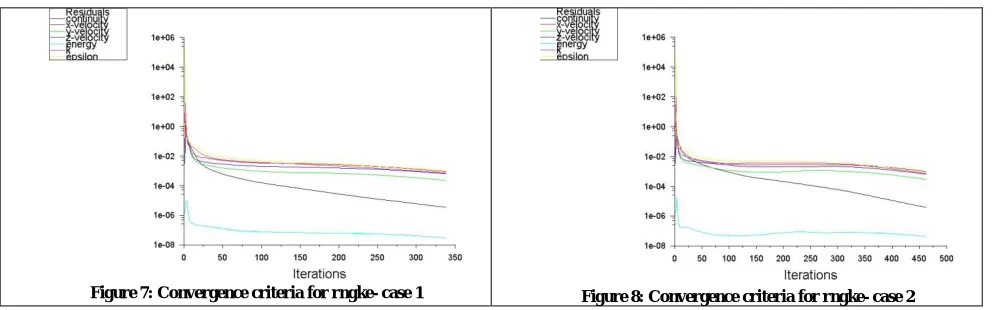
The convergence criterion for continuity, x-y-z velocity, energy and RNG k-epsilon (rngke) for case 1 is as shown in Figure 7 and for case 2 is as shown in Figure 8.
Figure 7: Convergence criteria for rngke- case 1 Figure 8: Convergence criteria for rngke- case 2
Figure 9: Convergence criteria for sstkw- case 1 Figure 10: Convergence criteria for sstkw- case 2
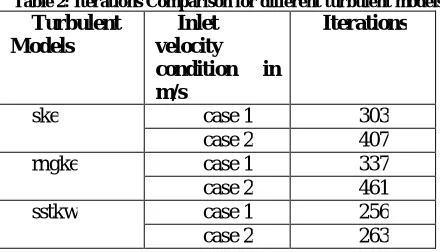
As the summary, Table 2 shows the comparison on convergence criteria or iterations for different turbulent models.
Table 2: Iterations Comparison for different turbulent models
Turbulent Models
Inlet velocity condition in m/s
Iterations
ske case 1 303
case 2 407
rngke case 1 337
case 2 461
sstkw case 1 256
case 2 263
From Table 2, it is observed that the mesh with sstkw model converged in less computation time or iterations.
3.3 Solution Methodology
Present investigation is been carried out based on the following assumptions:
Flow is turbulent
Flow is incompressible
Flow is at steady state condition
Passengers are with no heat generation
Walls are stationary and with no slip shear condition .
The other boundary conditions incorporated for the mesh model is as shown in Table 3.
Table 3: Boundary conditions
Location Boundary condition
type
Values
Case 1 Case 2
Side inlet vent Velocity [1] 2 3
Centre inlet vent Velocity [1] 2 3
Outlet vent Pressure 0 (gauge pressure) 0 (gauge pressure)
Roof wall No slip and Heat
flux [1]
260 W/m2 260 W/m2
Side wall No slip - -
The flow is solved for three different turbulent models such as standard k-epsilon, RNG k-epsilon and SST k-omega. SIMPLE discretization scheme is used to solve transport momentum equation and turbulence parameters.
3.4 Mathematical models
Each and every cell in the computational domain is converged for basic governing equations such as Mass conservation equation, Momentum conservation equation and Energy conservation equation. These basic equations are valid for both compressible and incompressible flows. The equations with no time derivative is said to be steady state flow equations.
Since flow is turbulent additional transport equations are solved as described below: Standard k-epsilon (k- ) model:
It is a semi- empirical model and is also known as two equation model in which two separate transport equations for turbulent kinetic energy (k) and its dissipation rate ( ) used independently to determine the turbulent velocity and length scales.
The model transport equations for ‘k’ is derived from exact equation, while the model transport equations for ‘ ’ was obtained using physical reasoning.
It is one of the popular models in industrial flow and heat transfer analysis due to its Robustness, economy and reasonable accuracy for a wide range of turbulent flows.
RNG k-epsilon (k- ) model:
Mathematical technique called “Renormalization group” (RNG) is used for Navier-Stokes equation to derive RNG based k- Epsilon (k- ).
Though it seems similar to standard k- Epsilon (k- ) model but few refinements are included as below:
It has additional term in equation, which improves the accuracy for rapidly strained flows
It enhances accuracy for swirling flows
It accounts for low Reynolds number effects
These features make the RNG k- Epsilon (k- ) model more accurate and reliable than Standard k-epsilon (k- ) model.
Shear-Stress Transport (SST) k- model:
It is an empirical model based on model transport equations for turbulent kinetic energy (k) and specific dissipation rate ( ).
This model predicts accurate measurements for the following:
far wakes
mixing layers
plane, round and radial jets
Thus this model is applicable to wall bounded flows and free shear flows.
All above mathematical models cannot be solved analytically and hence FLUENT based solver is used to solve the complex flow equations.
For further study on these models refer FLUENT theory guide [4].
3.5 Results and discussion
As stated in the earlier sections, the analysis is carried out for two cases of inlet velocity conditions comparing with different turbulent models such as Standard k-epsilon (ske), RNG k-epsilon (rngke) and SST k-omega (sstkw). The results obtained for those are discussed below:
Figure 11: Result visualization plane
3.5.1 Velocity distribution
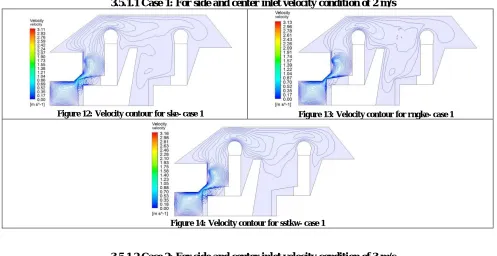
3.5.1.1 Case 1: For side and center inlet velocity condition of 2 m/s
Figure 12: Velocity contour for ske- case 1 Figure 13: Velocity contour for rngke- case 1
Figure 14: Velocity contour for sstkw- case 1
3.5.1.2 Case 2: For side and center inlet velocity condition of 3 m/s
Figure 15: Velocity contour for ske- case 2 Figure 16: Velocity contour for rngke- case 2
Figure 17: Velocity contour for sstkw- case 2
Figure 12, Figure 13 and Figure 14 shows the velocity contours for ske, rngke and sstkw for case 1 and Figure 15, Figure 16 and Figure 17 shows the velocity contours for ske, rngke and sstkw for case 2. Comparison with three turbulent models for the case-1 and case-2, the maximum velocity of approximately 3m/s and 4.5m/s found at outlet. Also it can be observed that the velocity distribution for sstkw is better than ske and rngke though there is negligible variation in the results.
3.5.2 Temperature distribution
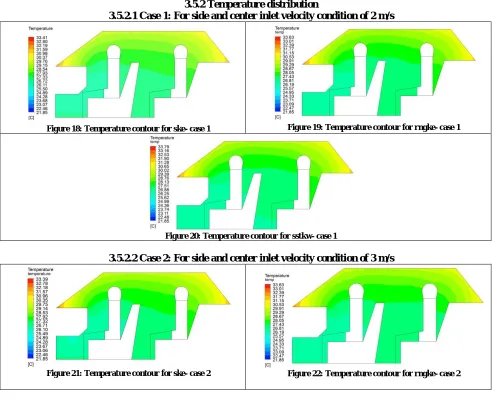
3.5.2.1 Case 1: For side and center inlet velocity condition of 2 m/s
Figure 18: Temperature contour for ske- case 1 Figure 19: Temperature contour for rngke- case 1
Figure 20: Temperature contour for sstkw- case 1
3.5.2.2 Case 2: For side and center inlet velocity condition of 3 m/s
Figure 23: Temperature contour for sstkw- case 2
Figure 18, Figure 19 and Figure 20 shows the temperature contours for ske, rngke and sstkw for case 1 and Figure 21, Figure 22 and Figure 23 shows the temperature contours for ske, rngke and sstkw for case 2. Comparison with three turbulent models for both case-1 and case-2, the maximum temperature of approximately 330C found at front and rear ends sharp edges (dead zone) as because there is no air flow at those zones. Also found that there is negligible increase in temperature in the domain for both the cases. The temperature at the passengers section is found to be 25 – 280C.
According to the requirements for thermal comfort in summer conditions interior air temperature should be in the range of 23 to 280C (ASHRAE 2003) [5].
3.5.3 Velocity streamlines
3.5.3.1 Case 1: For side and center inlet velocity condition of 2 m/s
Figure 24: Velocity streamlines for ske- case 1 Figure 25: Velocity streamlines for rngke- case 1
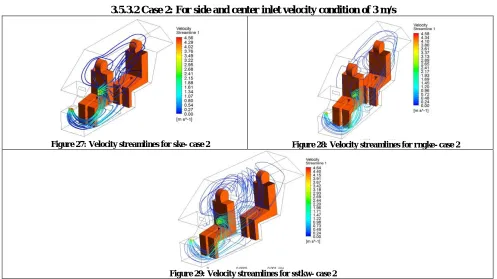
3.5.3.2 Case 2: For side and center inlet velocity condition of 3 m/s
Figure 27: Velocity streamlines for ske- case 2 Figure 28: Velocity streamlines for rngke- case 2
Figure 29: Velocity streamlines for sstkw- case 2
Figure 24, Figure 25 and Figure 26 shows the velocity streamlines for ske, rngke and sstkw for case 1 and Figure 27, Figure 28 and Figure 29 shows the velocity streamlines for ske, rngke and sstkw for case 2. Streamlines signifies the circulation zones and air distribution in the domain.
It can be observed that sstkw model gives better velocity streamlines compared to ske and rngke for both the cases.
As summary, Figure 30 and Figure 31 shows the graph plotted for the results of maximum velocity and maximum temperature for different turbulent models. As discussed earlier and from the graph the variation in the results is negligible.
IV.CONCLUSIONS
The analysis is been carried out on three dimension car cabin for two different inlet velocity conditions in comparison with three different turbulent models such as standard k-epsilon, RNG k-epsilon and SST K-omega, from the results obtained the following are the conclusions drawn:
1. CFD tool is a powerful solver for complex internal flow analysis in determining the velocity and temperature distribution
2. CFD provides the insight of the problem through color post scripts of results. This help the designers for decision making
3. Results obtained from SST K-omega model is with less computation time and iterations with same accuracy compared to k-epsilon and RNG k-epsilon models
4. Velocity distribution contours, temperature distribution contours and velocity streamline plots obtained for SST K-omega model is better than compared to k-epsilon and RNG k-epsilon models though there are negligible variation in the results
5. Temperatures found at the passenger section is about 25- 280C which is in the acceptable range as per the requirement of ASHRAE 2003
It can also be concluded that the present study is no more exhaustive and can be carried as future scope of work by changing the vent shapes, vent positions, human with heat generation and considering the glazing effects etc.
The results obtained from the present study help the designer as a ready reckoner in making decision faster in choosing the Boundary conditions, turbulent models and discretization schemes.
REFERENCES
[1] Haslinda Mohamed Kamar, Nazri Kamsah, and Ahmad Miski Mohammad Nor, “Numerical Analysis of Air-Flow and Temperature Field in a Passenger Car Compartment”, “4th International Meeting of Advances in Thermofluids, IMAT 2011- Melaka, Malaysia”, “AIP Conference
Proceedings”, Volume: 1440, PP: 854-862, Published- 1 Dec 2012
[2] Zvar Baskovic, Lorenz and Butala, “ Adiabatic flow simulation in an air conditioned vehicle passenger compartment”, “Int j simul model”, 13 (2014) 1, 42-53, ISSN 1726-4529
[3] Om Prakash Singh, Rohit Raut, Mrinmoy Biswas and Ramji Singh, “ Effect of Dynamic Vents on the Thermal Comfort of a Passenger Car”, “Journal of Mechanical Engineering”, 61(2015)10, 561-570
[4] “Fluent- Theory guide”, April- 2009
[5] Dragan Ružić and Ferenc Časnji, “Thermal Interaction between a Human Body and a Vehicle Cabin”, Chapter 11
[6] Vijay Kumar M, Dr. Basawaraj & Dr. B R Shridhar, “ CFD Analysis for the cooling vent in Automibile”, “International journal of ignites minds”, Volume: 02, Issue: 07, Jul- 2015
[7] Zeya Ahmad Quadri & Jomon Jose, “Computational Analysis of Thermal Distribution within Passenger Car Cabin”, ISSN: 2319-3182, Volume: 02, Issue: 02, 2013
[8] Varad M. Limaye, Deshpande M. D, Sivapragasam M and Vivek Kumar, “Design of Dynamic Airvents and Airflow Analysis in a Passenger Car Cabin”, SAS-TECH, Volume: 11, Issue: 01, Apr- 2012
[9] Jalal M. Jalil and Haider Qassim Alwan, “CFD Simulation for a Road Vehicle Cabin”, JKAU: Eng. Sci., Vol. 18 No. 2, pp: 123-142 (2007 A.D. /1428 A.H.)
[10] Russell Manning, John Ewing, “Temperature in cars survey”, RACQ Vehicle Technologies, Report- Feb 2009 [11] Yunus. A. Cengel, “ Heat Transfer- A Practical Approach”, Text book on Heat Transfer, Edition 2002 [12] Incropera, Dewitt, Bergman, Lavine, “Fundamentals of Heat and Mass Transfer”, 6th Edition