HIGHLIGHTED ARTICLE
| INVESTIGATION
Layers of Cryptic Genetic Variation Underlie a Yeast
Complex Trait
Jonathan T. Lee,* Alessandro L. V. Coradini,*,†Amy Shen,* and Ian M. Ehrenreich*,1 *Molecular and Computational Biology Section, Department of Biological Sciences, University of Southern California, Los Angeles, California 90089-2910 and†Laboratory of Genomics and Bioenergy, Department of Genetics and Evolution, Institute of Biology, Universidade Estadual de Campinas, São Paulo 13083-970, Brazil
ABSTRACTCryptic genetic variation may be an important contributor to heritable traits, but its extent and regulation are not fully understood. Here, we investigate the cryptic genetic variation underlying aSaccharomyces cerevisiaecolony phenotype that is typically suppressed in a cross of the laboratory strain BY4716 (BY) and a derivative of the clinical isolate 322134S (3S). To do this, we comprehensively dissect the trait’s genetic basis in the BYx3S cross in the presence of three different genetic perturbations that enable its expression. This allows us to detect and compare the specific loci that interact with each perturbation to produce the trait. In total, we identify 21 loci, all but one of which interact with just a subset of the perturbations. Beyond impacting which loci contribute to the trait, the genetic perturbations also alter the extent of additivity, epistasis, and genotype–environment interaction among the detected loci. Additionally, we show that the single locus interacting with all three perturbations corresponds to the coding region of the cell surface geneFLO11. While nearly all of the other remaining loci influenceFLO11transcription incisortrans, the perturbations tend to interact with loci in different pathways and subpathways. Our work shows how layers of cryptic genetic variation can influence complex traits. Here, these layers mainly represent different regulatory inputs into the transcription of a single key gene.
KEYWORDScryptic genetic variation; epistasis; genotype–environment interaction; complex traits; genetic architecture; genetic background effects
M
OST research on complex traits focuses on character-izing the genetic basis of phenotypic diversity that is visible within populations (Atwell et al. 2010; Aylor et al. 2011; Mackayet al.2012; Bloomet al.2013). Yet, these same populations can also harbor cryptic genetic variation (here-after,“cryptic variation”) that does not typically impact phe-notype, and is only observable when particular genetic or environmental perturbations occur (Rutherford and Lindquist 1998; Queitsch et al. 2002; Bergman and Siegal 2003; Dworkinet al.2003; Gibson and Dworkin 2004; Jaroszand Lindquist 2010; Geiler-Samerotteet al.2016). This cryptic variation may be an important source of phenotypic variabil-ity in medically and evolutionarily significant traits (Le Rouzic and Carlborg 2008; McGuigan and Sgro 2009; Paaby and Rockman 2014). Thus, it is imperative that we determine the extent of cryptic variation within populations, as well as the mechanisms that convert this cryptic variation between silent and visible states. However, such work is in-herently difficult because the specific perturbations needed to uncover cryptic variation, as well as the exact identities of the cryptic genetic variants (hereafter,“cryptic variants”) that are affected by these perturbations, are rarely known. Such information is critical to obtaining a more complete, mecha-nistic understanding of cryptic variation.
In previous papers, we developed an experimental system that can be used to systematically identify cryptic variants influencing a colony phenotype in Saccharomyces cerevisiae (Taylor and Ehrenreich 2014, 2015b; Leeet al.2016; Taylor et al.2016). The laboratory strain BY4716 (BY), a haploid derivative of the clinical isolate 322134S (3S), and their hap-loid recombinant progeny form “smooth” colonies when grown on solid media (Figure 1A). However, certainde novo Copyright © 2019 Leeet al.
doi:https://doi.org/10.1534/genetics.119.301907
Manuscript received January 2, 2019; accepted for publication February 14, 2019; published Early Online February 20, 2019.
Available freely online through the author-supported open access option.
This is an open-access article distributed under the terms of the Creative Commons Attribution 4.0 International License (http://creativecommons.org/licenses/by/4.0/), which permits unrestricted use, distribution, and reproduction in any medium, provided the original work is properly cited.
Supplemental material available at Figshare: https://doi.org/10.25386/genetics. 7664570.
1Corresponding author: Molecular and Computational Biology Section, Ray R. Irani Hall
and induced mutations, as well as recombination between the promoter and coding region of the cell surface gene
FLO11, can enable some BYx3S segregants to express an al-ternative“rough”colony phenotype (Figure 1B). Throughout the current paper, we refer to these new alleles that are not naturally present in BY or 3S but make it possible for the rough phenotype to be expressed in the BYx3S cross as ge-netic perturbations (GPs). These GPs on their own are
insuf-ficient to cause expression of the rough phenotype; rather, cryptic variants that segregate between BY and 3S are also needed. Moreover, BYx3S segregants that express the trait in the presence of a given GP usually exhibit the phenotype in a temperature-sensitive manner. However, by backcrossing these segregants and examining their backcross progeny across tem-peratures, additional cryptic variation can often be found that reduces or eliminates temperature sensitivity (Figure 1C).
Crucially, genetic mapping and genetic engineering tech-niques can be used to comprehensively identify the specific GPs and cryptic variants that enable a given rough segregant to express the trait. In our initial work on colony morphology in the BYx3S cross, we found that a de novo loss-of-function mutation inIRA2(“GPa”), a negative regulator of Ras signal-ing, had occurred during the generation of BYx3S segregants and enabled2% of cross progeny to express the phenotype (Taylor and Ehrenreich 2014) (Figure 1D). Across several papers, we demonstrated that GPa causes trait expression through temperature-dependent, higher-order genetic inter-actions involving cryptic variants inherited from both BY and 3S (Taylor and Ehrenreich 2014, 2015b; Lee et al. 2016). Subsequently, we identified otherde novoand induced mu-tations that facilitate expression of the rough phenotype in the BYx3S cross (Taylor and Ehrenreich 2015b; Tayloret al. 2016). These other mutations tend to also disrupt negative regulation of signaling and transcription within the Ras path-way, and mostly interact with the same alleles found in the studies focused on GPa.
In a screen of 106 independently generated BYx3S crosses in which 17% of the crosses produced at least one rough segregant, we also found individuals that expressed the trait despite lacking any detectablede novomutations (Tayloret al. 2016). Instead, two-thirds of these segregants inherited re-combination events in the promoter ofFLO11(“GPb,”Figure 1E). In total, we recovered six different recombination break-points, which all occurred within 1.3 kb of each other.FLO11
encodes aflocculin whose display on the cell surface facili-tates cell-to-cell adhesion, which is required for expression of the rough phenotype (Lo and Dranginis 1996; Taylor and Ehrenreich 2015b). Genetic engineering experiments showed that the recombination events brought at least two alleles at closely linked loci in or nearFLO11onto the same chromosome, resulting in a new FLO11haplotype that be-haves like the mutations described in our earlier studies (Tayloret al. 2016). Specifically, segregants with a BY pro-moter and a 3S coding region had the potential to express the trait. Despite discovering GPb in this past study, we neither resolved the cryptic variant(s) in the FLO11promoter nor
comprehensively mapped the loci enabling this GP to exert a phenotypic effect. Thus, it was not possible to compare the genetic basis of the rough phenotype in the presence of GPb to our initial work on GPa.
Here, we use the rough colony system to determine how different types of GPs interact with distinct cryptic variants in the BYx3S cross to produce the same trait. In addition to GPa and GPb, we also examine a third GP that facilitates expression of the rough phenotype. To generate“GPc,”we knocked out the activatorFlo8and the repressorSfl1(Figure 1G), which are the main transcription factors that act downstream of the Ras pathway to regulate colony morphology in the cross. Pre-viously, we showed that deletion ofSFL1is sufficient to en-able Ras-dependent cryptic variants to express FLO11and that transcription of FLO11 in these sfl1D segregants is Flo8-dependent (Taylor and Ehrenreich 2015b). By elimi-nating these key regulators and screening for segregants expressing the trait, we sought to uncover previously uniden-tified cryptic variants that can also give rise to the rough phenotype. We successfully recovered one rough BYx3S
flo8Dsfl1Dsegregant, making it possible to examine the ge-netic basis of the phenotype in the absence of its primary transcriptional regulators.
In this paper, we comprehensively determine the genetic basis of the rough phenotype across temperatures for GPb and GPc, and compare these results to our past work on GPa. Across the three GPs, we identify 21 loci that contribute to the rough phenotype. Of these loci, 20 show phenotypic effects that are influenced by particular combinations of GP, other loci, and temperature. Although all three factors prove im-portant, GP is by far the strongest determinant of which loci show phenotypic effects, impacting nearly all identified loci. Additionally, we find that the detected loci exhibit varying degrees of additivity, epistasis, and genotype–environment interaction depending on the GP that uncovers them. At the molecular level, most, if not all, of the identified loci infl u-ence FLO11 regulation incis or trans, suggesting that our
findings result from complex genetic and environmental ef-fects on the regulation of a single key gene,FLO11. These
findings enhance our understanding of both the extent of cryptic variation within populations and the mechanisms by which GPs reveal cryptic variants. Further, they show how the uncovering of cryptic variation can result in highly divergent genetic architectures that produce the same trait, even within a single population examined in a common environment.
Materials and Methods
Knockout of FLO8 and SFL1 in BY and 3S strains
double-stranded oligo repair template, using the lithium ace-tate method (Gietz and Woods 2002). Oligos were 90 bases long with homology to eitherFLO8orSFL1, with inclusion of a stop codon followed by single-base frameshift deletion in the middle. Stop codons were introduced at amino acids 155 and 39 in FLO8and SFL1, respectively. Transformed cells were
plated on solid yeast nitrogen base (YNB) media lacking uracil to select for retention of the pML104 plasmid. Plasmids were then eliminated from the transformants by plating on 5-fluoroorotic acid (5-FOA). Presence of the intended genetic modifications was checked in the transformants using Sanger sequencing.
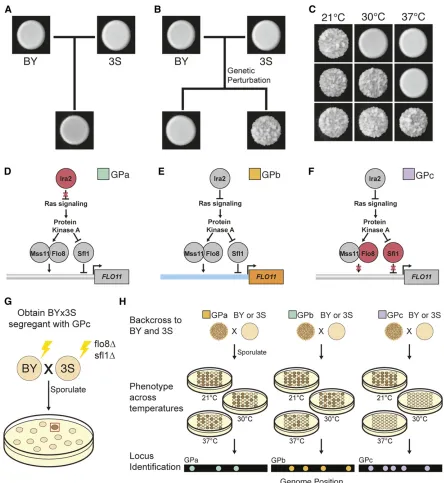
Figure 1 Different GPs interact with cryptic variation to cause rough morphology. (a) The BY and 3S strains, as well as their haploid cross progeny, form
“smooth”colonies. (b) Certain GPs can cause haploid BYx3S segregants to express an alternative“rough”colony phenotype. (c) Expression of the colony trait can be temperature-sensitive, with segregating loci causing individuals to form rough colonies at 21°only, 21 and 30°, or 21, 30, and 37°. (d) GPa is a loss-of-function mutation inIRA2, which encodes a Ras negative regulator. (e) GPb results from recombination between the BY (blue)FLO11
Isolation of rough BYx3S F2segregants
GPa and GPb were identified in BYx3S crosses produced by sporulating independently generated BY/3S diploids. The GPa rough F2segregant included in the current study is
dis-cussed in Taylor and Ehrenreich (2014, 2015b) and Leeet al. (2016), while the GPb rough F2segregant used in this study
was described in Tayloret al.(2016), in which it was referred to as“Rough segregant 13.”GPa and GPb were identified in these past studies by taking individual rough F2segregants
recovered from screens of BYx3S crosses, performing genetic mapping in backcross populations obtained by mating the respective rough F2segregants to both BY and 3S, and
ana-lyzing whole-genome sequencing data for backcross segre-gants. Here, to obtain a rough F2segregant with GPc,flo8D sfl1DBY and 3S strains were mated to one another. The result-ing diploid was sporulated and plated at low density (300 colonies per plate) onto YNB containing canavanine to select for MATahaploids using the Synthetic Genetic Array (SGA) system (Tonget al.2001). After 5 days at 30°, colonies were replicated onto yeast extract-peptone-ethanol (YPE) plates. A single rough colony was identified after 4 days of growth at 21°.
Generation of backcross segregants
All data for GPa were described in previous papers (Taylor and Ehrenreich 2014, 2015b; Leeet al.2016), while data for GPb and GPc were generated in this current paper. To obtain backcross progeny for genetic mapping and segregation anal-ysis, the rough F2segregant with GPb was backcrossed to
wild-type BY and 3S strains, while the rough F2 segregant
with GPc was backcrossed toflo8Dsfl1DBY and 3S strains. A second-generation backcross was also performed for GPb; specifically, a rough segregant from the GPbx3S cross was mated to BY. For all backcrosses, diploids were sporulated and plated at low density on YNB plates containing canava-nine to select for randomMATaspores using the SGA marker system (Tong et al. 2001). After 5 days of growth at 30°, haploid colonies were replicated onto YPE plates and incu-bated at 21°. Backcross segregants expressing rough mor-phology after 4 days of growth on YPE were inoculated into liquid yeast extract-peptone-dextrose (YPD) media and grown overnight at 30°. Freezer stocks of rough segregants were made by mixing aliquots of these cultures with 20% glycerol solution and storing these glycerol stocks at280°.
Phenotyping at multiple temperatures
Cells from freezer stocks were inoculated into liquid YPD media, grown for 2 days at 30°, and then pinned onto three YPE plates. Each plate was incubated at a single, constant temperature: 21, 30, or 37°. The colonies were then pheno-typed after 4 days of growth and designated as belonging to one of three temperature sensitivity classes: expression of the trait at 21°only, expression of the trait at 21 and 30°only, or expression of the trait at all examined temperatures. Genetic mapping was then performed separately on each of these temperature sensitivity classes.
Genotyping of GPb and GPc rough segregants
Segregants from each temperature sensitivity class were in-oculated into liquid YPD. DNA was extracted from overnight cultures using the QIAGEN (Valencia, CA) DNeasy 96 Blood and Tissue kit. Illumina sequencing libraries were then pre-pared using the Illumina Nextera kit, with a unique pair of dual-indexed barcodes for each individual. Between 48 and 156 segregants from each combination of GP, backcross, and temperatures sensitivity were sequenced. Sequencing was performed at the Beijing Genomics Institute on an Illumina HiSeq 4000 using paired-end 1003100-bp reads. Each seg-regant was sequenced to an average per site coverage of at least 2.53. Reads were aligned to either a BY or 3S reference genome using the Burrows–Wheeler Aligner version 7 with options mem -t 20 (Li and Durbin 2009). Mpileupfiles were generated in SAMtools (Liet al.2009). Genome-wide allele frequencies were then calculated at 36,756 SNPs that had been previously identified between BY and 3S (Tayloret al. 2016). Segregants’genotypes at each SNP were determined using a hidden Markov model (HMM), implemented in the HMM package in R.
Genetic mapping of loci underlying the rough phenotype
Loci associated with the trait for each combination of GP, backcross, and temperature sensitivity were identified using binomial tests. Sites were considered statistically significant at a Bonferroni-corrected threshold of P , 0.01. Multiple-testing correction was performed on each backcross on its own, as the number of unique tests in each mapping popula-tion varied from 837 to 1526. We delimited the interval sur-rounding a locus by computing the2log10(P-value) at each linked SNP and determining the SNPs at which this statistic was 2 lower than the peak marker. These bounds were used infi ne-mapping, as well as in comparison of loci detected in different combinations of GP, backcross, and temperature sensitivity.
Testing for genotypic heterogeneity
Observed and expected two-locus genotype frequencies for each pair of SNPs were compared usingx2tests in a custom
Python script. Expected two-locus genotype frequencies were calculated as the product of the individual allele frequencies at each of the two sites. To reduce the number of statistical tests, SNPs containing the same information across all segre-gants in a given backcross population were collapsed into a single marker. The Benjamini–Hochberg method for false dis-covery rate (FDR) (Benjamini and Hochberg 1995) was then implemented using the statsmodels Python module (Seabold and Perktold 2010). A stringent FDR of 0.0001 was employed and regions of the genome within 30,000 bases of the ends of chromosomes were excluded.
Exploration of additivity and epistasis
three GPs enable trait expression, we attempted to determine the extent of additivity and epistasis among detected loci. To do this, we tested for significant differences between the expected and observed frequencies of multi-locus genotypes among loci identified using individuals that only express the trait at 21°in each backcross. Expected multi-locus genotype frequencies were calculated as the product of the individual BY or 3S allele frequencies among segregants expressing the rough phenotype in a particular backcross, while the observed frequencies were measured directly from the genotype data. For each population, observed and expected genotype fre-quencies were compared using a x2 test with d.f. equal to
one less than the number of possible genotypes. These analy-ses only included loci where both the BY and 3S allele were present among the rough segregants obtained from a back-cross population, and were only performed on backback-cross pop-ulations in which at least two detected loci segregated.
Genetic engineering at the FLO11 promoter and other loci
Gene deletions were generated using the kanMX cassette (Wachet al.1994) and lithium acetate transformation (Gietz and Woods 2002). A genomic region of interest was replaced with a PCR amplicon of thekanMXcassette that, on each end, had 60 bases of homology to the targeted gene. Transformed cells were plated on YPD + G418 to select for integration of kanMXand insertion was verified using PCR.
Allele replacements were performed using a two-step CRISPR/Cas9 approach. AkanMXdeletion strain, generated as described above, was transformed with the pML104 plas-mid (Laugheryet al.2015) carrying the Cas9 gene and a gRNA sequence targetingkanMX, along with a PCR product repair template for replacing kanMXwith the desired allele. Cells were plated on YNB plates lacking uracil to select for retention of the plasmid and then plated again onto 5-FOA to eliminate the plasmid. Replacement of thekanMXcassette was verified by PCR and Sanger sequencing, and transformants were screened on YPE to determine the phenotypic effects of allele replacement. Also, in parallel with each allele replacement, we generated control strains wherekanMXwas replaced with the original sequence at a given site. The phenotypes of allele re-placement strains were then compared to the phenotypes of these control strains that were generated in parallel. Engineer-ing of the FLO11promoter was performed in the BYx3S F2
segregant with GPb. Gene deletions and allele replacements for other genes were performed in a representative BY or 3S backcross segregant, harboring either GPb or GPc.
Data availability
All sequencing data from this project is available through the National Center for Biotechnology Information Short Read Archive. Data can be accessed under Bioproject
identi-fier PRJNA503265 and Biosample accession numbers SAMN10356503 through SAMN10357319. Supplemental material available at Figshare: https://doi.org/10.25386/ genetics.7664570.
Results
Isolation of a roughflo8Dsfl1Dsegregant
Our past work showed that expression of the rough phenotype in the BYx3S cross occurs due to genetic interactions between GPs that were not present in the cross parents, and cryptic variants that segregate in the cross and mainly reside in the Ras pathway (Taylor and Ehrenreich 2014, 2015b; Leeet al. 2016; Tayloret al.2016). To examine whether genetic var-iation beyond the Ras pathway might also be able to contrib-ute to the trait, we knocked outFLO8andSFL1in both BY and 3S using CRISPR/Cas9 (Materials and Methods). We then employed random spore techniques to generate and screen .100,000 flo8D sfl1D (GPc) cross progeny for the trait at 21°(Materials and Methods). We used this condition because the trait is less genetically complex at 21°than at higher temperatures, making it easier to screen for rough segregants (Lee et al. 2016). The GPc screen produced a single rough segregant, implying that expression of the rough phenotype in the absence ofFlo8andSfl1requires multiple alleles that segregate in the cross, some of which must be inherited from BY while others must be inherited from 3S.
The three GPs vary in their potential to express the phenotype across temperatures
In our previous work, we showed that GPa segregants typically express the trait in a temperature-sensitive manner, but that cryptic variation in the cross can eliminate this temperature sensitivity for some individuals (Leeet al.2016). Because our GPb and GPc rough segregants were both obtained at 21°, we assessed whether GPb and GPc strains also have the potential to express the trait at higher temperatures. To check this, we backcrossed GPb and GPc F2segregants to both BY and 3S, and
then phenotyped the resulting progeny at 21, 30, and 37° (Figure 1H). Note that such backcrossing can generate new genotypes that express the rough phenotype at higher temper-atures than the F2segregants recovered from initial screens.
at 21°, GPc provides an inherently limited potential for trait expression at higher temperatures. This may be becauseFlo8
andSfl1are necessary for expression of the rough phenotype at 30 and 37°.
The GPs uncover distinct loci
To map loci involved in expression of the rough phenotype across temperatures, we generated.60,000 and.12,000 GPb and GPc backcross segregants, respectively. First-gener-ation backcross segregants were used exclusively in mapping, except in the case of the 3S backcross of GPb at high temper-ature. Because expression of the rough phenotype at 30 and 37°is rare among GPbx3S backcross segregants (Figure S1), determining the genetic basis of the trait in this backcross required combining information from the first-generation backcross and a second-generation backcross. Specifically, a rough first-generation GPbx3S backcross segregant was mated to 3S (Figure S2), which increased the frequency of the trait among backcross progeny by reducing the number of segregating loci. GPb segregants were phenotyped at 21, 30 and 37°, while GPc segregants were only phenotyped at 21°. Low-coverage whole-genome sequencing was per-formed on between 48 to 151 individuals for each GP– back-cross–temperature combination, and loci associated with the trait were identified based on their enrichment among genotyped segregants (Materials and Methods).
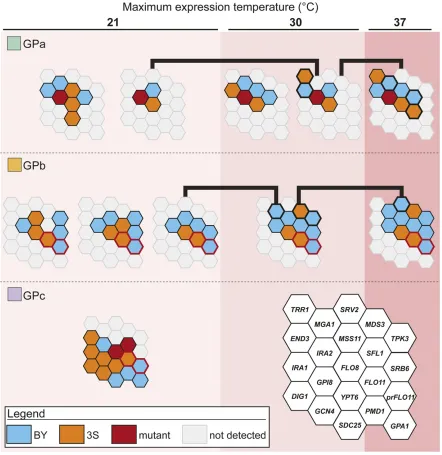
In past work, we identified eight loci that contribute to the expression of the rough colony trait in GPa segregants (Lee et al.2016) (Figure 2). These loci acted in specific combina-tions that enable segregants to express the rough phenotype at particular temperatures [figure 5 in Leeet al.(2016)]. BY and 3S contributed the causal alleles at two and four of the eight loci, respectively, while the remaining two loci were detected in both the BY and 3S allele states in different ge-notypic and temperature contexts (Figure 3). Here, genetic mapping focused on GPb segregants detected a total of 11 loci across the three environments (Figure 2, Figure S3, and Ta-ble S1). Among these loci, six and three were detected in the BY and 3S allele states, respectively (Table 1). The other two loci were identified in both the BY and 3S allele states, depending on the genotypic context in which they occurred. Eight of these loci influenced the trait’s expression indepen-dent of temperature. Of the remaining loci, two were de-tected among individuals that could express the trait at up to 30°, while the third was identified among individuals that could express the trait at up to 37°. In addition, we identified 12 loci in the presence of GPc (Figure 2, Figure S3, and Table S1). Among the loci found in the presence of GPc, seven were contributed by BY andfive were contributed by 3S (Table 1). Some of the loci detected across GPs and temperatures both overlapped and showed involvement of the same parental allele, suggesting that they correspond to the same underlying cryptic variants. Supporting this possibility, many of these loci that showed overlap also contained causal genes that we previously cloned during our work on GPa (Leeet al.2016; Tayloret al.2016; Taylor and Ehrenreich 2015b). For these
reasons, we assumed that overlapping loci represent the same cryptic variants and consolidated all detected genomic intervals into 21 distinct loci (Figure 2 and Table 1). Among these loci, one was found in the presence of all three GPs, eight were found in the presence of two GPs, and 12 were found in the presence of a single GP. This indicates that nearly all of the detected loci show differential responsive-ness to the GPs and that the majority of the loci we have identified reflect cryptic variants that only act in the presence of specific GPs.
The GPs alter genetic and genotype– environment interactions
We assessed how identified loci interact with particular GPs, each other, and temperature to produce the rough phenotype. Given that we performed such an analysis on GPa in the past (Lee et al.2016) and GPc segregants can only express the trait at 21°, we focused this analysis on GPb. Note, our past work on GPa found that at particular levels of temperature sensitivity, distinct sets of epistatic cryptic variants form multi-locus genotypes that produce the phenotype (Lee et al.2016). For example, at 30°, two distinct combinations of four andfive cryptic variants act in conjunction with GPa to cause the trait’s expression (Figure 3).
Examination offirst-generation GPb backcross segregants produced results comparable to ourfindings for GPa. Among GPb segregants expressing the trait exclusively at 21°, we detected a pair of interacting loci on chromosomes XIII and XV, which then allowed us to identify specific allele combi-nations present among these individuals (Figure 3, Figure S4, and Note S1,Materials and Methods). Similar to our work on GPa (Lee et al. 2016), only one of the GPb combinations found at 21°provided a foundation upon which additional allele substitutions facilitate trait expression at higher tem-peratures (Figure 3, black lines). Among these GPb segre-gants exhibiting the trait at higher temperatures, single multi-locus genotypes indicative of higher-order epistasis caused trait expression at temperatures up to 30 and 37° (Figure 3). Comparison of our results for GPb with our past work on GPa found that more than one-half of the loci and the exact allele combinations differed between the two GPs (Figure 3). These results show that the GPs significantly mod-ify the genetic and genotype–environment interactions un-derlying the rough phenotype.
The GPs affect additivity and epistasis within a common environment
individual allele involved in a multi-locus genotype. In con-trast, if epistasis meaningfully contributes to the trait, observed multi-locus genotype frequencies should de-part from expected multi-locus genotype frequencies. Based on these tests, we observed significant deviation from expected frequencies for GPa (Figure 4A) and GPb (Figure 4B), confirming that epistasis plays a significant role in the trait in the presence of these GPs. However, data for GPc suggested that trait expression in the presence of this GP is entirely additive (Figure 4C). Thesefindings imply that al-though the three GPs in this study can each enable expression of the same rough phenotype, they do so not only through largely distinct cryptic variants but also through fundamen-tally different quantitative genetic architectures.
Coding and regulatory variation in FLO11 plays an essential role in the trait
Only a single locus exhibited a phenotypic effect in the pres-ence of all three GPs. This locus corresponds to the 3S allele of theFLO11coding region (Leeet al.2016). The BY and 3S alleles ofFLO11possess 57 synonymous and 29 nonsynony-mous SNP differences, as well as a length polymorphism of
581 nucleotides (Figure S5). The 3S allele of Flo11 pro-duces a longer protein that should aid in the expression of cell-cell and cell-surface adhesion traits in yeast (Verstrepen et al.2005; Fidalgoet al.2006, 2008; Zaraet al.2009; Hope and Dunham 2014; Matsuiet al.2015). Although this length polymorphism is likely causal for the trait, we cannot rule out the possibility that some of the SNPs also play a role.
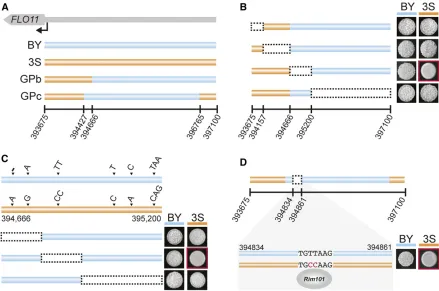
In addition to being a component of GPb, we found that the BY allele of theFLO11promoter is necessary for GPc
segre-gants to express the trait (Figure 3 and Table 1).FLO11has one of the largest and most complex promoters inS. cerevi-siae, with.17 transcription factors and 6 signaling cascades capable of influencing its regulation (Brückner and Mösch 2012). Through genetic engineering experiments, we local-ized the causal variant in theFLO11promoter to a Rim101-binding site that is present in 3S but not BY (Figure 5). This
finding is consistent with the important role that transcrip-tional derepression ofFLO11plays in expression of the rough phenotype (Taylor and Ehrenreich 2015b; Taylor et al. 2016). We note that although Rim101 has been described as aFLO11activator in other strains ofS. cerevisiae, this role is indirect and mediated through its role in silencingNRG1
(Kuchinet al.2002; Lamb and Mitchell 2003; Barraleset al. 2008), which encodes a repressor that directly binds the
FLO11promoter. TheRim101-binding site in the 3SFLO11
promoter most likely results in direct repression ofFLO11by
Rim101, which reinforces Sfl1-mediated repression. These
findings not only speak of the critical role ofFlo11in expres-sion of the rough phenotype in the BYx3S cross, but also illustrate how regulation of this gene by multiple pathways determines the phenotypic effects of cryptic variation.
GPa and GPb rough segregants utilize different subpathways that impact Ras
other GPs in previous papers, in which they were mapped to individual genes (Leeet al.2016; Tayloret al.2016) (Table 1). These genes encode Ras-regulated transcription factors (FLO8,MSS11,MGA1, andSFL1), a protein kinase A subunit (TPK3), a target or rapamycin (TOR) pathway component (MDS3), andIRA2. Two of the loci found in the current study among GPb segregants were located on chromosomes II and XIV, and had never been detected in our past work (Figure 2 and Table 1). Through genetic engineering experiments, we resolved the chromosome XIV locus to SRV2 (Figure S6), which encodes a post-translational activator of adenylate
cy-clase, another component of the Ras pathway. At the chro-mosome II locus, the most likely candidate is SRB6, which encodes an essential subunit of the RNA polymerase II medi-ator complex. Previously, we showed that mutations disrupt-ing other mediator components, Srb10and Srb11 (also known asSsn3andSsn8, respectively), can induce the rough phenotype by interacting with a subset of the alleles that have a phenotypic effect in the presence of GPa (Tayloret al.2016) (Note S2).
GPs, some are specific to one or the other. Among these are
TRR1andEND3, which were detected in GPa segregants but not GPb segregants, as well as MDS3, SRV2, and TPK3, which were identified in GPb segregants but not GPa segre-gants. Notably, these genes play a role in activating the Ras pathway through oxidative stress and actin organization (Figure 6). Actin cytoskeleton stability is required for cell polarity and yeast adhesion traits, and is regulated in part by the effects of End3 and Srv2 on Ras signaling (Du and Ayscough 2009). This process results in increased produc-tion of reactive oxygen species (ROS) through the activity of
Tpk3(Gourlay and Ayscough 2006). ROS accumulation is then influenced by Trr1 (Charizanis et al. 1999) and the TOR pathway, of which Mds3 is a component. Together,
Mds3,Srv2, andTpk3 form a well-described subpathway that affects Ras activity (Gourlay and Ayscough 2006; Du and Ayscough 2009). Thus, although different loci cause the trait in the presence of GPa and GPb, they appear to reflect distinct subpathways affecting the same cellular processes, which ultimately impact how Ras-regulated transcription factors influenceFLO11expression.
Cryptic variation in several pathways underlies the phenotype in GPc segregants
Lastly, we sought to determine the genes harboring cryptic variants that interact with GPc. Regarding GPc, 3 of the 10 identified loci also interact with either GPa or GPb. These loci correspond toEND3,IRA2, and a locus on chromosome XII. For chromosome XII and the remaining seven loci, we identified likely candidate genes based on our highly resolved genetic mapping data, and publicly available research on these genes’functions and phenotypic effects. One of these
loci corresponds to IRA1, a Ras negative regulator and paralog of IRA2, which we previously showed can uncover the rough phenotype when mutated (Tayloret al.2016) (Ta-ble 1). To obtain additional support for the remaining loci, we performed gene deletions and allele replacements on the identified candidate genes in a GPc rough segregant and de-termined the resulting effects on the colony trait (Materials and Methods). Knockout and replacement of PMD1, GPA1,
SDC25,GPI8,GCN4, andYPT6resulted in loss of the pheno-type (Figure S7, a and b), implying that these six genes play positive roles in the trait’s regulation. In contrast, deletion of DIG1, a protein that directly inhibits the transcriptional activator Ste12, enhanced the trait’s expression (Figure S7, a and c). These results suggest that genetic variation in these genes plays a causal role in the rough phenotype.
Detection ofEND3,IRA1, andIRA2, in the absence ofFlo8
andSfl1, indicates that the Ras pathway still contributes to
FLO11 regulation when these transcription factors are not present, possibly by impacting the activities of other tran-scription factors (Estruch 2000). The remaining loci impli-cate alternative signaling pathways as playing a role in trait expression in GPc segregants. The genes we identified in the other intervals as having a phenotypic effect when knocked out were: a TOR pathway component and MDS3 paralog (PMD1); members of the MAPK signaling cascade (DIG1
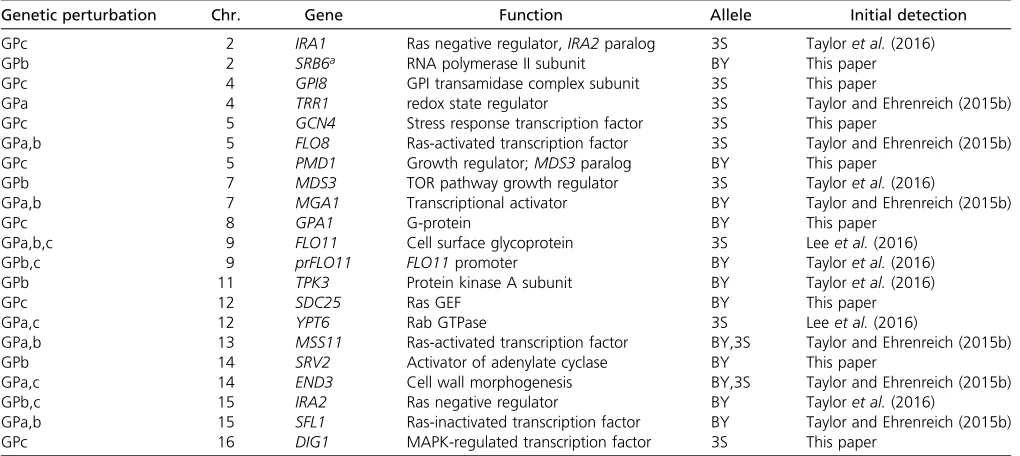
and GPA1) (Metodiev et al.2002); an environmentally re-sponsive transcriptional activator (GCN4); a Rab GTPase that influences Ras (Costanzoet al.2010), MAPK (Costanzoet al. 2016), andRim101(Zhenget al.2010) signaling (YPT6); a stress-responsive guanine exchange factor (SDC25); and an enzyme that post-translationally modifies proteins to help them anchor into the cell wall (GPI8). Of particular note for Table 1 Candidate genes and cloned causal genes underlying identified loci
Genetic perturbation Chr. Gene Function Allele Initial detection
GPc 2 IRA1 Ras negative regulator,IRA2paralog 3S Tayloret al.(2016)
GPb 2 SRB6a RNA polymerase II subunit BY This paper
GPc 4 GPI8 GPI transamidase complex subunit 3S This paper
GPa 4 TRR1 redox state regulator 3S Taylor and Ehrenreich (2015b)
GPc 5 GCN4 Stress response transcription factor 3S This paper
GPa,b 5 FLO8 Ras-activated transcription factor 3S Taylor and Ehrenreich (2015b)
GPc 5 PMD1 Growth regulator;MDS3paralog BY This paper
GPb 7 MDS3 TOR pathway growth regulator 3S Tayloret al.(2016)
GPa,b 7 MGA1 Transcriptional activator BY Taylor and Ehrenreich (2015b)
GPc 8 GPA1 G-protein BY This paper
GPa,b,c 9 FLO11 Cell surface glycoprotein 3S Leeet al.(2016)
GPb,c 9 prFLO11 FLO11promoter BY Tayloret al.(2016)
GPb 11 TPK3 Protein kinase A subunit BY Tayloret al.(2016)
GPc 12 SDC25 Ras GEF BY This paper
GPa,c 12 YPT6 Rab GTPase 3S Leeet al.(2016)
GPa,b 13 MSS11 Ras-activated transcription factor BY,3S Taylor and Ehrenreich (2015b)
GPb 14 SRV2 Activator of adenylate cyclase BY This paper
GPa,c 14 END3 Cell wall morphogenesis BY,3S Taylor and Ehrenreich (2015b)
GPb,c 15 IRA2 Ras negative regulator BY Tayloret al.(2016)
GPa,b 15 SFL1 Ras-inactivated transcription factor BY Taylor and Ehrenreich (2015b)
GPc 16 DIG1 MAPK-regulated transcription factor 3S This paper
Chr., chromosome; GP, genetic perturbation; 3S, derivative of clinical isolate 322134S; BY, laboratory strain BY4716; GPI, glycosylphosphatidylinositol; TOR, target of rapamycin.
GPA1, the BY strain is known to carry a laboratory-derived allele that is an expression QTL hotspot (Yvertet al.2003), supporting the possibility thatGPA1 allele state might also impact expression of the rough phenotype in the presence of GPc. Additionally,GPA1BYwas previously shown to influence
otherFLO11-dependent traits through its downstream tran-scriptional activatorSte12(Matsuiet al.2015). Nearly all of the genes implicated in allowing GPc segregants to express the rough phenotype have the potential to influence, either directly or indirectly,FLO11transcription. The lone exception isGPI8, which could still influenceFlo11at the protein level, as it is responsible for adding glycosylphosphatidylinositol anchors to new proteins and could affectFlo11’s binding to
the cell surface (Benghezalet al.1996). These results show the abundant cryptic variation that impacts regulation of
FLO11and the rough phenotype.
Discussion
To better understand the extent of cryptic variation within a population, as well as the mechanisms regulating this cryptic variation, we comprehensively determined the genetic basis of a model phenotype that is only expressed in the presence of particular GPs. By doing this, we identified 21 loci harboring cryptic variants that can contribute to the rough phenotype. Notably, all but one of these loci show phenotypic effects that Figure 4 The GPs impact additivity and epistasis among loci detected in 3S backcrosses. Only individuals that exclusively express the trait 21°were included in this analysis. In the GPa (a) and GPb (b) backcrosses, observed multi-locus genotype frequencies do not match expected frequencies, suggesting that the involved loci show epistasis. In contrast, in the GPc backcross (c), observed multi-locus genotype frequencies closely match expected frequencies, suggesting that involved loci act in an additive manner. In all cases, expected genotype frequencies are computed as the product of the frequency of the involved alleles.P-values correspond to results of ax2test with d.f. indicated in thefigure. Loci for which only a single allele is present in
depend on the GP that is present. In addition, because the cryptic variants that are uncovered by each GP vary in their degree of epistasis with each other and interaction with the environment, wefind that the trait’s genetic architecture sig-nificantly differs across the GPs. This results in a multitude of genotype, environment, and phenotype relationships that produce the same trait.
Given the detailed understanding that we have obtained for the colony morphology system, a major question is how might ourfindings relate to other traits and species? One major insight from our study that may apply to other systems is that most, if not nearly all, of our findings connect to the transcriptional regulation of a single key gene,FLO11. Supporting this point, the single locus common to all three GPs is the coding region of
FLO11, suggesting that regulation ofFlo11levels and stability is the central determinant of the rough phenotype’s expression across GPs, combinations of segregating loci, and temperature. Bolstering the importance of variability inFLO11regulation to our findings, most of the loci that exhibit phenotypic effects influenceFLO11intrans. Moreover, many of these loci are only visible in the absence of a repressive Rim101-binding site in the
FLO11promoter. Thus, our results also highlight the potentially important role thatcis-regulatory polymorphisms can play in
enablingtrans-regulatory polymorphisms to exert phenotypic effects. Indeed,cis-regulatory polymorphisms have been shown to modify the effects oftransvariants in other systems (Reddy et al.2012; Wonget al.2017), thereby altering how genetic differences impact traits (Payne and Wagner 2014).
In addition to showing that different GPs enable distinct cryptic variants to have phenotypic effects, we also demon-strated that the GPs modify how genotype–environment in-teractions influence the trait. For both GPa and GPb, wefind that certain combinations of epistatic alleles enable expres-sion of the trait at a permissive temperature of 21°, as well as provide the genetic potential for the phenotype at higher temperatures. However, different loci and multi-locus geno-types allow GPa and GPb segregants to express the trait at higher temperatures. In contrast, GPc individuals are unable to express the phenotype at temperatures above 21°, imply-ing that their potential to express the trait across environ-ments is constrained. These findings support the concept that not all genotypes specifying the same trait possess com-parable environmental robustness (Wagner 2012; Payne et al. 2014; Pfennig and Ehrenreich 2014; Siegal and Leu 2014; Ehrenreich and Pfennig 2016). In the case of the rough phenotype, our genetic mapping and genetic engineering Figure 5 A transcription factor-binding site polymorphism is required for GPb and GPc rough segregants to express the trait. (a) The GPb and GPc
results imply that differences in environmental robustness relate to changes in signaling and transcription factor activity across multiple pathways and subpathways influencingFLO11. Furthermore, whereas the rough phenotype in GPa and GPb segregants involves complex epistatic effects, wefind no evidence for epistasis in GPc rough segregants. This implies that by eliminating Flo8andSfl1, the main transcriptional regulators ofFLO11, we not only uncovered a previously un-detected set of cryptic variants but also converted the trait’s genetic architecture from mainly epistatic to additive. Per-haps this additivity at the phenotypic level reflects the cumu-lative effect of multiple pathways influencing FLO11
expression at the molecular level. While the majority of the loci that interact with GPa and GPb correspond to compo-nents of the Ras pathway, many of the loci found in the pres-ence of GPc are involved in other signaling pathways that may have compensatory functions (Figure 6). This is consis-tent with the idea that eliminatingFlo8andSfl1might enable other pathways to play a stronger role in the expression of
FLO11and the rough colony phenotype.
Our results also provide valuable insights into genetic background effects, the phenomenon in which GPs show different phenotypic effects in distinct individuals (Nadeau 2001; Chandleret al.2013; Ehrenreich 2017). A number of recent studies have shown that these background effects often result from higher-order epistasis between a GP and multiple segregating loci (Chandleret al.2014; Taylor and Ehrenreich 2014, 2015a,b; Miotto et al. 2015; Lee et al. 2016; Kuzmin et al.2018; Mulliset al.2018). Despite sup-porting an important role for higher-order epistasis in back-ground effects, our current work, in particular on GPc, also shows that background effects can have much simpler under-pinnings. In the context of GPc, identified loci each show pairwise epistasis with the GP, but exhibit no epistasis with each other and thus appear to act additively. These differ-ences in quantitative genetic architecture again appear to tie back to FLO11 regulation, consistent with theoretical work suggesting that how GPs affect transcriptional regula-tion can impact whether loci show additive or epistatic effects (Gjuvslandet al.2007).
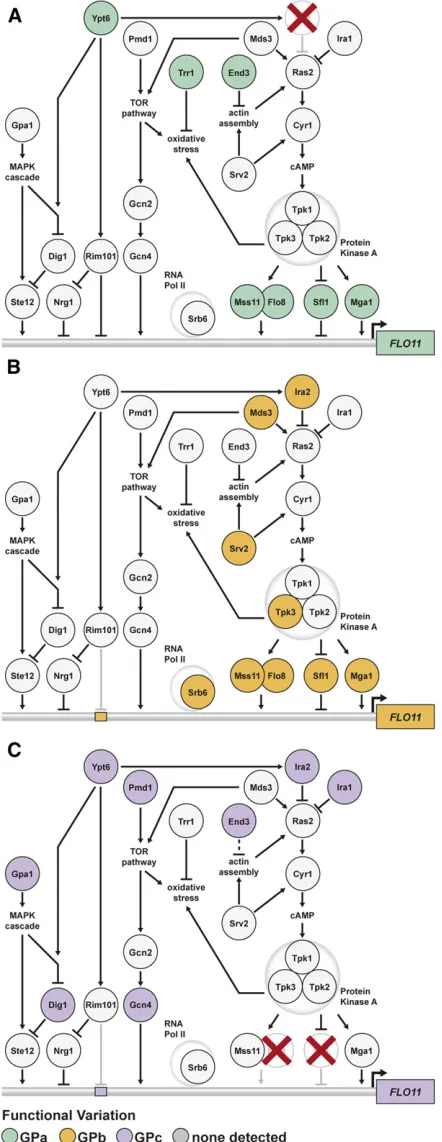
In summary, our study demonstrates the large amount of cryptic variation that can underlie a single phenotype and strongly implicates multifactorial changes in transcription as a mechanism regulating this cryptic variation. Further, these results suggest a broader insight into the genetic architecture of complex traits. Although it has long been known that traits can vary in genetic architecture depending on the different populations and environments in which they are measured, our findings illustrate that even the same phenotype examined within a single population can exhibit a spectrum of genetic architectures. As shown by the GPs in our study, which of these architectures is visible may depend on only one or two alleles that modify how the rest of the genetic variation in the population behaves. This suggests that characterizing the molecular mechanisms that shape genetic architecture will be an important step in improving Figure 6 GPs unmask cryptic variation in parallel signaling pathways and
subpathways. (a) Loci that interact with GPa influenceFLO11regulation by the Ras pathway. (b) GPb uncovers loci that primarily act through a different Ras subpathway involving Mds3, Srv2, and Tpk3. (c) Loci inter-acting with GPc function in a number of different pathways that are capable of regulatingFLO11activity. The locations of transcription fac-tor-binding sites are not intended to reflect specific positioning along the
our basic understanding of the relationship between geno-type and phenogeno-type.
Acknowledgments
We thank Joseph Hale, Takeshi Matsui, Martin Mullis, Joann Phan, Rachel Schell, Fabian Seidl, Matthew Taylor, and Gleidson Teixeira for valuable input regarding this project or manuscript, as well as the anonymous reviewers of this paper for their helpful feedback. The work reported in this paper was supported by grants R01 GM-110255 and R35 GM130381 from the National Institutes of Health to I.M.E., a fellowship from the Alfred P. Sloan Foundation to I.M.E., and fellowship 2016/21176-8 from the São Paulo Research Foundation to A.L.V.C.
Literature Cited
Atwell, S., Y. S. Huang, B. J. Vilhjalmsson, G. Willems, M. Horton et al., 2010 Genome-wide association study of 107 phenotypes in Arabidopsis thaliana inbred lines. Nature 465: 627–631.
https://doi.org/10.1038/nature08800
Aylor, D. L., W. Valdar, W. Foulds-Mathes, R. J. Buus, R. A. Verdugo et al., 2011 Genetic analysis of complex traits in the emerging Collaborative Cross. Genome Res. 21: 1213–1222.https://doi. org/10.1101/gr.111310.110
Barrales, R. R., J. Jimenez, and J. I. Ibeas, 2008 Identification of novel activation mechanisms for FLO11 regulation in Saccharo-myces cerevisiae. Genetics 178: 145–156. https://doi.org/ 10.1534/genetics.107.081315
Benghezal, M., A. Benachour, S. Rusconi, M. Aebi, and A. Conzel-mann, 1996 Yeast Gpi8p is essential for GPI anchor attach-ment onto proteins. EMBO J. 15: 6575–6583.https://doi.org/ 10.1002/j.1460-2075.1996.tb01048.x
Benjamini, Y., and Y. Hochberg, 1995 Controlling the false discovery rate: a practical and powerful approach to multiple testing. J. R. Stat. Soc. B 57: 289–300.
Bergman, A., and M. L. Siegal, 2003 Evolutionary capacitance as a general feature of complex gene networks. Nature 424: 549– 552.https://doi.org/10.1038/nature01765
Bloom, J. S., I. M. Ehrenreich, W. T. Loo, T. L. Lite, and L. Kruglyak, 2013 Finding the sources of missing heritability in a yeast cross. Nature 494: 234–237.https://doi.org/10.1038/nature11867
Brückner, S., and H. U. Mösch, 2012 Choosing the right lifestyle: adhesion and development in Saccharomyces cerevisiae. FEMS Microbiol. Rev. 36: 25–58. https://doi.org/10.1111/j.1574-6976.2011.00275.x
Chandler, C. H., S. Chari, and I. Dworkin, 2013 Does your gene need a background check? How genetic background impacts the analysis of mutations, genes, and evolution. Trends Genet. 29: 358–366.https://doi.org/10.1016/j.tig.2013.01.009
Chandler, C. H., S. Chari, D. Tack, and I. Dworkin, 2014 Causes and consequences of genetic background effects illuminated by integrative genomic analysis. Genetics 196: 1321–1336.
https://doi.org/10.1534/genetics.113.159426
Charizanis, C., H. Juhnke, B. Krems, and K. D. Entian, 1999 The oxidative stress response mediated via Pos9/Skn7 is negatively regulated by the Ras/PKA pathway in Saccharomyces cerevisiae. Mol. Gen. Genet. 261: 740–752.https://doi.org/10.1007/ s004380050017
Costanzo, M., A. Baryshnikova, J. Bellay, Y. Kim, E. D. Spearet al., 2010 The genetic landscape of a cell. Science 327: 425–431.
https://doi.org/10.1126/science.1180823
Costanzo, M., B. VanderSluis, E. N. Koch, A. Baryshnikova, C. Pons et al., 2016 A global genetic interaction network maps a wiring diagram of cellular function. Science 353: aaf1420
Du, W., and K. R. Ayscough, 2009 Methyl beta-cyclodextrin re-duces accumulation of reactive oxygen species and cell death in yeast. Free Radic. Biol. Med. 46: 1478–1487.https://doi.org/ 10.1016/j.freeradbiomed.2009.02.032
Dworkin, I., A. Palsson, K. Birdsall, and G. Gibson, 2003 Evidence that Egfr contributes to cryptic genetic variation for photorecep-tor determination in natural populations of Drosophila mela-nogaster. Curr. Biol. 13: 1888–1893. https://doi.org/10.1016/ j.cub.2003.10.001
Ehrenreich, I. M., 2017 Epistasis: searching for interacting genetic variants using crosses. Genetics 206: 531–535.https://doi.org/ 10.1534/genetics.117.203059
Ehrenreich, I. M., and D. W. Pfennig, 2016 Genetic assimilation: a review of its potential proximate causes and evolutionary conse-quences. Ann. Bot. 117: 769–779. https://doi.org/10.1093/aob/ mcv130
Estruch, F., 2000 Stress-controlled transcription factors, stress-induced genes and stress tolerance in budding yeast. FEMS Microbiol. Rev. 24: 469–486. https://doi.org/ 10.1111/j.1574-6976.2000.tb00551.x
Fidalgo, M., R. R. Barrales, J. I. Ibeas, and J. Jimenez, 2006 Adaptive evolution by mutations in the FLO11 gene. Proc. Natl. Acad. Sci. USA 103: 11228–11233. https://doi. org/10.1073/pnas.0601713103
Fidalgo, M., R. R. Barrales, and J. Jimenez, 2008 Coding repeat instability in the FLO11 gene of Saccharomyces yeasts. Yeast 25: 879–889.https://doi.org/10.1002/yea.1642
Geiler-Samerotte, K. A., Y. O. Zhu, B. E. Goulet, D. W. Hall, and M. L. Siegal, 2016 Selection transforms the landscape of genetic variation interacting with Hsp90. PLoS Biol. 14: e2000465.
https://doi.org/10.1371/journal.pbio.2000465
Gibson, G., and I. Dworkin, 2004 Uncovering cryptic genetic variation. Nat. Rev. Genet. 5: 681–690.https://doi.org/10.1038/nrg1426
Gietz, R. D., and R. A. Woods, 2002 Transformation of yeast by lithium acetate/single-stranded carrier DNA/polyethylene gly-col method. Methods Enzymol. 350: 87–96. https://doi.org/ 10.1016/S0076-6879(02)50957-5
Gjuvsland, A. B., B. J. Hayes, S. W. Omholt, and O. Carlborg, 2007 Statistical epistasis is a generic feature of gene regula-tory networks. Genetics 175: 411–420. https://doi.org/ 10.1534/genetics.106.058859
Gourlay, C. W., and K. R. Ayscough, 2006 Actin-induced hyper-activation of the Ras signaling pathway leads to apoptosis in Saccharomyces cerevisiae. Mol. Cell. Biol. 26: 6487–6501.
https://doi.org/10.1128/MCB.00117-06
Hope, E. A., and M. J. Dunham, 2014 Ploidy-regulated variation in biofilm-related phenotypes in natural isolates of Saccharomy-ces cerevisiae. G3 (Bethesda) 4: 1773–1786. https://doi.org/ 10.1534/g3.114.013250
Jarosz, D. F., and S. Lindquist, 2010 Hsp90 and environmental stress transform the adaptive value of natural genetic variation. Science 330: 1820–1824. https://doi.org/10.1126/sci-ence.1195487
Kuchin, S., V. K. Vyas, and M. Carlson, 2002 Snf1 protein kinase and the repressors Nrg1 and Nrg2 regulate FLO11, haploid invasive growth, and diploid pseudohyphal differentiation. Mol. Cell. Biol. 22: 3994–4000.https://doi.org/10.1128/ MCB.22.12.3994-4000.2002
Kuzmin, E., B. VanderSluis, W. Wang, G. Tan, R. Deshpandeet al., 2018 Systematic analysis of complex genetic interactions. Sci-ence 360: eaao1729.https://doi.org/10.1126/science.aao1729
Saccha-romyces cerevisiae. Mol. Cell. Biol. 23: 677–686. https://doi. org/10.1128/MCB.23.2.677-686.2003
Laughery, M. F., T. Hunter, A. Brown, J. Hoopes, T. Ostbyeet al., 2015 New vectors for simple and streamlined CRISPR-Cas9 genome editing in Saccharomyces cerevisiae. Yeast 32: 711– 720.https://doi.org/10.1002/yea.3098
Le Rouzic, A., and O. Carlborg, 2008 Evolutionary potential of hidden genetic variation. Trends Ecol. Evol. 23: 33–37.
https://doi.org/10.1016/j.tree.2007.09.014
Lee, J. T., M. B. Taylor, A. Shen, and I. M. Ehrenreich, 2016 Multi-locus genotypes underlying temperature sensitivity in a muta-tionally induced trait. PLoS Genet. 12: e1005929. https://doi. org/10.1371/journal.pgen.1005929
Li, H., and R. Durbin, 2009 Fast and accurate short read align-ment with Burrows-Wheeler transform. Bioinformatics 25: 1754–1760.https://doi.org/10.1093/bioinformatics/btp324
Li, H., B. Handsaker, A. Wysoker, T. Fennell, J. Ruan et al., 2009 The sequence alignment/map format and SAMtools. Bio informatics 25: 2078–2079. https://doi.org/10.1093/bioinfor-matics/btp352
Lo, W. S., and A. M. Dranginis, 1996 FLO11, a yeast gene related to the STA genes, encodes a novel cell surface flocculin. J. Bacteriol. 178: 7144–7151. https://doi.org/10.1128/ jb.178.24.7144-7151.1996
Mackay, T. F., S. Richards, E. A. Stone, A. Barbadilla, J. F. Ayroleset al., 2012 The Drosophila melanogaster genetic reference panel. Na-ture 482: 173–178.https://doi.org/10.1038/nature10811
Matsui, T., R. Linder, J. Phan, F. Seidl, and I. M. Ehrenreich, 2015 Regulatory rewiring in a cross causes extensive genetic heterogeneity. Genetics 201: 769–777. https://doi.org/ 10.1534/genetics.115.180661
McGuigan, K., and C. M. Sgro, 2009 Evolutionary consequences of cryptic genetic variation. Trends Ecol. Evol. 24: 305–311.
https://doi.org/10.1016/j.tree.2009.02.001
Metodiev, M. V., D. Matheos, M. D. Rose, and D. E. Stone, 2002 Regulation of MAPK function by direct interaction with the mating-specific Galpha in yeast. Science 296: 1483–1486.
https://doi.org/10.1126/science.1070540
Miotto, O., R. Amato, E. A. Ashley, B. MacInnis, J. Almagro-Garcia et al., 2015 Genetic architecture of artemisinin-resistant Plas-modium falciparum. Nat. Genet. 47: 226–234.https://doi.org/ 10.1038/ng.3189
Mullis, M. N., T. Matsui, R. Schell, R. Foree, and I. M. Ehrenreich, 2018 The complex underpinnings of genetic background ef-fects. Nat. Commun. 9: 3548. https://doi.org/10.1038/ s41467-018-06023-5
Nadeau, J. H., 2001 Modifier genes in mice and humans. Nat. Rev. Genet. 2: 165–174.https://doi.org/10.1038/35056009
Paaby, A. B., and M. V. Rockman, 2014 Cryptic genetic variation: evolution’s hidden substrate. Nat. Rev. Genet. 15: 247–258.
https://doi.org/10.1038/nrg3688
Payne, J. L., and A. Wagner, 2014 The robustness and evolvability of transcription factor binding sites. Science 343: 875–877.
https://doi.org/10.1126/science.1249046
Payne, J. L., J. H. Moore, and A. Wagner, 2014 Robustness, evolv-ability, and the logic of genetic regulation. Artif. Life 20: 111– 126.https://doi.org/10.1162/ARTL_a_00099
Pfennig, D. W., and I. M. Ehrenreich, 2014 Towards a gene reg-ulatory network perspective on phenotypic plasticity, genetic accommodation and genetic assimilation. Mol. Ecol. 23: 4438– 4440.https://doi.org/10.1111/mec.12887
Queitsch, C., T. A. Sangster, and S. Lindquist, 2002 Hsp90 as a capacitor of phenotypic variation. Nature 417: 618–624.
https://doi.org/10.1038/nature749
Reddy, T. E., J. Gertz, F. Pauli, K. S. Kucera, K. E. Varley et al., 2012 Effects of sequence variation on differential allelic tran-scription factor occupancy and gene expression. Genome Res. 22: 860–869.https://doi.org/10.1101/gr.131201.111
Rutherford, S. L., and S. Lindquist, 1998 Hsp90 as a capacitor for morphological evolution. Nature 396: 336–342. https://doi. org/10.1038/24550
Seabold, S., and J. Perktold, 2010 Statsmodels: econometric and statistical modeling with Python. Proceedings of the 9th Python in Science Conference, Austin, TX, pp. 57–61.
Siegal, M. L., and J. Y. Leu, 2014 On the nature and evolutionary impact of phenotypic robustness mechanisms. Annu. Rev. Ecol. Evol. Syst. 45: 496–517. https://doi.org/10.1146/annurev-ecolsys-120213-091705
Taylor, M. B., and I. M. Ehrenreich, 2014 Genetic interactions involving five or more genes contribute to a complex trait in yeast. PLoS Genet. 10: e1004324. https://doi.org/10.1371/ journal.pgen.1004324
Taylor, M. B., and I. M. Ehrenreich, 2015a Higher-order genetic interactions and their contribution to complex traits. Trends Genet. 31: 34–40.https://doi.org/10.1016/j.tig.2014.09.001
Taylor, M. B., and I. M. Ehrenreich, 2015b Transcriptional dere-pression uncovers cryptic higher-order genetic interactions. PLoS Genet. 11: e1005606. https://doi.org/10.1371/journal. pgen.1005606
Taylor, M. B., J. Phan, J. T. Lee, M. McCadden, and I. M. Ehrenreich, 2016 Diverse genetic architectures lead to the same cryptic phenotype in a yeast cross. Nat. Commun. 7: 11669.https:// doi.org/10.1038/ncomms11669
Tong, A. H., M. Evangelista, A. B. Parsons, H. Xu, G. D. Baderet al., 2001 Systematic genetic analysis with ordered arrays of yeast deletion mutants. Science 294: 2364–2368. https://doi.org/ 10.1126/science.1065810
Verstrepen, K. J., A. Jansen, F. Lewitter, and G. R. Fink, 2005 Intragenic tandem repeats generate functional variability. Nat. Genet. 37: 986–990.https://doi.org/10.1038/ng1618
Wach, A., A. Brachat, R. Pohlmann, and P. Philippsen, 1994 New heterologous modules for classical or PCR-based gene disrup-tions in Saccharomyces cerevisiae. Yeast 10: 1793–1808.
https://doi.org/10.1002/yea.320101310
Wagner, A., 2012 The role of robustness in phenotypic adaptation and innovation. Proc. Biol. Sci. 279: 1249–1258. https://doi. org/10.1098/rspb.2011.2293
Wong, E. S., B. M. Schmitt, A. Kazachenka, D. Thybert, A. Redmond et al., 2017 Interplay of cis and trans mechanisms driving tran-scription factor binding and gene expression evolution. Nat. Commun. 8: 1092. https://doi.org/10.1038/s41467-017-01037-x
Yvert, G., R. B. Brem, J. Whittle, J. M. Akey, E. Foss et al., 2003 Trans-acting regulatory variation in Saccharomyces cer-evisiae and the role of transcription factors. Nat. Genet. 35: 57– 64.https://doi.org/10.1038/ng1222
Zara, G., S. Zara, C. Pinna, S. Marceddu, and M. Budroni, 2009 FLO11 gene length and transcriptional level affect bio-film-forming ability of wildflor strains of Saccharomyces cere-visiae. Microbiology 155: 3838–3846.https://doi.org/10.1099/ mic.0.028738-0
Zheng, J., J. J. Benschop, M. Shales, P. Kemmeren, J. Greenblatt et al., 2010 Epistatic relationships reveal the functional orga-nization of yeast transcription factors. Mol. Syst. Biol. 6: 420.
https://doi.org/10.1038/msb.2010.77