International Journal of Innovative Research in Science, Engineering and Technology
An ISO 3297: 2007 Certified Organization Volume 6, Special Issue 5, March 2017
National Conference on Advanced Computing, Communication and Electrical Systems - (NCACCES'17) 24th - 25th March 2017
Organized by
C. H. Mohammed Koya
KMEA Engineering College, Kerala- 683561, India
Integrated MFCC-FBCC features for dialect
Identification in Malayalam language
Reshma Vijayan1, Riyas K S2
.M Tech Student, Dept. of Electronics and Communication Engineering, Govt Engineering College, Wayanad, India 1
Assistant Professor, Dept. of Electronics and Communication Engineering, Rajiv Gandhi Institute of Technology,
Kirumambakkam, Tamil Nadu, India2
ABSTRACT: Malayalam referred as Kairali, is a classical language in India, mainly in the state of Kerala.There are fourteen different dialect varities for Malayalam language with different speaker population. Dialects of a given language is the variation in the speaking styles due to regional, geographic, and ethnic variations of speakers. This paper presents a Malayalam dialect identification system for identifying the dialects of different areas of Kerala. The Dialect corpora for this work are collected from Malappuram, Kannur and Thrissur. Primary step in dialect identification is the extraction of dialect specific information lie in different levels of speech signal. Existing methods use Mel frequency cepstral coefficients(MFCC),Linear predictive cepstral coefficient(LPCC) etc as features. Due to the quasi stationary nature of the speech signal, better representation of speech is done by damped sinusoidal basis function rather than sinusoidals. Bessel functions have damped sinusoidals as basis function, so it is the most effective way for representing speech signal.In this proposed work, bessel features like Fourier bessel cepstral coefficients (FBCC) obtained from speech signal are used for dialect identification. By integrating FBCCs and MFCCs, a new representation of feature set is utilised for enhancing the performance of the system. The feature vector set thus obtained are classified in the classification phase using Artificial Neural Networks (ANN) and Support Vector Machine (SVM). The proposed system is tested over the Dialect corpora which results in an efficiency of 97% which are found to be dominating the system that uses MFCC alone.
KEYWORDS: Dialect identification, FBCC , MFCC, Artificial Neural Network, Support Vector Machine
I. INTRODUCTION
Speech is the regular method of communication among individuals. Due to geographical, regional and ethnic differ-ences among people there will be differdiffer-ences in the talking style of a specific language. The variation in the talking style of a specific language is referred as the dialect. Malayalam which belongs to Dravidian family of language is one of such language that has different dialectal varities. It is one of the classical language in India and is largely spoken in Kerala.There are fourteen distinguishable dialect varities for Malayalam language. Among them the dominant dialect varities are from the area Kannur, Malappuram and Thrissur. The mode of presentation of the same matter in these area largely differ due to ethnic, geographical and regional differences.
In speech signal, dialect specific information is embedded in different levels, segmental, sub segmental and supra segmental[1]. In segmental level, dialectal informations are obtained from the spectral envelope which characterizes the shape of the vocal tract. Since the shape of the vocal tract are different for different sound units these features plays an important role in dialect determination.The dialect specific features derived from Frequency spectrum of the speech segment are often called spectral features. In the proposed method,spectral envelope is indicated using Mel frequency cepstral coefficient (MFCC) and Fourier bessel cepstral coefficient(FBCC). These features are obtained by analyzing speech segments of duration 20 to 30ms. This is due to the quasi stationary nature of the speech signal,in which speech signal remain stationary for a short duration of time. Thus by analyzing such small segments of speech, helps the system in tracking the pattern of dialect specific features. In this work we have explored the combined effect of three main features Mel frequency cepstral coefficient, Fourier bessel cepstral coefficient and Parseval energy for dialect identification in Malayalam language.
II. SPEECH DATABASE
The vital part in the design of a DI system is the dialect database which is the collection of audio speech files. In the proposed work dominant dialects among the fourteen different dialect varities of Malayalam are considered for identification. In database creation 10 native speakers, 5 male and 5 female members from each of the regions Kannur, Malappuram and Thrissur are requested to speak 30 sentences in their own dialect itself. Thus a total of 900 speech samples are recorded from 30 speakers consisting 15 male and 15 female speakers.
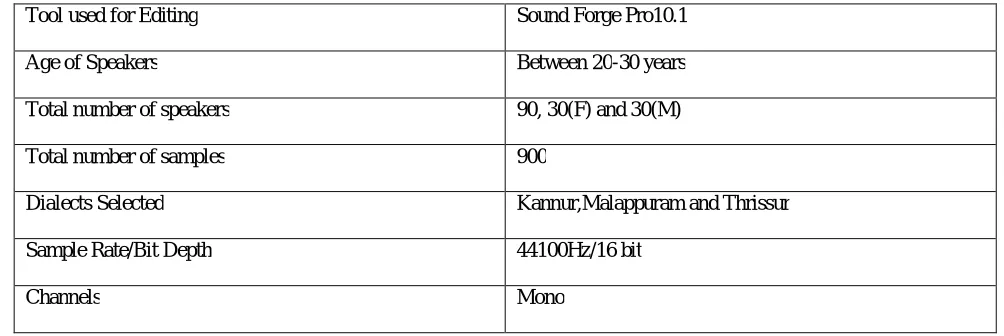
Table 1:Details Of Dialect Corpus
Tool used for Editing Sound Forge Pro10.1
Age of Speakers Between 20-30 years
Total number of speakers 90, 30(F) and 30(M)
Total number of samples 900
Dialects Selected Kannur,Malappuram and Thrissur
Sample Rate/Bit Depth 44100Hz/16 bit
Channels Mono
The recordings were done in Mattoli Radio station,Wayanad that contain a sound proof room and a controlling station that supervises the recording. Sound editing is carried out by the sound forge pro tool 10. In the created corpus Out of 900 samples, each region under study consist of 300 samples.
III. FEATURE EXTRACTION
The crucial part in the design of any speech system is the extraction of specific features for several application. Feature extraction techniques represents speech signals by means of a lower dimensional vector that are effective for classifying speech sounds. The several features that are employed in the suggested method are MFCC, FBCC and Parseval Energy. Each of these features are described in detail below.
A. MEL FREQUENCY CEPSTRAL COEFFICIENT(MFCC)
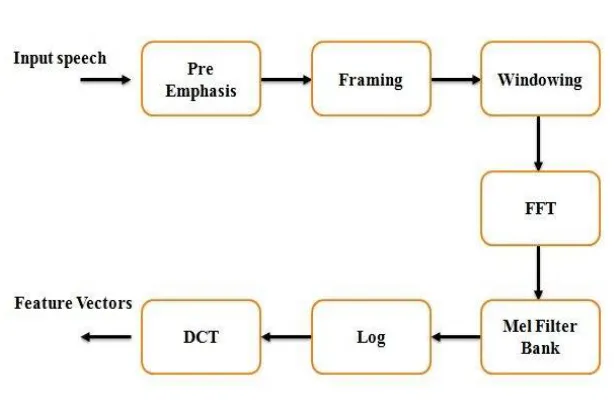
The main steps that are involved in the extraction of MFC coefficients are Framing and Windowing, Periodogram estimation , Filter bank energy calculation and Cepstral Analysis.
(1)Framing and Windowing : Due to the quasi stationary behaviour of the speech signal, Framing is utilized to divide speech signals into segments of short length 20 to 30ms. Instead of analysing the complete speech signal once,an overlap of 1/3 or 1/2 of the frame size is applied to every frame.Windowing is performed by multiplying every frame with a hamming window inorder to keep the continuity between first and last points in a frame. Hamming windows have side lobes closer to equal ripple and is the most commonly adopted window in speech systems. The hamming windows are represented in Eqn.1 .
vibrate in different positions depending on the frequency of incoming speech signal. Depending on the location of vibration of human cochlea,different nerves are get fired which informs the brain that certain frequencies are present in the signal. The same function is performed by the periodogram that identifies different frequencies present in the signal. The steps involved in the estimation are the computation of FFT and squared magnitude of frequency spectrum. FFT is often employed to convert the convolution between vocal tract impulse response and glottal pulse into multiplication in time domain. The fourier transform of the discrete speeech signal x(n) is constructed by the Eqn.2.
X[k] = ∑x[n]e (−j2πnk /N) , 0 ≤ k ≤ N, n= 0 …N-1 (2)
Power spectrum is computed by taking squared magnitude of X(k) given by
P(k) = |X(k)| ^2 (3)
Fig. 1. Computation of MFCC
(3) Filter bank energy calculation : Analysis by Mel scale instead of liner frequency scale is motivated from human perception experiment. Generally human ear has the nature to interpret pitch in a different manner as frequency increases,which in some application is unwanted. Human ear interpret pitch linearly upto 1000 Hz and above 1000Hz it respond logarithmically. To mimic the same behaviour mel scale is often employed. Mel filter bank consist of 20-40 triangular filters which are non uniformly spaced on the frequency scale, ie more number of filters with narrow width are placed in the low frequency region and less filters with larger width are placed at high frequency region. Steps involved in the construction of mel filters include the conversion of linear frequency to mel frequency scale.
fmel = 2595log10(1+f/700) (4)
Next each of the triangular filters are designed by the equation given below:
where k represents the frequency in linear scale and kbn represents bounary points of each of the triangular filter. The boundary points are given by the equation:
where fhigh represents high frequency in signal flow represents low frequency in signal N represents the number of filters.
Energy output from filters in the mel filter bank is obtained by multiplying power value P(k) with Frequency response of the filter φ(k).
Fig. 2. Mel filter bank
(3)Cepstral analysis : After smoothening of the spectrum,logarithm is applied to characterise non linearity in sound intensity and loudness. Finally spectral representation is coverted back to the time domain using Discrete cosine transform(DCT). Due to the energy compaction property of DCT,spectral informations are get compressed into a set of coefficients having low order. Among the 26 coefficients derived from the cepstum,only first 12 coefficients are considered in the proposed system. The DCT are computed by the given Eqn.8.
where Cm represents the MFCC coefficients and M represents the number of coefficients.
B. FOURIER BESSEL CEPSTRAL COEFFICIENTS(FBCC)
The main steps involved in the calculation of FBCC’s are depicted in Fig.3. Vocal tract which are generally sculptured by a group of linear cylindrical acoustic tubes, can be accurately represented using fourier bessel expansion[7] because bessel functions are the solution to cylindrical wave equation. So speech signals are more efficiently presented by bessel functions rather than sinusoidals that represents periodic signals. The main difference between MFCC and FBCC[8] computation is that, instead of taking fast fourier transform, Fourier bessel expansion is chosen for representing speech signal in frequency domain. A discrete speech signal x(n) over an interval of [0,N] is represented by means of Zero order bessel function as:
where J0 (.) represents the zero order bessel functions.The bessel coefficients are obtained by the following relation,
where J1 (.) are first order bessel function
λm: m = 1,2....M are the positive ascending order roots of J0(λ) = 0.
Fig. 3. FBCC block diagram
C. PARSEVAL ENERGY
Speech signals effectively represented by Fourier Bessel coefficients can be used to identify different components in signals. Generally human cochlea can not find out two near frequencies. As frequency increses the ability to discern frequencies decreases further. So Human ear obtain information based on energy in a band of frequencies instead of that from a single frequency. Motivated from this fact Parseval energies derived from segments of fourier bessel coefficients.
Where m gives the order of bessel function
mi1 represents the starting value of m in the i th segment mi2 represents the last value of m in the i th segment
IV. CLASSIFICATION
In classification phase,input feature vector is provided to the classifier to create a model for correctly classifying instances into appropriate classes. In general,there are several classifiers available for this purpose. In the proposed work, classification is performed using the following classifiers, Support vector machine(SVM) & Artificial Neural Network(ANN).
A. SUPPORT VECTOR MACHINE
Support Vector Machine is a usually used Pattern identification approach. Linear hyperplanes are usually employed to classify instances in this supervised learning model. When the provided feature set value are not linearly seperable,linear decision boundary will not provide accurate result. In most of the application, inorder to classify non linear data SVM uses a ’Kernel trick’ to classify the instances. The basic idea behind Kernel trick is to find a maximal hyperplane from a kernel induced feature space. The non seperable data in R2 is found to be seperable when it is transformed (explicitly) into a higher dimensional space RM. The transformation is often employed by taking dot product between training examples. As the dimension M increases transformation become computationally complex and memory requirement also increases. Inorder to beat this drawback all the dot products are get replaced by the kernel function which can implicitly work on a higher dimensional space rather than constructing it. The several kernel functions that are employed for the trick includes sigmoid, polynomial and radial basis function. Finally the projection of samples obtained in a higher dimensional space can be used to seek out out a marginal hyperplane . When this marginal plane is viewed in R2 ,it is found to be a non linear plane which effectively seperate the instances into appropriate classes. In the proposed work, SVM based classification is performed in WEKA platform with poly kernel fuction. Cross validation of 10 folds are selected for training the system.
B. ARTIFICIAL NEURAL NETWORK
performed by the pattern recognition tool in MATLAB 2013a platform. Roughly 70% of the training dialect data was used to train the neural network, 15% was used as a validation set and 15% was used as a test set.
V. EXPERIMENTAL ANALYSIS
In the proposed work, different combinations of feature vectors selected for analysis purpose are given below. 1) MFCC
2) FBCC
3) FBCC & MFCC
4) FBCC,MFCC & Parseval energy
A. CLASSIFICATION USING SVM
Accuracy of the system when it is get trained and tested using SVM classifier is given in the Table 2.
Table 2:Accuracy Of System Using Svm
Feature Set
Accuracy
MFCC 77.78%
FBCC 76.667%
MFCC+FBCC 86.778%
MFCC+FBCC+Parseval energy 92.222%
From the table, it is clear that the system works well when the features MFCC, FBCC and Parseval energy are combined together, giving an overall accuracy of 92.22%. Detailed performance of the system is analysed in Table 3.
Table 3:Proposed System Using Svm
Dialects Recall Precision F measure
Kannur 90.70% 87.70% 89.20%
Malappuram 89.70% 90% 89.80%
Thrissur 96% 99% 97.50%
B. CLASSIFICATION USING ANN
In the proposed work the same feature sets are also provided to an ANN. The accuracy obtained for several sets are given in Table 4.
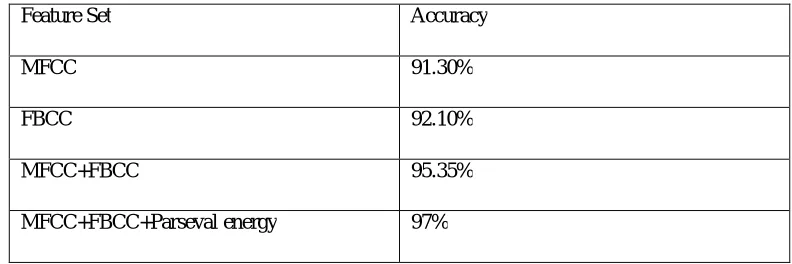
Table 4:Accuracy of system using ANN
Feature Set Accuracy
MFCC 91.30%
FBCC 92.10%
MFCC+FBCC 95.35%
From the result it is clear that the system performs well when all the features are combined together and ANN classifier is used. The overall accuracy acheived by the system is 97%. The detailed parameters for each class are given in the Table 5.
Table 5:Proposed System Using ANN
Dialects Recall Precision F measure
Kannur 95.30% 94.10% 94.70%
Malappuram 96.30% 95.10% 95.70%
Thrissur 96.70% 99.30% 98%
C. COMPARISON OF RESULTS
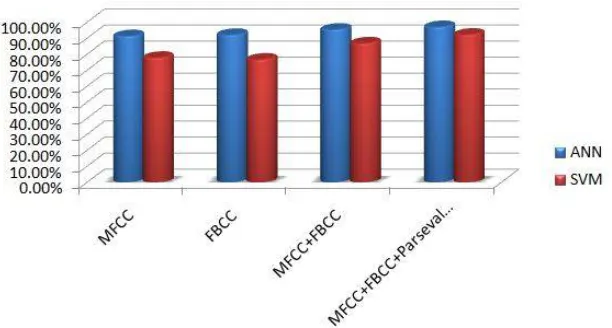
In the study, several combinations of feature sets are analysed using SVM and ANN classifier. For each feature set it is found that, individually they provide moderate performance.When these features are combined or integrated together it is found to be outperforming the current systems for dialect identification. Among all the feature set combinations max-imum efficiency is acheived for the integrated feature set which includes MFCC, FBCC and Parseval energy. When considering the classification algorithm it is clear from the plot that maximum efficiency is acheived by ANN classifierin all feature set combinations. As a conclusion we can say that the proposed system acheived a maximum efficiency of 97% when using Combined set of features and ANN as classifier.
Fig. 7. Comparison of existing vs proposed
VI. CONCLUSION
This paper presents a system that automatically identifies Malayalam dialects from speech signal. The different dialects that are identified in the study are Kannur, Malappuram and Thrissur. Since a well organized database is unavailable, we created a new one which includes the speech samples from each of these regions. A total of 900 samples,in which 300 samples corresponding to each dialect. In feature identification stage, current trends and previous works on different features for dialect determination are identified. Commonly in DI systems , MFCC’s are used as the feature vector, but due to the ressemblence between voiced speech and bessel function , bessel coefficients give more accurate representation of speech. signal. Individually all these features provides a moderate performance accuracy. But the results shows that when they are integrated ie, the combinaton of MFCC, FBCC and Parseval energy, they are found to be very effective in discriminating Malayalam dialects. This method yields a system performance of 92.22% with SVM classifier and 97% with ANN classifier.
ACKNOWLEDGMENT
REFERENCES
[1] K Sreenivasa Rao, ”Identification of Hindi dialects using speech”, IEEE Int. Conf.Acoust., Speech, Signal Processing , March 2013..
[2] Fadi Biadsy and Julia Hirschbergl, ”Spoken Arabic dialect identification using phono-tactic modeling”, Proceedings of the EACL workshop on computational approaches to semitic Languages , March 2009.
[3] Rahul Chitturi and John H.L.Hansen, ”Multi-stream dialect classification using SVM-GMM hybrid classifiers”, IEEE Workshop on Automatic Speech Recognition & Understanding ASRU, 2007
[4] Wang Xia,Gu Mingliang ”Chinese Dialect Identification Based on Gender Classification”, IEEE international conference on wireless communications and signal processing(WCSP), 2011.
[5] Mohamad Hasan Bahari,Najim Dehak,Hugo Van hamme,Lukas Burget,”Non negative Fctor Analysis of Gaussian mixture model weight adaptation for language and dialect recognition”, IEEE/ACM Transaction on Audio, Speech and Language Processing,July 2014.
[6] Fawazi s Alorfi, ”Automatic identification of arabic dialects using hidden markov model”, Proceedings of the 2010 IEEE International Conference on Automation and Logistics, Macau, August16-20, 2010.
[7] Drisya vasudev,Suryakanth V Gangashetty,Anish babu,Riyas K S, ”Query by example spoken term detection using Bessel features”, International conference on advances in computing, communication and informatics,ICACCI, August 2015.
[8] Drisya vasudev,Suryakanth V Gangashetty,Anish babu,Riyas K S, ”Speaker identification using FBCC in Malayalam language”, Third international conference on advances in computing, communication andinformatics(ICACCI-2014),Noida , sept.2014.
[9] Sunija A P,Rajisha T M,Riyas K S, ”Comparitive study of different classifiers for Malayalam dialect recognition system”, 4th biennial international conference emerging trends in engineering science and technology,Dec2015
[10] Shweta Sinha, ”Acoustic- Phonetic Feature based Dialect Identification in Hindi Speech”, International Journal on smart sensing and intelligent system, March 2015.
[11] Ngodrup, ”Research on Tibetan Lhasa Dialect Phonetic Feature Extraction Technology Based on LDA-MFCC”, International Conference on Information Science and Technology, Nanjing, Jiangsu, China, March2011.
[12] Yun Lei, John H. L. Hansen, ”Dialect Classification via Text-Independent Training and Testing for Arabic, Spanish, and Chinese”,”IEEE Transaction on Audio, Speech and Language Processing,January2011.
[13] Lindasalwa Muda, ”Voice Recognition Algorithms using Mel Frequency Cepstral Coefficient (MFCC) and Dynamic Time Warping (DTW) Techniques”, Journal Of Computing, Volume 2, Issue 3, March 2010.