| INVESTIGATION
Dissecting Causal Pathways Using Mendelian
Randomization with Summarized Genetic Data:
Application to Age at Menarche and Risk of
Breast Cancer
Stephen Burgess,*,†,1Deborah J. Thompson,‡Jessica M. B. Rees,†Felix R. Day,§John R. Perry,§ and Ken K. Ong§ *MRC Biostatistics Unit,†Cardiovascular Epidemiology Unit,‡Cambridge Centre for Genetic Epidemiology, and§MRC Epidemiology Unit, University of Cambridge, CB2 0QQ Cambridgeshire, United Kingdom
ABSTRACTMendelian randomization is the use of genetic variants as instrumental variables to estimate causal effects of risk factors on outcomes. The total causal effect of a risk factor is the change in the outcome resulting from intervening on the risk factor. This total causal effect may potentially encompass multiple mediating mechanisms. For a proposed mediator, the direct effect of the risk factor is the change in the outcome resulting from a change in the risk factor, keeping the mediator constant. A difference between the total effect and the direct effect indicates that the causal pathway from the risk factor to the outcome acts at least in part via the mediator (an indirect effect). Here, we show that Mendelian randomization estimates of total and direct effects can be obtained using summarized data on genetic associations with the risk factor, mediator, and outcome, potentially from different data sources. We perform simulations to test the validity of this approach when there is unmeasured confounding and/or bidirectional effects between the risk factor and mediator. We illustrate this method using the relationship between age at menarche and risk of breast cancer, with body mass index (BMI) as a potential mediator. We show an inverse direct causal effect of age at menarche on risk of breast cancer (independent of BMI), and a positive indirect effect via BMI. In conclusion, multivariable Mendelian randomization using summarized genetic data provides a rapid and accessible analytic strategy that can be undertaken using publicly available data to better understand causal mechanisms.
KEYWORDSMendelian randomization; instrumental variable; mediation analysis; direct effect; causal inference
M
ENDELIAN randomization is the use of genetic variants as instrumental variables to assess and estimate the causal effect of a risk factor on an outcome (Davey Smith and Ebrahim 2003; Burgess and Thompson 2015b). A risk factor has a causal effect on an outcome if intervening on the risk factor leads to changes in the outcome. Correlation between a risk factor and an outcome may arise because the risk factor is a cause of the outcome. However, it may also reflect confounding (the risk factor and outcome have common causes) or reverse causation (the outcome is a cause of the risk factor). Instrumental variableanalysis represents one way of assessing whether there is a causal effect of the risk factor on the outcome under certain assumptions using observational data.
For a genetic variant to be a valid instrumental variable, it must satisfy three assumptions. First, the genetic variant must be associated with the risk factor. Second, the genetic variant must not be associated with confounders of the risk factor-to-outcome association. Third, the genetic variant must not affect the outcome except via the risk factor of interest (no direct effect on the outcome) (Greenland 2000; Lawloret al.2008). Whereas phe-notypic variables tend to display widespread correlations with other phenotypes, genetic variants are often more specific in their associations (Davey Smithet al.2007), meaning that Mendelian randomization investigations are less susceptible to biases from confounding that adversely affect observational studies. Addi-tionally, as the genetic code isfixed at conception, genetic asso-ciations are less susceptible to reverse causation or confounding due to environmental factors.
Copyright © 2017 by the Genetics Society of America doi:https://doi.org/10.1534/genetics.117.300191
Manuscript received March 21, 2017; accepted for publication August 15, 2017; published Early Online August 22, 2017.
Supplemental material is available online atwww.genetics.org/lookup/suppl/doi:10. 1534/genetics.117.300191/-/DC1.
1Corresponding author: Cambridge Institute of Public Health, University of
The instrumental variable assumptions can be assessed to some extent by testing for associations between the genetic variants and potential measured confounders (Burgess et al. 2015c). However, it is possible that a covariate associated with a genetic variant is not a confounder, but rather a mediator on the causal pathway from the risk factor to the outcome (Haycocket al.2016). This is particularly likely if several vari-ants all have directionally concordant associations with the same covariate. Genetic associations with a mediator may not represent pleiotropic effects of the variants, but rather represent downstream consequences of intervening on the risk factor. In such a case, the genetic variants are still valid instruments, as the only causal pathway from the variants to the outcome is via the risk factor (and potentially also via the mediator).
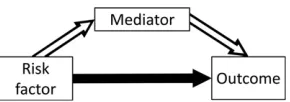
In many scenarios, it is relevant not only whether the risk factor is a cause of the outcome, but also via what mechanism this causal effect acts. Mediation analysis can be used to dissect the total causal effect of the risk factor on the outcome into an indirect effect of the risk factor on the outcome via the mediator, and a direct effect of the risk factor on the outcome not via the mediator (possibly via other causal pathways or other mediators) (VanderWeele and Vansteelandt 2009). This is illustrated in Figure 1. The total effect is defined as the change in the outcome resulting from intervening on the risk factor (say, increasing its value by 1 unit). The direct effect is the change in the outcome resulting from intervening on the risk factor but holding the mediator constant. The indirect effect is the change in the out-come resulting from manipulating the value of the mediator as if we had intervened on the risk factor, but in fact holding the risk factor constant. If all variables are continuous, and all relation-ships between variables are linear, then the total effect is equal to the direct effect plus the indirect effect. Formally, a direct effect defined by intervening on the risk factor and mediator separately is a controlled direct effect, which does not have a counterpart indirect effect. If all relationships are linear, then the controlled direct effect is equal to the natural direct effect, which does have a counterpart, the natural indirect effect. Full details are provided in the Supplemental Material,File S1 A.1.
Mendelian randomization analyses using summarized data have recently become widespread due to the increasing public availability of suitable data in large sample sizes from genome-wide association studies (GWAS) consortia, and the possibility of “two-sample”Mendelian randomization in which genetic asso-ciations with the risk factor and outcome are estimated in dif-ferent samples (Burgess et al.2015c). It has previously been demonstrated that a (univariable) Mendelian randomization estimate can be obtained from summarized data [b-coefficients and standard error (SE)] by regressing genetic associations with the outcome on genetic associations with the risk factor (Burgesset al.2016). This represents the total effect of the risk factor on the outcome. It has also been demonstrated that direct causal effects of related risk factors can be estimated by regressing genetic associations with the outcome on genetic associations with each of the risk factors in a multivariable regression model; this is referred to as multivariable Mendelian randomization (Burgess and Thompson 2015a).
We have previously investigated mediation using genetic variants as instrumental variables using individual-level data under the name“network Mendelian randomization”(Burgess et al.2015a). In this report, we demonstrate how the total effect and the direct effect of the risk factor on the outcome can be estimated from summarized data. We consider the assumptions necessary for genetic variants to satisfy for consistent estima-tion, and we exemplify how these estimates can be used to interrogate causal mechanisms with an applied example of the effect of age at menarche on breast cancer risk, with body mass index (BMI) as a potential mediator.
Methods
Assumed framework of summarized data and genetic associations
We initially assume that all variables are continuous, and rela-tionships between variables (in particular, the genetic associa-tions with the risk factorX, mediatorM, and outcomeY, and the causal effects of the risk factor and mediator on the outcome, and of the risk factor on the mediator) are linear with no effect modification (that is, they are the same for all individuals in the population and do not vary for different values of the indepen-dent variable). For each genetic variantGj(j¼1;2;. . .;J), we
assume that we have an estimateb^Xjof the association of the
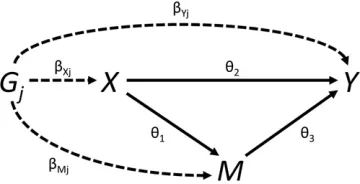
genetic variant with the risk factor obtained from linear regres-sion. Similar association estimates are assumed to be available for the mediatorðb^MjÞand outcomeðb^YjÞ:The SE of the asso-ciation estimate with the outcome is seðb^YjÞ:If any of the var-iables is binary, then these summarized association estimates may be replaced with association estimates from logistic regres-sion; more detail on the binary outcome case is provided later in the paper. The relationships between these variables are illus-trated in Figure 2.
the risk factor, but variants with robustly verified associations represent more informative instrumental variables.
Weighted regression for estimation of total and direct effects
Ifb^Xj;b^Mj;andb^Yjare the genetic associations of variantGj
(j¼1;2;. . .;J) with the risk factor (X), mediator (M), and outcome (Y), and seð^bYjÞare the SE of the genetic associa-tions with the outcome, then the weighted regression:
^
bYj¼uTbXj^ þeTj; eTj N0;seðbYj^ Þ2
(1)
provides an estimate of the total effect of the risk factor on the outcome uT; known as the inverse-variance weighted
esti-mate (Burgess et al.2013). This regression model does not take into account uncertainty in the genetic associations with the risk factor; however, these associations are typically more precisely estimated than those with the outcome, and ignor-ing this uncertainty does not lead to inflated Type 1 error rates in realistic scenarios (Burgesset al.2013).
The inverse-variance weighted estimate can be motivated as thefixed-effect meta-analysis pooled estimate of the variant-specific causal estimatesb^Yj=b^Xjwith SE taken as seðb^YjÞ=b^Xj
(the leading order term from the delta expansion for the SE of the ratio of two variables). This meta-analysis estimate can also be obtained by the weighted regression model in Equation (1) (Thompson and Sharp 1999). The weighted regression model can be expanded by including genetic associations with the mediator:
^
bYj¼uDbXj^ þuM^bMjþeDj; eDj N0;seðbYj^ Þ2
(2)
to provide an estimate of the direct effectuD:The weighted
regression method for calculating the total effect (Equa-tion 1) is equivalent to the two-stage least squares (2SLS) method with individual-level data, in which thefirst stage of the method regresses the risk factor on the genetic variants, and the second stage regresses the outcome onfitted values of risk factor (Burgesset al.2016). The weighted regression method for calculating the direct effect (Equation 2) is also equivalent to a two-stage regression method, except that the first stage also regresses the mediator on the genetic variants,
and the second stage regresses the outcome onfitted values of the risk factor andfitted values of the mediator (Burgesset al. 2015b); this same two-stage procedure could be undertaken to estimate a direct effect if individual-level data were available (Burgesset al.2015a). Software code to implement these anal-yses using summarized data are provided inFile S1 A.2. With a continuous outcome, the indirect effect of the risk factor on the outcome can be calculated asuI¼uT2uD;or alternatively as
uI¼uA3uM;whereuAis the causal effect of the risk factor on
the mediator, anduM is the effect of the mediator on the
out-come as in Equation (2). Approaches for making inferences on the indirect effect are discussed inFile S1 A.3.
For consistent estimation, it is required that all genetic var-iants used to estimate the total effect of the risk factor on the outcome satisfy the standard assumptions of Mendelian randomization: they are associated with the risk factor, not associated with confounders, and there is no pathway from any genetic variant to the outcome except via the risk factor. All variants used to estimate the direct effect of the risk factor on the outcome must satisfy the assumptions of multivariable Men-delian randomization: they are associated with the risk factor and/or mediator, not associated with confounders, and there is no pathway from any genetic variant to the outcome except via the risk factor and/or the mediator (Burgess and Thompson 2015a).
Identification of the direct effect
If the genetic associations with the mediator are entirely de-termined by their associations with the risk factor, then, with an infinite sample size (if associations are perfectly linear with no heterogeneity), the direct effect would not be identified, as the genetic associations with the risk factor and mediator would be perfectly correlated. Hence, it is necessary for there to be some heterogeneity in the genetic associations or the relationships between the variables. This may occur for a complex risk factor such as BMI, where different genetic variants may influence BMI in different ways or via different biological pathways, potentially leading to different magnitudes of causal effect on the mediator. To illustrate this statistically, we consider a framework concep-tually similar to that in a random-effects meta-analysis, in which there is variant-specific heterogeneity for the effect of the risk factor on the mediator. We suppose that the mediatorMifor different
individuals in the population indexed byiis generated as a linear combination of the risk factorXiand an error termhi:
Mi¼a0þ aXþ X
j cjgij
!
Xiþhi (3)
wherecjis a zero-mean interaction term leading to
hetero-geneity in the risk factor–mediator causal effect, and hence heterogeneity in the genetic associations with the mediator. This is equivalent to adding zero-mean noise to the gene– mediator and gene–outcome association estimates. It provides identification and consistent estimation in the Mendelian ran-domization analysis for the direct effect (estimates of the total effect would be attenuated, although causal inferences for the total effect would still be valid).
Figure 2 Graphical diagram of relationships between risk factor (X), medi-ator (M), outcome (Y), and genetic variant (Gj). Causal relationships between variables are indicated by solid lines. Associations of the genetic variant are indicated by dashed lines. The direct effect uD¼u2: The indirect effect
Alternatively, we could allow the genetic variants to have direct (pleiotropic) effects on the mediator:
Mi¼a0þaXXiþ X
j
c9jgijþh9i (4)
where again thec9j parameters have mean zero; a situation
known as“balanced pleiotropy.”Although this formally leads to violation of the instrumental variable assumptions, it has been shown that such“balanced pleiotropy”does not lead to bias in causal estimates asymptotically provided that the pleiotropic effects are independent of the instrument strength (theaXparameters) (Bowdenet al.2015).
In an ideal situation, if there are additional genetic variants that are instrumental variables for the mediator, then these variants could be included in the multivariable Mendelian randomization analysis. However, such variants are not valid instrumental variables for the risk factor, and so should not be used to estimate the total causal effect of the risk factor on the outcome.
Results
Applied example
As an illustrative example, we consider the causal effect of age at menarche on breast cancer risk. Numerous genetic variants have been discovered that influence age at menarche. Later puberty reduces the total number of ovulatory cycles and hence the life-time sex-hormone exposure, thus we expect later menarche to be protective for breast cancer. This is in line with observational epidemiological findings (Collaborative Group on Hormonal Factors in Breast Cancer 2012). How-ever, later menarche is also associated with lower BMI, and it is known that genetically predicted BMI (and also adolescent BMI) is inversely associated with breast cancer risk (Baer et al.2010; Guoet al.2016). Therefore, age at menarche will likely have an indirect effect on breast cancer risk via BMI as well as a direct effect (in the opposite direction) not via BMI. We have taken 375 genetic variants demonstrated to be associated with age at menarche at a genome-wide level of significance (Dayet al.2017). Genetic associations with age at menarche (measured in years) were obtained from the Reprogen consortium based on 329,000 women of European descent. Genetic associations with BMI were obtained from the GIANT consortium, based on 339,000 individuals, 95% of whom are of European descent (Lockeet al.2015). Genetic associations with breast cancer risk were obtained from the Breast Cancer Association Consortium (BCAC) on 47,000 cases and 43,000 controls (all female) of European descent (Michailidouet al.2015). Although genetic associations with BMI were estimated at different timepoints for different stud-ies in the GIANT consortium, as genetic variants typically influence variables across the whole life-course, it is not cru-cial when these associations are measured, provided that they are measured in individuals before they have disease events (to prevent reverse causation, seeDiscussionfor more
detail). A more detailed analysis of these same data (al-though based on the individual-level data) was previously reported by Dayet al.(2017); further details relating to ap-plied aspects of the analysis are provided in that paper.
Univariable Mendelian randomization suggested a null effect of age at menarche on breast cancer risk (odds ratio per 1 year later menarche 1.00, 95% confidence interval (CI) 0.96, 1.05). However, a multivariable Mendelian randomiza-tion analysis adjusting for genetic associarandomiza-tions with BMI sug-gested a protective direct effect of later age at menarche (odds ratio 0.94, 95% CI 0.89, 0.98). This suggests that an intervention to delay menarche would have no net effect on breast cancer risk if it also had the expected consequence of lowering adolescent BMI (or, similarly, if the delay in menar-che was achieved by reducing prepubertal BMI). However, an intervention which had an effect on postpubertal sex-hormone exposure equivalent to a later menarche would be likely to have a protective effect on breast cancer risk, as such an intervention could not affect pubertal timing and hence would not alter BMI; hence, only the direct effect of age at menarche on breast cancer risk would apply here. We note that the results presented here using the summary statistics method are, to two decimal places, identical to those com-puted using individual-level BCAC data, and reported in Day et al.(2017). As the outcome is binary, we do not provide an estimate of an indirect causal effect (seeDiscussion).
Simulation study
To validate the utility of the multivariable Mendelian ran-domization method for estimating a direct causal effect, we performed a simulation analysis. We generated data on 10 ge-netic variants, a risk factor (X), mediator (M), and outcome (Y) for 10,000 individuals in a one-sample Mendelian ran-domization context. Full details of the simulation setup are provided inFile S1 A.3. Briefly, we considered eight different sets of values of the parametersu1(the causal effect ofXon
M),u2(the direct effect ofXonY), andu3(the effect ofMon
Y)—see Figure 2. The indirect effect ofXonYviaMisu1u3;
and the total effect ofXonYisu2þu1u3:We included
sce-narios where there is no direct effect, no indirect effect, a direct effect and a directionally concordant indirect effect, and a direct effect and a directionally discordant indirect effect. Parameters were chosen to take realistic values and cover a range of scenarios; 10,000 simulated datasets were generated for each choice of parameter values. Heterogeneity to ensure identification of the model was generated by addi-tionally allowing the genetic variants to affect the mediator directly; these effects were drawn from a normal distribution with mean zero.
plus SE). We assumed that all genetic variants were uncorre-lated (no linkage disequilibrium); their distributions in the data-generating model were independent. This assumption can be relaxed using generalized weighted linear regression as de-scribed elsewhere (Burgesset al.2016).
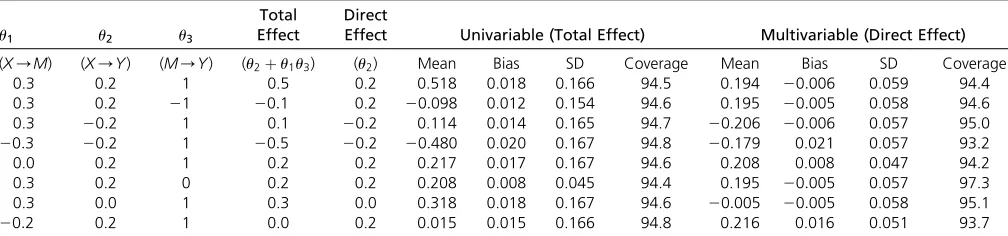
Table 1 shows mean estimates of the total and direct ef-fects, mean bias and SD of the estimates, and coverage of the 95% CI (the proportion of CI that include the true value of the parameter). The SE for the causal estimates were adjusted for underdispersion (residual SE in the regression model,1) as described in the software code. No correction for overdisper-sion was applied (Burgess and Thompson 2017). The Monte Carlo error (uncertainty due to the limited number of simu-lations) was 0.001 for each mean estimate, and 0.2% for the coverage proportion. We see that mean univariable Men-delian randomization estimates are similar to the total causal effect, whereas mean multivariable Mendelian randomiza-tion estimates are similar to the direct causal effect in each scenario considered. Bias in the mean estimates is small throughout, and is likely to be due to weak instrument bias arising from the limited strength of the genetic variants (Burgess et al.2011) (no bias was observed on repeating the simulation study with a sample size of 1,000,000 for a small number of simulated datasets). Bias was consistent in direction for the total effect, but varied in direction for the direct effect. Coverage rates were close to nominal levels (95%) throughout, except for when there was substantial weak instrument bias in estimates of the direct effect. There was no noticeable undercoverage resulting from the regres-sion models failing to account for uncertainty in the genetic associations with the risk factor or mediator. Inferences for the indirect effect are discussed inFile S1 A.3 and presented in Table SA1 inFile S1. Further results inFile S1 A.4 indicate that these findings hold even when there are bidirectional effects of the risk factor on the mediator and vice versa (as may be the case for age at menarche and BMI).
Discussion
In this paper, we have demonstrated how summarized data on genetic associations can be used to investigate causal mech-anisms, in particular whether the causal effect of a complex risk factor on an outcome acts via a given mediator. Although the assumptions required for a genetic variant to be an in-strumental variable are very stringent, in other ways, the requirements necessary to perform this analysis are quite flexible—only summarized data on genetic associations are required. This allows for the leverage of data from large-scale GWAS consortia. As with two-sample Mendelian randomiza-tion (Pierce and Burgess 2013), the summarized data meth-ods described here do not require the genetic associations with the risk factor, mediator, and outcome to be measured in the same individuals. For example, Eppingaet al.(2016) used genetic variants to investigate the effect of resting heart rate on mortality in UK Biobank. As a sensitivity analysis, they adjusted the genetic associations with the outcome for some
covariates using individual-level data to assess whether the effect of resting heart rate was mediated via any of those variables. Additionally, they adjusted for genetic associations with lipid fractions using the multivariable Mendelian ran-domization approach outlined here, as lipid measurements are currently not available in the dataset. Combining sum-mary statistics from different sources is also important in the example of age at menarche and breast cancer here, as BMI measurements for breast cancer cases were only available postdiagnosis. These measurements would likely be influ-enced by the disease process, as well as by treatment and lifestyle changes. It is therefore preferable here to estimate the effects of the genetic variants on BMI in a separate dataset.
Compatibility of datasets
When using genetic associations from multiple datasets in a two-sample Mendelian randomization setting, ideally the associations should be estimated on samples from the same underlying population. This is particularly important with regard to ethnicity, as different linkage disequilibrium struc-tures can mean that genetic variants may be associated with the risk factor in one population and not in another, or be valid instruments in one population but not in another. Ideally, genetic associations should not be adjusted for covariates apart from principal components of ancestry, particularly if these covariates may be on causal pathways relating to the risk factor, mediator, or outcome. It is also important to ensure that genetic associations with the risk factor and mediator are estimated in individuals who have not had disease events, so that these associations are not influenced by reverse causa-tion. However, even if associations are estimated in different datasets (say, associations with the risk factor are measured in 20-year olds and associations with the mediator in 50-year olds, or vice versa), as genetic variants typically influence variables across the whole life-course, inferences from Men-delian randomization for the causal null hypothesis should still be qualitatively valid, even if the parametric assumptions necessary for causal estimation are not satisfied (Burgesset al. 2016). In any case, as Mendelian randomization estimates represent the effect of changing people’s genetic variants at conception, causal estimates from Mendelian randomiza-tion should not be interpreted too literally as the expected impact of intervening on the risk factor in practice (Burgess et al.2012). These issues are discussed in greater detail in Burgesset al.(2016) and Bowdenet al.(2017).
misspecified, then adjustment for genetic associations with the mediator may not fully attenuate the coefficient in the weighted regression for the effect of the risk factor, even in the case of complete mediation. Multiplying genetic associations by a constant would not affect the significance of coefficients in the weighted regression; hence, any differences between populations that would lead to consistent over or underesti-mation of genetic associations for all variants should not influence inferences from the methods presented here. How-ever, differences that lead to inconsistent over or underesti-mation of genetic associations would adversely affect causal inferences. Therefore, genetic associations should be esti-mated in as similar populations as possible.
Binary variables and nonlinear relationships
It is common for the outcome in a Mendelian randomization investigation to be a binary variable, such as disease status. In this case, typically genetic associations are obtained from logistic regression, and represent log odds ratios. Odds ratios are noncollapsible, meaning that they do not average intui-tively, and they depend on the choice of covariate adjustment even in the absence of confounding (so conditional odds ratios differ in magnitude to marginal odds ratios) (Greenlandet al. 1999). This means that differences between causal estimates from Equations (1) and (2) may arise due to noncollapsibil-ity rather than mediation. However, these differences are likely to be slight (Burgess 2017). In practice, as in the ap-plied example considered in this paper, we would recom-mend providing estimates of the total and direct effects, but not the indirect effect, as calculation of the indirect effect relies on the linearity of the relationships that cannot occur with a binary outcome. The total and direct effects still have interpretations as population-averaged causal effects (condi-tional on the mediator for the direct effect), representing the average change in the outcome resulting from intervening on the population distribution of the risk factor (while keeping the mediator constant for the direct effect) (Burgess and CRP CHD Genetics Collaboration 2013). Substantial differences between these estimates would still be informative about the causal pathway from the risk factor to the outcome.
Similarly, if there is a nonlinear relationship between the risk factor and outcome, the causal effects still have an
in-terpretation as population-averaged causal effects, repre-senting the average change in the outcome resulting from intervening on the population distribution of the risk factor (Burgesset al.2014). Again, we would recommend report-ing a total effect and a direct effect, but not an indirect effect.
In conclusion, we hope that the methods outlined in this manuscript will be used widely in assessing and understand-ing causal pathways and mechanisms.
Acknowledgments
This study would not have been possible without the contributions of the following: Per Hall [Collaborative Oncological Gene–environment Study (COGS)]; Douglas F. Easton, Paul Pharoah, Kyriaki Michailidou, Manjeet K. Bolla, and Qin Wang [Breast Cancer Association Consortium (BCAC)]; Andrew Berchuck [Ovarian Cancer Association Consortium (OCAC)]; Rosalind A. Eeles, Douglas F. Easton, Ali Amin Al Olama, Zsofia Kote-Jarai, and Sara Benlloch [Prostate Cancer Association Group to Investigate Cancer Associated Alterations in the Genome (PRACTICAL)], Geor-gia Chenevix-Trench, Antonis Antoniou, Lesley McGuffog, Fergus Couch, and Ken Offit [Consortium of Investigators of Modifiers of BRCA1/2 (CIMBA)], Joe Dennis, Alison M. Dunning, Andrew Lee, Ed Dicks, Craig Luccarini, and the staff of the Centre for Genetic Epidemiology Laboratory, Javier Benitez, Anna Gonzalez-Neira, and the staff of the Spanish National Cancer Research Center (CNIO) genotyping unit, Jacques Simard and Daniel C. Tessier, Francois Bacot, Daniel Vincent, Sylvie LaBoissière and Frederic Robidoux and the staff of the McGill University and Génome Québec Innovation Centre, Stig E. Bojesen, Sune F. Nielsen, Borge G. Nordestgaard, and the staff of the Copenhagen DNA labo-ratory, and Julie M. Cunningham, Sharon A. Windebank, Christopher A. Hilker, Jeffrey Meyer and the staff of Mayo Clinic Genotyping Core Facility. Funding for the iCOGS infrastructure came from: the European Com-munity’s Seventh Framework Programme under grant agreement number 223175 (HEALTH-F2-2009-223175) (COGS), Cancer Research UK (C1287/A10118, C1287/A 10710, C12292/A11174, C1281/A12014, C5047/A8384, Table 1 Mean, bias, SD, and coverage of 95% CI (%) of univariable and multivariable Mendelian randomization estimates across 10,000 simulated datasets for different mediation scenarios (X= risk factor,M= mediator,Y= outcome)
u1 u2 u3
Total
Effect DirectEffect Univariable (Total Effect) Multivariable (Direct Effect)
(X/M) (X/Y) (M/Y) (u2þu1u3) (u2) Mean Bias SD Coverage Mean Bias SD Coverage
0.3 0.2 1 0.5 0.2 0.518 0.018 0.166 94.5 0.194 20:006 0.059 94.4
0.3 0.2 21 20:1 0.2 20:098 0.012 0.154 94.6 0.195 20:005 0.058 94.6
0.3 20:2 1 0.1 20:2 0.114 0.014 0.165 94.7 20:206 20:006 0.057 95.0
20:3 20:2 1 20:5 20:2 20:480 0.020 0.167 94.8 20:179 0.021 0.057 93.2
0.0 0.2 1 0.2 0.2 0.217 0.017 0.167 94.6 0.208 0.008 0.047 94.2
0.3 0.2 0 0.2 0.2 0.208 0.008 0.045 94.4 0.195 20:005 0.057 97.3
0.3 0.0 1 0.3 0.0 0.318 0.018 0.167 94.6 20:005 20:005 0.058 95.1
C5047/A15007, and C5047/A10692), the National Insti-tutes of Health (CA128978) and Post-Cancer GWAS ini-tiative (1U19 CA148537, 1U19 CA148065, and 1U19 CA148112—the GAME-ON initiative), the Department of Defence (W81XWH-10-1-0341), the Canadian Institutes of Health Research (CIHR) for the CIHR Team in Familial Risks of Breast Cancer, Komen Foundation for the Cure, the Breast Cancer Research Foundation, and the Ovarian Cancer Re-search Fund. S.B. is supported by Sir Henry Dale Fellowship jointly funded by the Wellcome Trust and the Royal Society (grant number 204623/Z/16/Z). The authors declare no conflict of interest. F.R.D., J.R.P., and K.K.O. are supported by the Medical Research Council (Unit Programme number MC_UU_12015/2).
Literature Cited
Baer, H. J., S. S. Tworoger, S. E. Hankinson, and W. C. Willett, 2010 Body fatness at young ages and risk of breast cancer throughout life. Am. J. Epidemiol. 171: 1183–1194.
Bowden, J., G. Davey Smith, and S. Burgess, 2015 Mendelian randomization with invalid instruments: effect estimation and bias detection through Egger regression. Int. J. Epidemiol. 44: 512–525.
Bowden, J., M. Del Greco, F. Minelli, C. Davey, G. Smith et al., 2017 A framework for the investigation of pleiotropy in two-sample summary data Mendelian randomization. Stat. Med. 36: 1783–1802.
Burgess, S., 2017 Estimating and contextualizing the attenuation of odds ratios due to non-collapsibility. Commun. Stat. Theory Methods 46: 786–804.
Burgess, S. CRP CHD Genetics Collaboration, 2013 Identifying the odds ratio estimated by a two-stage instrumental variable analysis with a logistic regression model. Stat. Med. 32: 4726– 4747.
Burgess, S., and S. G. Thompson, 2015a Multivariable Mendelian randomization: the use of pleiotropic genetic variants to esti-mate causal effects. Am. J. Epidemiol. 181: 251–260.
Burgess, S., and S. G. Thompson, 2015b Mendelian
Randomiza-tion: Methods for Using Genetic Variants in Causal Estimation.
Chapman & Hall, Boca Raton, FL.
Burgess, S. and S. G. Thompson, 2017 Interpretingfindings from Mendelian randomization using the MR-Egger method. Eur. J. Epidemiol. 32: 377–389 (erratum: Eur. J. Epidemiol. 32: 391–392).
Burgess, S., and S. G. Thompson CRP CHD Genetics Collaboration, 2011 Avoiding bias from weak instruments in Mendelian ran-domization studies. Int. J. Epidemiol. 40: 755–764.
Burgess, S., A. Butterworth, A. Malarstig, and S. Thompson, 2012 Use of Mendelian randomisation to assess potential ben-efit of clinical intervention. BMJ 345: e7325.
Burgess, S., A. S. Butterworth, and S. G. Thompson, 2013 Mendelian randomization analysis with multiple genetic variants using summarized data. Genet. Epidemiol. 37: 658– 665.
Burgess, S., N. M. Davies, and S. G. Thompson EPIC-InterAct Con-sortium, 2014 Instrumental variable analysis with a nonlinear exposure–outcome relationship. Epidemiology 25: 877–885. Burgess, S., R. M. Daniel, A. S. Butterworth, and S. G. Thompson
EPIC-InterAct Consortium, 2015a Network Mendelian ran-domization: using genetic variants as instrumental variables to investigate mediation in causal pathways. Int. J. of Epidemiol. 44: 484–495.
Burgess, S., F. Dudbridge, and S. G. Thompson, 2015b Re:“ Mul-tivariable Mendelian randomization: the use of pleiotropic ge-netic variants to estimate causal effects.”Am. J. Epidemiol. 181: 290–291.
Burgess, S., R. A. Scott, N. J. Timpson, G. Davey Smith, and S. G. Thompson EPIC-InterAct Consortium, 2015c Using published data in Mendelian randomization: a blueprint for efficient iden-tification of causal risk factors. Eur. J. Epidemiol. 30: 543–552. Burgess, S., F. Dudbridge, and S. G. Thompson, 2016 Combining information on multiple instrumental variables in Mendelian randomization: comparison of allele score and summarized data methods. Stat. Med. 35: 1880–1906.
Collaborative Group on Hormonal Factors in Breast Cancer, 2012 Menarche, menopause, and breast cancer risk: individual participant meta-analysis, including 118964 women with breast cancer from 117 epidemiological studies. Lancet Oncol. 13: 1141–1151.
Davey Smith, G., and S. Ebrahim, 2003 ‘Mendelian randomiza-tion’: can genetic epidemiology contribute to understanding environmental determinants of disease? Int. J. Epidemiol. 32: 1–22.
Davey Smith, G., D. Lawlor, R. Harbord, N. Timpson, I. Dayet al., 2007 Clustered environments and randomized genes: a fun-damental distinction between conventional and genetic epide-miology. PLoS Med. 4: e352.
Day, F. R., D. J. Thompson, H. Helgason, D. I. Chasman, H. Finucane
et al., 2017 Genomic analyses identify hundreds of variants
as-sociated with age at menarche and support a role for puberty timing in cancer risk. Nat. Genet. 49: 834–841.
Eppinga, R. N., Y. Hagemeijer, S. Burgess, D. A. Hinds, K. Stefansson
et al., 2016 Identification of genomic loci associated with resting
heart rate and shared genetic predictors with all-cause mortality. Nat. Genet. 48: 1557–1563.
Greenland, S., 2000 An introduction to instrumental variables for epidemiologists. Int. J. Epidemiol. 29: 722–729.
Greenland, S., J. Robins, and J. Pearl, 1999 Confounding and collapsibility in causal inference. Stat. Sci. 14: 29–46.
Guo, Y., S. W. Andersen, X.-O. Shu, K. Michailidou, M. K. Bolla
et al., 2016 Genetically predicted body mass index and breast
cancer risk: Mendelian randomization analyses of data from 145,000 women of European descent. PLoS Med. 13: e1002105. Haycock, P. C., S. Burgess, K. H. Wade, J. Bowden, C. Reltonet al., 2016 Best (but oft-forgotten) practices: the design, analysis, and interpretation of Mendelian randomization studies. Am. J. Clin. Nutr. 103: 965–978.
Lawlor, D., R. Harbord, J. Sterne, N. Timpson, and G. Davey Smith, 2008 Mendelian randomization: using genes as instruments for making causal inferences in epidemiology. Stat. Med. 27: 1133–1163.
Locke, A. E., B. Kahali, S. I. Berndt, A. E. Justice, T. H. Perset al., 2015 Genetic studies of body mass index yield new insights for obesity biology. Nature 518: 197–206.
Michailidou, K., J. Beesley, S. Lindstrom, S. Canisius, J. Dennis
et al., 2015 Genome-wide association analysis of more than
120,000 individuals identifies 15 new susceptibility loci for breast cancer. Nat. Genet. 47: 373–380.
Pierce, B., and S. Burgess, 2013 Efficient design for Mendelian randomization studies: subsample and two-sample instrumental variable estimators. Am. J. Epidemiol. 178: 1177–1184. Thompson, S., and S. Sharp, 1999 Explaining heterogeneity in
meta-analysis: a comparison of methods. Stat. Med. 18: 2693– 2708.
VanderWeele, T., and S. Vansteelandt, 2009 Conceptual issues concerning mediation, interventions and composition. Stat. In-terface 2: 457–468.