LOCAL FAILURE MODES OF SC WALLS SUBJECTED TO IMPACTIVE
LOADING
Amit Varma1, Joo Min Kim2, Jungil Seo3and Jakob Bruhl4
1Professor, School of Civil Engineering, Purdue University, West Lafayette, IN, USA 2Ph.D. Candidate, School of Civil Engineering, Purdue University, West Lafayette, IN, USA 3 Research Engineer, School of Civil Engineering, Purdue University, West Lafayette, IN, USA 4 Assistant Professor, D/CME, U.S. Military Academy, West Point, NY, USA
ABSTRACT
Steel-plate composite (SC) walls are gaining momentum as an innovative system for design and construction of safety-related nuclear facilities due to their modularity and resistance to impactive and impulsive loading. Impactive design focuses on preventing perforation of the wall by the impacting missile. Once perforation has been prevented (through design), other local damage states such as punching shear failure, excessive deflection, and steel faceplate rupture need to be considered. Current approaches use single or two degree-of-freedom (SDOF or TDOF) models along with a static resistance function to estimate the maximum deflection and ductility demand on the wall if missile perforation is prevented. This paper focuses on numerically developing the static resistance function for SC walls, while simultaneously considering the ductility associated with local failure modes such as punching shear failure, flexural yielding followed by shear failure, and plastic mechanism formation. The paper details the development of 3D nonlinear finite element models of SC walls subjected to concentrated loading up to and beyond failure. The models account for various complexities of behavior including steel plate yielding and fracture, tie bar yielding and fracture, concrete cracking and crushing, and stud anchor slip capacity. The paper shows that for a given faceplate reinforcement ratio (4.3%), the local failure mode changes from punching shear failure to flexural yielding (followed by shear failure) to plastic mechanism formation as the tie bar (shear) reinforcement ratio increases (0.18 - 0.85%). The transitions in the local failure modes depend on the plastic strain demands and capacities in the components of the SC wall, namely, the steel plate, tie bar, and stud anchor. The paper identifies the future research path, and how the results can be used to design the preferred hierarchy of local failure modes.
INTRODUCTION
structures are known to achieve better resistance against blast and impact threat than RC structures (Bruhl and Varma, 2014; Tsubota, 1993).
A design methodology of SC walls subjected to missile impact was proposed by Bruhl et al. (2015a) to prevent perforation failure, and results from tests designed specifically to evaluate this design method have been conducted (Kim et al., 2017a). Even if perforation is prevented there are other potential failure modes that must be designed against: punching shear failure, excessive deflections and steel faceplate rupture. Additional research is needed to better understand these failure mechanisms. Kim et al. (2017b) investigated structural failure modes of SC walls when perforation due to missile impact is prevented. Successive failure modes were identified and categorized as punching shear failure, flexural yielding and plastic mechanism formation. To prevent punching shear failure and achieve flexural yielding or plastic mechanism formation, the authors recommended a minimum shear reinforcement ratio depending on the flexural reinforcement ratio of the wall. Bruhl et al. (2015b) proposed a method to obtain the static resistance function of SC walls for use in SDOF or TDOF analysis to estimate the maximum deflection of the wall when an impact load is applied. However, this static resistance function depends on the expected failure mode and the method in Bruhl et al. (2015b) is only applicable when the failure mode is close to plastic mechanism formation.
In this paper, a novel approach to generate static resistance functions with regards to failure criteria of constituent components such as steel faceplates, tie bars, and steel-headed shear stud anchors is proposed. Investigating plastic strain of the steel faceplates and tie bars, and interfacial shear slip of the steel-headed shear stud anchors allows the engineer to select the most appropriate cutoff limit state on the load-displacement curve consequently providing the corresponding resistance function of an SC wall. Detailed procedures to determine the resistance function are discussed. A representative resistance function is presented with corresponding limit states annotated.
METHODOLOGY
Numerical Model Development
A numerical approach was applied to further investigate the local failure modes of SC walls. SC walls were modelled using the finite element (FE) method based on a benchmarked procedure in the literature (Bruhl et al., 2015b) and simulated with quasi-static pressure load applied. LS-DYNA (Hallquist, 2006), a general-purpose commercial finite element analysis software, was used to implement this study.
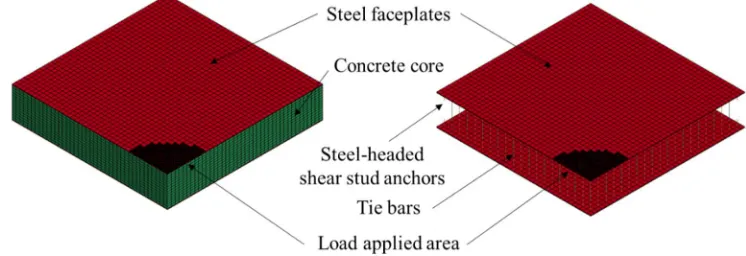
The FE model of an SC wall consists of front and rear steel faceplates, tie bars, steel-headed shear stud anchors and concrete core as presented in Figure 1. The front and rear steel faceplates were modelled using solid elements with fully integrated and selectively reduced solid elements which are intended for elements with poor aspect ratios (ELFORM: -1). It uses eight integration points and reduces shear locking phenomenon for poor aspect ratio elements. Piecewise linear plasticity (MAT_24) material type was adopted to represent material properties for the steel faceplates.
Tie bars and steel-headed shear stud anchors were implemented as beam elements with Hugh-Liu beam with cross section integration which uses 2 x 2 Gauss quadrature rule for its integration (ELFORM: 1). The piecewise linear plasticity model (MAT_24) was used for tie bars and stud anchors to account for the non-linear plastic behavior of the steel material. Because the steel-headed shear stud anchors were simplified as beam elements in the finite element model, the load-slip behavior (Ollgaard et al., 1971) which acts parallel to the steel faceplates is not inherently included. Therefore, a discrete beam element (ELFORM: 6) was added between the steel faceplates and the steel-headed shear stud anchors to account for load-slip behavior of the steel-headed shear stud anchors. The maximum tensile displacement value was calculated using Equation 1 (Shim et al., 2004).
(
0
.
48
0
.
029
f
c')
d
smax
=
-D
(1)Load-slip behavior of the steel-headed shear stud anchors was applied to the model using both Equation 2 (Ollgaard et al., 1971) and Equation 3 (AISC, 2010).
Q
=
Q
(
1
-
e
-18D)
2/5n (2)
Q
n=
0
.
65
A
sf
u (3)The concrete core was modeled using solid elements with element formulation of 1 (ELFORM: 1). This formulation is an eight-node constant stress solid element with single integration point. Winfrith concrete with no strain rate effect included (MAT_85) was selected as the material type for the concrete core. The steel faceplates and the concrete core are physically contacting each other in the SC walls. A penalty-based contact approach (AUTOMATIC_SURFACE_TO_SURFACE with SOFT = 0) was used to implement contact between the front and rear steel faceplates and the concrete core. The steel-headed shear stud anchors and the tie bars are embedded in the concrete core of SC walls. Perfect bond among them was assumed and it was implemented by using command of CONSTRAINED_LAGRANGE_ IN_SOLID. Belytschko-Bindeman hourglass type (TYPE 6) with hourglass coefficient setting of 0.1 was used to control hourglass effects. Pressure load was applied on the partial circular area of the quarter model of SC wall as shown in Figure 1.
Parametric Studies
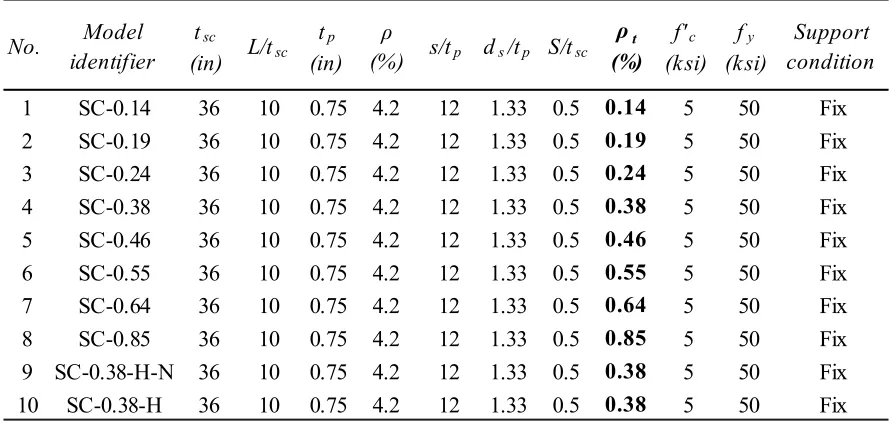
A set of numerical analyses were conducted to investigate (i) local failure modes of SC and (ii) the effects of failure criteria of constituent components on the SC wall load-displacement curve. Table 1 shows the details of the SC walls used in this parametric study. For model numbers 1 to 8, the flexural reinforcement (ρ = two times the faceplate thickness / total section depth) was set to 4.2%, and shear reinforcement (ρt=
For model number 9, flexural reinforcement ratio and shear reinforcement ratio were the same as model number 4, however, no failure criteria were defined for this numerical model: no failure strain for the steel faceplates and the tie bars, and no tensile slip displacement for the stud anchors. Hourglass control was modified to Flanagan-Belytschko stiffness form (TYPE 4) with hourglass coefficient of 0.01 was used to overcome numerical instability. Model number 10 has the same wall design configuration with number 4. However, they used the identical hourglass control option as model number 9 to observe any influence of the different hourglass control forms. The model identifier in Table 1 consists of up to four terms which indicate SC walls with ρt, applied hourglass control type, and applied failure criteria. For example,
SC-0.38-H-N means SC wall with ρtequal to 0.38%, hourglass control type was changed from TYPE 6 to TYPE
4, and no failure criteria was applied.
Table 1 Details of numerical models in the parametric studies
RESULTS AND DISCUSSION
Influence of Shear Reinforcement Ratio on Local Failure Mode
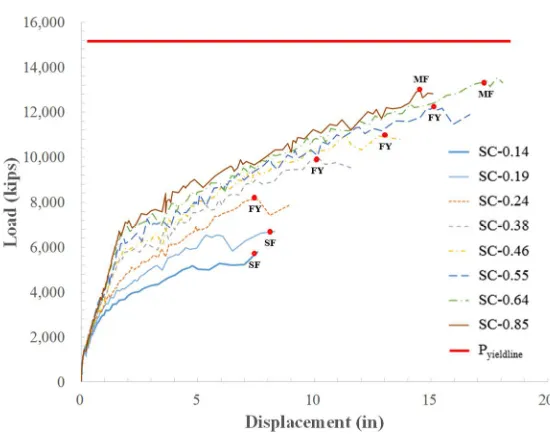
Results from model numbers 1 to 8 demonstrate the influence that shear reinforcement ratio has on local failure modes. Each of these walls had the same flexural reinforcement (4.2%). The load-displacement curves for each model are presented in Figure 2.
No. Model
identifier tsc
(in) L/tsc tp
(in) ρ
(%) s/tp ds/tp S/tsc ρt (%) f'c (ksi) fy (ksi) Support condition
1 SC-0.14 36 10 0.75 4.2 12 1.33 0.5 0.14 5 50 Fix
2 SC-0.19 36 10 0.75 4.2 12 1.33 0.5 0.19 5 50 Fix
3 SC-0.24 36 10 0.75 4.2 12 1.33 0.5 0.24 5 50 Fix
4 SC-0.38 36 10 0.75 4.2 12 1.33 0.5 0.38 5 50 Fix
5 SC-0.46 36 10 0.75 4.2 12 1.33 0.5 0.46 5 50 Fix
6 SC-0.55 36 10 0.75 4.2 12 1.33 0.5 0.55 5 50 Fix
7 SC-0.64 36 10 0.75 4.2 12 1.33 0.5 0.64 5 50 Fix
8 SC-0.85 36 10 0.75 4.2 12 1.33 0.5 0.85 5 50 Fix
Figure 2 Load-displacement curve of SC walls for ρ equal to 4.2% and ρt increasing from 0.14% to 0.85%
As shown, when ρtwas less than or equal to 0.19%, shear failure occurred, annotated with “SF” on the
load-displacement curve at its maximum load carrying capacity. In these cases, as shown in Figure 3, tie bars fractured prior to steel faceplates yielding. Figure 3 shows detailed local failure behavior of SC walls which failed in punching shear: the deformed shape of the steel faceplates is evident and ruptured tie bars are highlighted (note the concrete elements were removed for clarity).
Figure 3 Local failure mode of SC walls: punching shear failure (model number 2, concrete core was omitted and beam elements were volumized for clarity)
For walls with ρtgreater than or equal to 0.64%, a plastic mechanism formation was observed, annotated
SC wall failed with plastic mechanism formation. The steel faceplates were yielded and deflection was severe but the tie bars which worked as out-of-plane shear reinforcement did not fracture.
Figure 4 Local failure mode of SC walls: plastic mechanism formation (model number 7, concrete core was omitted and beam elements were volumized for clarity)
When ρtis between 0.24% and 0.55%, flexural yielding of the steel faceplates was observed, annotated with
“FY” on the load-displacement curve at its maximum load carrying capacity. In these cases, as depicted in Figure 5, tie bars fractured after the steel faceplates had significant yielding, but before plastic mechanism could develop.
Influence of Failure Criteria Definition on SC Wall Resistance Function
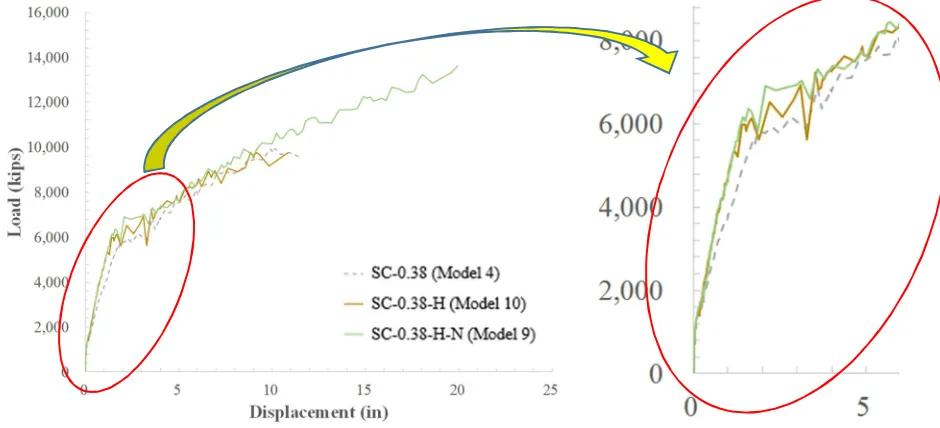
Results from three finite element models were compared to i) evaluate the effect of hourglass energy control type, and ii) investigate the effect of failure criteria for the steel faceplates, the tie bars, and the steel-headed shear stud anchors on the resulting resistance function of an SC wall. Figure 6 compares the load-displacement curves from numerical models of number 4, 9 and 10. Each of these walls have the same flexural reinforcement (4.2%) and shear reinforcement (0.38%). Model number 4 with this cross-section configuration resulted in flexural yielding limit state as illustrated in Figure 2. Model number 9 did not have any failure criteria defined and the hourglass control options were revised to overcome instabilities in the analysis. In model number 10, everything was identical to model number 4 except the hourglass control options were revised to the same as model number 9.
In Figure 6, the analysis results from model number 4 and 10 showed almost same yield displacement (1.4 inches) and slightly different yield load (5700 kips and 6000 kips, respectively). Also, they illustrated almost same ultimate displacement (11 inches) and maximum load carrying capacity (9800 kips). There was no significant difference in pre- (less than 6%) and post-yield stiffness between them and it could be said that the effect of the hourglass control options is negligible. The analysis result from model number 9 showed that the curve had nearly identical pre- and post-yield stiffness and yield load as model number 10 but had much larger ductility and load carrying capacity. In fact, the load capacity was comparable to plastic mechanism failure cases in Figure 2.
Figure 6 Load-displacement curves of SC walls from numerical models of number 4, 9 and 10
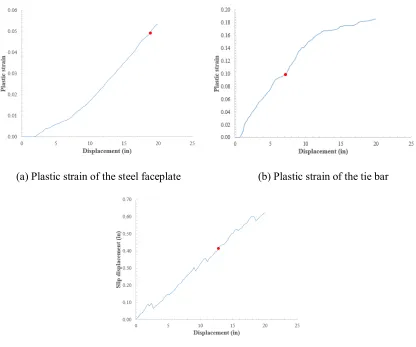
of the headed stud anchors. If the failure criterion was selected as 0.42 inches, the resistance function would terminate at 12.8 inches of displacement (about 11500 kips of load).
(a) Plastic strain of the steel faceplate (b) Plastic strain of the tie bar
(c) Slip displacement of the steel-headed shear stud anchor
Figure 7 Plastic strain of the steel faceplates and tie bars, and slip displacement of the steel-headed shear stud anchors
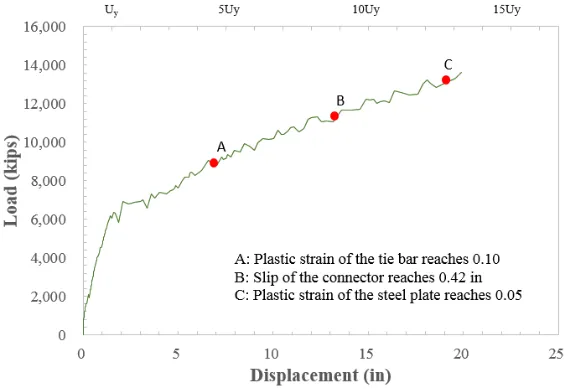
Figure 8 shows the representative load-displacement curve for an SC wall (model number 9) on which the three critical limit states were marked: plastic strain of 0.05 for the steel faceplates and 0.10 for the tie bars, and slip displacement of 0.42 in. for the steel-headed shear stud anchors (the same points described above and drawn from Figure 7). Design engineers may decide to terminate the load-displacement curve corresponding with a specific failure criteria and use it as the resistance function according. Doing so, permits the engineer to better understand governing failure mode and the corresponding available ductility as indicated on the horizontal axis at the top of Figure 8 (Uyindicates the yield displacement). For this
Figure 8 A representative resistance function on which critical events were marked
CONCLUSION
A series of numerical analyses were performed to evaluate the local failure modes of SC walls subjected to missile impact. For a constant flexural reinforcement ratio three successive local failure modes were observed: punching shear failure, flexural yielding and plastic mechanism formation failure as the shear reinforcement ratio increased (Kim et al. 2017b). Punching shear failure resulted in small ductility (<5) and under developed load capacity (<0.5 of Pyieldline) with tie bars fractured before the steel faceplates yielded.
Plastic mechanism formation failure showed large ductility (>10) and load carrying capacity comparable to the value from yield line analyses. When the out-of-plane shear reinforcement ratio is between the values from shear failure cases and plastic mechanism formation cases, flexural yielding failure mode occurred with tie bars ruptured after the steel faceplate yielded.
An innovative approach was proposed to generate resistance function of SC walls for use in SDOF or TDOF analysis. Using a finite element model with no failure criteria defined made it possible to obtain a load-displacement curve and additional analysis results could be used to investigate the influence of various failure criteria: plastic strain history of the steel faceplates and tie bars, and slip displacement history of the steel-headed shear stud anchors. Based on this analysis, the engineer can specify design parameters to ensure ductility and / or load demands are met. The result is a resistance function of the SC wall which is based on appropriate failure criteria of constituent components of the wall.
REFERENCES
DCD (2011), Design Control Document for the AP1000, U.S. Nuclear Regulatory Commission, Washington, DC.
Malushte, Sanjeev R., and Varma, Amit H. (2015) “Rethinking Steel-Plate Composite (SC) Construction for Improved Sustainability and Resiliency of Nuclear Power Plant Structures.” Nuclear Power International Magazine,Tulsa, Oklahoma.
Schlaseman, Caroline. (2014) “Application of Advanced Construction Technologies to New Nuclear Power Plants (MPR-2610, Revision 2).” Washington, D.C.
Bruhl, Jakob C., and Varma, Amit H. (2014) “Preliminary Study of Blast Response of Steel Plate-Reinforced Concrete Walls.” Structures Congress 2014, 1403-1414, Boston, Massachusetts.
Tsubota, H., Y. Kasai, N. Koshika, H. Morikawa, T. Uchida, and T. Ohno. (1993) “Quantitative Studies on Impact Resistance of Reinforced Concrete Panels with Steel Liners under Impact Loading Part 1: Scaled Model Impact Tests.” 12th International Conference on Structure Mechanics in Reactor Technology (SMiRT-12), 169–174, Stuttgart, Germany.
Kim, J. M., Bruhl, J., Seo, J., and Varma, A. (2017a). “An Overview of Missile Impact Tests on Steel-Plate Composite (SC) Walls.” Structures Congress 2017, 245-255, Denver, Colorado.
Bruhl, J. C., Varma, A. H., and Johnson, W. H. (2015a). “Design of composite SC walls to prevent perforation from missile impact.” International Journal of Impact Engineering, Elsevier Ltd, 75, 75–87.
Bruhl, J. C., Varma, A. H., and Kim, J. M. (2015b). “Static resistance function for steel-plate composite (SC) walls subject to impactive loading.” Nuclear Engineering and Design, Elsevier B.V., 295, 843–859.
Hallquist, J. (2006). LS-DYNA theory manual. Livermore Software Technology Corporation, Livermore Technology Software Corporation, Livermore, CA.
Ollgaard JG, Slutter RG, Fisher JW. (1971) “Shear strength of stud connectors in lightweight and normal-weight concrete.” AISC Eng J 1971:55e64.
Kim, J. M., Bruhl, J., Seo, J., and Varma, A. (2017b). “Preliminary Investigation of Local Failure Modes in Steel-Plate Composite Walls Subjected to Missile Impact.” Structures Congress 2017, 256-261, Denver, Colorado.
AISC. (2015). “Specification for Safety-Related Steel Structures for Nuclear Facilities Including Supplement No. 1 (ANSI/AISC N690s1-15).” American Institute of Steel Construction, Chicago.
Shim, C. S., Lee, P. G., Yoon, T.Y. (2004) “Static behavior of large stud shear connectors.” Engineering Structures 2004, 26(12):1853e60.