DOI: 10.1534/genetics.106.062406
The Distribution of Beneficial Mutant Effects Under Strong Selection
Rowan D. H. Barrett,
1Leithen K. M’Gonigle and Sarah P. Otto
Zoology Department, University of British Columbia, Vancouver, British Columbia V6T 1Z4, Canada
Manuscript received June 22, 2006 Accepted for publication September 23, 2006
ABSTRACT
For a general theory of adaptation, it is essential to know the distribution of fitness effects of beneficial mutations. Recent theoretical and empirical studies have made considerable progress in determining the characteristics of this distribution. To date, the experiments have largely verified the theoretical pre-dictions. Despite the fact that the theoretical work has assumed small selection coefficients, strong selection has been observed in some experiments, especially those involving novel environments. Here, we derive the distribution of fitness effects among fixed beneficial mutants without the restriction of low selection coefficients. The fate of strongly favored alleles is less affected by stochastic drift while rare, causing the distribution of fitness effects among fixed beneficial mutations to reflect more closely the distribution among all newly arising beneficial mutations. We also find that when many alleles compete for fixation within an asexual population (clonal interference), the beneficial effects of a newly fixed mutant cannot be well estimated because of the high number of subsequent mutations that arise within the genome, regardless of whether selection is strong or weak.
P
OPULATIONS adapt to their environments through the appearance and subsequent spread of random beneficial mutations. In a sexual population, recombi-nation can bring together beneficial mutations that arise in different lineages. In asexual populations, how-ever, mutations can fix only sequentially (Novick and Szilard1950; Atwoodet al.1951; Crowand Kimura 1965). Distinct genotypes cannot recombine and in-stead must compete with each other, a phenomenon known as ‘‘clonal interference’’ (Gerrishand Lenski 1998; Miralleset al.1999;deVisserand Rozen2006). Thus, for a mutation to contribute to adaptation it not only must escape sampling error (drift), but also must fix before being eliminated by the occurrence and more rapid sweep of a superior mutation.Theory for determining the probability that selection will fix a new favorable mutation was first formulated 80 years ago by Fisher(1922, 1930) and Haldane(1927), who focused on the fate of a single isolated mutation. In a recent flurry of articles, researchers have explored the distribution of fitness effects expected among the array of possible beneficial mutations that might arise within a population (Gillespie 1983, 1984, 1991; Orr 2002, 2003). This distribution can be seen as the starting point for progress toward a general theory of adaptive evo-lution. From this first distribution, we can determine the distribution of those mutations not lost by drift, referred to as ‘‘contending mutations’’ (Gerrish and
Lenski1998; Rozenet al.2002). The distribution of con-tending mutations can subsequently be used to deter-mine the distribution of mutations that outcompete other genotypes and fix in a population (‘‘fixed muta-tions’’), thus contributing to adaptation (Orr 1998; Rozenet al.2002).
In addition to theory, recent empirical studies have examined the steps from newly arisen mutations, to con-tending mutations, to fixed mutations. The underlying distribution of fitness effects of new beneficial mutations inferred from experiments is generally consistent with an exponential distribution (Imhofand Schlotterer 2001; Rozenet al.2002; Sanjuanet al.2004; Kassenand Bataillon2006), while the final distribution of fixed beneficial mutants appears roughly bell-shaped (Rozen et al. 2002; Rokyta et al. 2005; Barrett et al. 2006). These empirical results must be interpreted cautiously, however, as there is typically little power to reject other distributions (e.g., more L-shaped or more bell-shaped distributions, see Kassenand Bataillon2006).
An important caveat to the theoretical side of this work, however, is that it has assumed weak selection. R. A. Fisher (Fisher1930) first justified this assumption using the analogy of movement from the outer surface of a sphere (representing phenotype space) to an op-timum at the center; Fisher argued that mutations of small size have a 50% chance of bringing the population closer to the optimum, while larger mutations have a rapidly diminishing probability of being advantageous. This argument led to a ‘‘gradualist’’ view of adaptation, in which evolutionary change overwhelmingly proceeds through the selection of very slightly beneficial alleles
1Corresponding author: Zoology Department, University of British
Columbia, 6270 University Blvd., Vancouver, BC V6T 1Z4, Canada. E-mail: [email protected]
(Orr2005). Assumptions of weak selection common to all diffusion equations and many other theoretical ap-proaches make it difficult to predict the dynamics of strongly beneficial mutations (Morjanand Rieseberg 2004). Simulations have demonstrated that although fixation times for strongly advantageous alleles are ac-curately predicted by diffusion, the probability of fix-ation is underestimated as the strength of selection increases (Whitlock2003).
In recent empirical studies, researchers have ob-served mutations with very high selection coefficients (Bullet al.2000; Barrettet al.2006), especially when organisms face novel environments. Strong selection has an important impact on the theory of adaptation. In particular, the fixation probability of mutations and the number of competing mutations will be highly depen-dent on the fitness effect of the mutation in question (Rozen et al.2002). When selection is assumed to be weak, new mutations remain at low frequency for a considerable period of time before reaching fixation (Gerrishand Lenski1998). This provides ample op-portunity for beneficial mutations to be lost and for competing mutations to arise (Gerrish 2001). In con-trast, when selection is strong, the probability of fixation approaches its maximum value of one and the time to fixation is relatively short, reducing the number of competing mutations and the importance of clonal interference. Yet previous predictions cannot be ap-plied to the case of strong selection, because of the pervasive theoretical assumption that selection is weak. Here, we derive population genetic theory to describe the impact of drift and clonal interference on the fit-ness distribution of fixed beneficial alleles without the assumption of weak selection. We derive these distribu-tions for a wide range of selection coefficients and test our analytical theory against numerical simulations.
THE MODEL
In the following, we describe the probability density functions (pdfs) of the selection coefficient,s, among newly arising beneficial mutations, contending benefi-cial mutations, and fixed benefibenefi-cial mutations. Follow-ing Rozenet al.(2002), we denote these pdfs asf(s),g(s), andh(s), respectively. Where needed, we use uppercase letters to refer to the corresponding cumulative density functions (cdfs) [F(s), G(s), and H(s), respectively]. Throughout, we assume that the population size is large, haploid, and asexual. The results may be applied to asexual diploids by replacingswithh s, where his the dominance coefficient and mutations are assumed to fix in the heterozygous condition. An extension to sexual diploids is straightforward (at least numerically), but it requires that the joint distribution ofhandsbe specified. The distribution of beneficial mutations:It is gener-ally assumed that the wild type has very high fitness and
almost all mutations are deleterious (Gillespie 1983, 1984; Orr 1998). It follows that beneficial mutations will lie in the extreme right tail of a distribution of all mutant fitness effects. This inference justifies the ap-plication of extreme value theory (Gumbel 1958) to describe the distribution of beneficial mutant effects. Extreme value theory suggests that the distribution of mutant effects, restricted to beneficial mutations, will be nearly exponential (Gillespie1983, 1984). This re-quires, however, that only a tiny minority of mutations are beneficial. In very harsh or novel environments, mu-tations that were previously deleterious may become beneficial, thus increasing the size of the beneficial mutant class. In these situations, extreme value theory may not hold and an exponential distribution might not be an adequate description of the selective effects of new mutants.
While empirical and theoretical studies indicate that the exponential distribution is a plausible distribution describing the fitness effects of new beneficial muta-tions, distributions with other shapes cannot be rejected and might be more appropriate under certain circum-stances. Thus, to allow greater flexibility, we assume that the selection coefficients of new beneficial mutants,s, follow a gamma distribution with mean selection co-efficient,s, and coefficient of variation, cv,
fðsÞ ¼e
s=ðcv2sÞ
ðcv2sÞ1=cv2
s111=cv2
G½1=cv2 ; ð1Þ
whereG[a] is Euler’s gamma function. The shape of the gamma distribution varies from L-shaped (high cv) to bell-shaped (low cv), allowing a broader range of dis-tributions to be described. The exponential distribution represents a specific case of the gamma where the co-efficient of variation equals one.
The distribution of contending beneficial mutations: We begin by deriving the distribution of fitness effects among those contending mutations that survive sto-chastic loss while rare. Haldane(1927) used a branch-ing process to show thatP, the probability of fixation, satisfies 1P¼e(11s)P
in populations of constant size when the number of offspring per parent is Poisson distributed. Using a diffusion approximation, Kimura (1957, 1964, 1983) extended this theory for populations of finite size,N, showing thatP ð1e2sÞ=1e2NsÞ.
For weak selection (1/N>s>1), both of these equa-tions yield the same approximate fixation probability: P 2s. When strong selection is possible, however, a more accurate approximation for both equations is:P ¼
1e2s, obtained by lettingNget large in the diffusion
loss while rare, not the ultimate fixation probability, which depends on the nature of future mutations.
Because newly arisen mutations have a probability of surviving stochastic loss while rare of1e2s
in pop-ulations of large size, the distribution of selection co-efficients among contending mutations becomes
gðsÞ ¼ fðsÞð1e
2sÞ
Ð
fðsÞð1e2sÞds: ð2Þ The denominator represents the probability of surviv-ing drift averaged across the distribution of new mu-tational effects,P:
P¼
ð
fðsÞð1e2sÞds
¼1 ð112 cv2sÞ1=cv2
: ð3Þ
Using this result the pdf of the selection coefficients among contending mutations is
gðsÞ ¼e
s=ðcv2sÞ
ðcv2sÞ1=cv2
s111=cv2ð1e2sÞ G½1=cv2ð1 ½112 cv2s1=cv2
Þ : ð4Þ
Because the probability of surviving loss while rare,P¼
1e2s, asymptotes at one (Figure 1), the distribution
g(s) is similar to the prior distributionf(s) for mutations of large effect.
The distribution of fixed beneficial mutations:Rozen et al.(2002) defined the expected number of contend-ing mutations ariscontend-ing within other genetic backgrounds before the fixation of a focal mutation as
lðsÞ ¼PNmT
2; ð5Þ
where P is the average probability of surviving loss while rare,Nis the population size,mis the beneficial mutation rate, and T is the average amount of time until fixation (the1
2reflects the fact that, by symmetry, half of the population will not carry the focal mutation when averaged over the period of time during which the focal mutation rises from a single copy to fixation; see supplemental Figure 1 at http://www.genetics.org/ supplemental/). Rozen et al. (2002) then calculated
lðsÞunder the assumption of weak selection. To relax this assumption, we use the general solution for the deterministic haploid model, q(t)/p(t)¼ (11s)t
q(0)/ p(0), where p(t) and q(t) are the frequencies of non-mutant and non-mutant individuals, to solve for the time taken for an allele initially at frequency 1/N to reach a frequency of 11=N: This gives T ¼2 lnðN 1Þ=
lnð11sÞ 2 lnðNÞ=lnð11sÞ, which can be used along withP ¼1e2sin (5) to estimate the number of
con-tending mutations:
lðsÞ ð1e2sÞNm lnðNÞ
lnð11sÞ: ð6Þ
When there are n contending mutations and one focal mutation, each with a selection coefficient drawn from a cdf given by G(s), the cumulative density func-tion of the highest of the selecfunc-tion coefficients isG(s)n11 (Rice1988). Assuming that the number of contending mutations that appear during the spread of a focal mutation follows a Poisson distribution, with meanl(s), the cdf for the selection coefficient of the most ad-vantageous of the contending and focal mutations is
HðsÞ ¼NNmk=lnð11sÞ 1k P
; ð7Þ
wherePis the average probability of fixation (Equation 3) and
k¼G½1=cv
2;s=ðscv2Þ
G½1=cv2
ð1PÞG½1=cv
2;sð1PÞcv2
=ðscv2Þ
G½1=cv2 : ð8Þ
If newly arising beneficial mutations follow an expo-nential distribution (cv¼1), these coefficients simplify to
P¼ 2s
112s and k¼e
s=se 2ss=s
112s:
This equation accounts only for contending mutations that arise after the focal mutation, as no improvement in fit was observed when accounting for prior mutations (data not shown). (Essentially, we consider the first contending mutation to be the focal mutation.) The corresponding probability density function for fixed mutations is thenhðsÞ ¼dHðsÞ=ds.
Figure1.—The probability of fixation for a beneficial
mu-tation as a function of its selection coefficient. The dots show the probability of fixation of a single mutant with a given se-lection coefficient in Wright–Fisher simulations of a large pop-ulation (N¼106; based on 1000 replicates). The solid curve
shows the exact fixation probability derived by Haldane
NUMERICAL SIMULATIONS
We compare the above analysis to explicit numerical simulations using a Wright–Fisher model (Ewens1979). We tracked all beneficial mutants segregating in an asexual haploid population of constant size N until a fixation event. Each generation, the number of new mutations appearing within the population was drawn at random from a Poisson distribution with meanNm. Each mutation was then randomly assigned a selection coefficient drawn from a gamma distribution with mean
sand coefficient of variation cv and assigned a unique identifier. Multiple mutations had independent effects on fitness (no epistasis on a multiplicative scale). Off-spring were then sampled with replacement according to a multinomial distribution from the parental distri-bution of genotypes, weighted by the fitness of these genotypes. A fixation event was defined as the first point in time when all individuals in the population shared a common mutation (with the same identifier). Similar results were obtained when we recorded data for the fifth mutation rather than the first mutation to fix (data not shown). At this point, the process was stopped and the selection coefficient of the fixed mutant was re-corded. This selection coefficient was defined as the fitness effect of the fixed mutant when placed in the an-cestral background; the average fitness within the pop-ulation at the time of fixation was also recorded.
To evaluate the robustness of the analytical results, we ran simulations with every combination of the follow-ing average selection coefficients (s¼ 0.01, 0.1, 1, 2, and 10), beneficial mutation rates (m¼105, 107, and 109), population sizes (N ¼ 105, 106, and 107), and coefficients of variation (cv¼0.5, 1, and 2). Simulations were carried out in Mathematica (WolframResearch 2005; available upon request).
NUMERICAL RESULTS
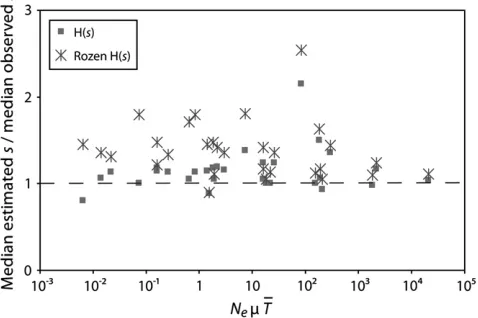
The numerical simulations closely match the predic-tions from our model across the parameter range
ex-plored (Figure 2). In contrast, analyses based on weak selection (Rozen et al.2002) consistently overestimate the selection coefficient among fixed mutations (Figure 2). Assuming a fixation probability of 2sgives unrealis-tically high fixation probabilities for mutants with large selection coefficients, which inflates the proportion of contending and fixed mutations of large effect.
Both analytical and numerical results predict bell-shaped distributions for the selection coefficients among fixed beneficial mutations (Figure 3). The distribution of contending mutations, g(s) (thin solid curves), is always bell-shaped because weakly selected mutations are likely to be lost while rare (Kimura1983). With a low mutation rate (Figure 3, A and B), the distribution of fixed mutations (histogram) is very nearly equal to the distribution of contending mutations,g(s), and clonal interference has little effect. With a higher mutation rate (Figure 3, C and D), clonal interference becomes more important, and only the most fit of the contend-ing mutations fixes within the population, shiftcontend-ing the distribution of fixed mutations to the right. When se-lection is, on average, stronger (Figure 3, B and D), mutations are less likely to be lost through stochastic drift while rare, causing the distribution of fixed bene-ficial mutations to be more similar to the distribution of selection coefficients among newly arising mutations, f(s) (dotted curves); consequently, the mean and co-efficient of variation among mutations that fixed in the simulations are more similar to the original mean, s, and cv (inset boxes). The shape of the contending and fixed distributions is also influenced by the shape of the distribution of underlying beneficial mutations (supplemental Figure 2 at http://www.genetics.org/ supplemental/). Increasing the coefficient of variation of beneficial mutations results in more contending mu-tations of large and small effect, increasing the varia-tion observed among fixed mutavaria-tions.
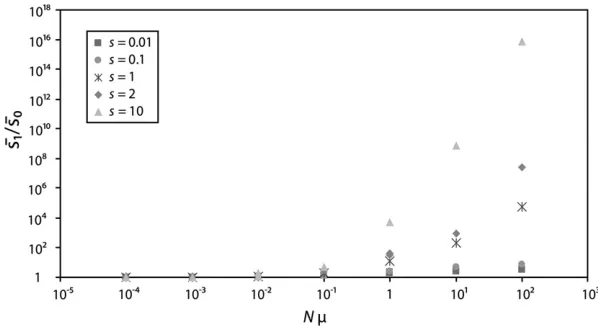
If there is a high input of new mutations, it becomes more likely for several beneficial mutations to coexist in a population. This leads to clonal interference, as beneficial mutations in different genetic backgrounds
Figure 2.—Median selection coefficient of
fixed beneficial mutations estimated from analyt-ical resultsvs.numerical simulations. Median es-timatedsis given from the results of either our generalized selection model, given by H(s) in Equation 7, or a model assuming weak selection and a cv of 1 (Equation 2 in Rozenet al. 2002).
compete with one another. In addition, however, a high mutation rate also makes it more likely that multiple beneficial mutations will arise in the same background as previous beneficial mutations. In this case, several beneficial mutations can assist each other’s spread to fixation, and the combined fitness advantage from these mutations will be higher than the fitness advantage conferred by the single original mutation. To assess the importance of assisted fixation, we measured the aver-age fitness advantaver-age in the population at the time a beneficial mutation fixed (relative to the nonmutant ancestor). The average fitness advantage was greater than the fitness advantage conferred by the mutation alone (Figure 4), often by orders of magnitude when the mutation rate was high enough to expect clonal in-terference (Nm.1). As expected, this discrepancy was caused by the effects of additional beneficial mutations segregating within the population at the time of fixation. We have so far assumed a constant population size, but many experiments designed to detect beneficial mutations involve repeated bottlenecks and a fluctuat-ing population size. Such fluctuations dramatically in-crease the chance of loss of beneficial mutations, so that only the most favorable alleles are likely to fix. In the appendix we modify the theory developed above to describe how fluctuating population size alters the fix-ation probability and the time to fixfix-ation. We then es-timate the number of competing mutations,lðsÞ, and the distribution of fixed mutations,h(s).
DISCUSSION
On the basis of his geometric model of the adaptive process, Fisher (1930) argued that mutations of very small effect have a nearly 50% chance of pointing toward an optimum, while mutations of very large effect rarely will. This reasoning underlies the common assumption in population genetics that adaptation consists of fine tuning the phenotype with mutations of relatively small effect. What constitutes a large mutation in Fisher’s model depends, however, on the fitness of the original population. If a population is initially poorly adapted (e.g., following a recent change in the environment), even major mutations with a substantial effect on phe-notype have a nearly 50% chance of pointing toward the optimum. Thus, strongly selected mutations may very well contribute to the process of adaptation, especially during the early stages of adaptation to a novel envi-ronment. Furthermore, by virtue of their size, large-effect mutations will have a disproportionate influence on the process of adaptation. Data from genetic analyses of quantitative trait differences (Bradshawet al.1998; Wanget al.1999; Colosimo et al. 2005) and from ex-perimental evolution studies (Bullet al.2000; Barrett et al. 2006) confirm that mutations with large pheno-typic and fitness effects can occur and contribute to the process of adaptation. In this article, we have general-ized existing theory about the distribution of fitness effects among fixed beneficial mutations so that it can be applied to situations with strong selection.
Figure 3.—Distribution of
fit-ness effects. The histogram was generated from the fitness effects of fixed beneficial mutations among 1000 replicate simulations; fixed mutations have a higher average selection coefficient and exhibit less variation than newly arising mutations (inset boxes). New mutations were distributed according to an exponential distri-bution, f(s) (thin dotted curve). Contending mutations that sur-vived loss while rare (thin solid curve) are shifted to the right [g(s) from Equation 4]. Fixed mu-tations (thick solid curve) that sur-vived clonal interference are even further shifted to the right [h(s) from the derivative of Equation 7] but not as much as predicted us-ing the weak selection approxima-tion given by Equaapproxima-tion 2 of Rozen et al. (2002) (thick dashed curve). Clonal interference is more impor-tant in C and D, where mutation rates are higher (A and B, m ¼ 107; C and D,m¼105). Selection
The distribution of fitness effects among fixed bene-ficial mutations is generally derived from the distribu-tion of fitness effects among all possible beneficial mutations, about which little is known. Several theoret-ical studies have suggested that new beneficial muta-tions should be exponentially distributed (Mukaiet al. 1972; Orr1998; Rozenet al.2002; Wilke2004), on the basis of the fact that beneficial mutations represent the tail of the distribution of potential mutant effects (Gillespie1983, 1984). In a novel environment, how-ever, more mutations are likely to be beneficial and the applicability of such extreme value theory is uncertain. We have thus employed a gamma distribution to describe the fitness effects of possible beneficial mutations. Be-cause the gamma distribution has two parameters (de-scribed by the mean selection coefficient, s, and the coefficient of variation, cv), we can explore a broader range of possible distributions of mutational effects. We find that the shape parameter of the gamma distribu-tion among newly arising mutadistribu-tions influences the dis-tribution of mutations that survive stochastic loss while rare (contending mutations) and the distribution of mutations that survive clonal interference to become fixed (fixed mutations), especially when selection is strong (supplemental Figure 2 at http://www.genetics. org/supplemental/). This result appears to contradict a recent study, which reported that the distribution of mutational sizes for fixed mutations is virtually inde-pendent of the underlying distribution of beneficial mutations (Orr1998; Hegrenesset al.2006). The sim-ulations run by Hegrenesset al.(2006) cover only a range of parameters, within which clonal interference is severe (the population size was set to 23106and the mutation
rate was 105). Indeed, using their combination of param-eter values in Equation 7 indicates that the shape of the distribution of fixed beneficial mutations is nearly in-dependent of the shape of the distribution of newly arising beneficial mutations. Furthermore, using their parameters, most fixed mutations have similar selec-tion coefficients, as pointed out by Hegreness et al. (2006), unlike the fairly broad distributions observed in Figure 3.
Beneficial mutations that survive stochastic loss while rare tend, on average, to have a larger fitness benefit, and their distribution tends to have a lower coefficient of vari-ation (more bell-shaped), because very weakly selected alleles are unlikely to fix (Kimura 1983; Gerrish and Lenski1998; Orr2000; Ottoand Jones2000; Rozen et al.2002; Wilke2004). While this is generally true, the effect is less pronounced when selection is strong. That is, the distribution of fixed beneficial mutations is more sim-ilar to the distribution of newly arising mutations (Figure 3). Consequently, for empirical data involving high lection coefficients, using theory that assumes weak se-lection will tend to underestimate the mean sese-lection coefficient among newly arising beneficial mutations.
One of the major impediments to theoretical studies of the distribution of fitness effects of fixed beneficial mutations has been a lack of knowledge of realistic pa-rameter values. This is largely because the low frequency of fixed beneficial mutations has prevented empirical work with statistical power. In recent years, however, the use of microbial microcosms has provided a way to increase the number of beneficial mutations likely to arise and fix during an experiment. Three experiments have characterized the distribution of fixed beneficial mutant effects (Rozen et al.2002; Rokytaet al. 2005; Barrett et al. 2006). All used roughly the same ex-perimental protocol: a number of replicate bacterial or viral lines were introduced into a novel environment and evolution proceeded through the substitution of novel beneficial mutations. By comparing the fitness of an evolved genotype sampled from around the time a mutation fixed within the evolved population to the fitness of the ancestral genotype, these studies claimed to measure the fitness advantage conferred by the single beneficial mutation carried by each evolved genotype. Our simulations indicate, however, that the selection coefficient estimated from the average fitness of indi-viduals at the time of fixation is a very poor measure of the fitness effect of the actual mutation that has just fixed wheneverNm.1 (Figure 4). Whenever multiple mutations arise during the spread of a focal mutation, so that clonal interference occurs, individuals are likely
Figure 4.—Error caused by measuring the
to carry multiple mutations by the time that the focal mutation has fixed, and therefore selection coefficients measured will overestimate the true effects of a single mutation. Consequently, experiments aimed at estimat-ing the distribution of beneficial selective effects should avoid large population size to keepNm,1.
The studies by Rozenet al.(2002) and Barrettet al. (2006) serve as a good comparison of how the distribu-tion of fitness effects of fixed beneficial mutadistribu-tions shifts with increasing selection. Both experiments were con-ducted with similar organisms and transfer protocols and therefore share fairly comparable parameter values, except for the average selection coefficient, which dif-fered by an order of magnitude. This difference is perhaps unsurprising as the ancestral strain in the Rozenet al. (2002) experiment was fairly well adapted to consuming the sole carbon source (Escherichia coli with glucose), whereas the ancestral strain in the Barrettet al.(2006) experiment initially had very poor growth (Pseudomonas fluorescenswith serine). Despite the difference in average selection coefficients, both studies reported bell-shaped distributions for fixed beneficial mutations. Both sets of authors suggest that this shape is the result of drift and clonal interference transforming an exponential distri-bution of beneficial mutations. However, sinceNem,1,
the bell-shaped distributions are unlikely to be strongly influenced by clonal interference. Indeed, the bell-shaped distributions observed in these studies can be accounted for entirely by the stochastic loss while rare of mutations drawn from an exponential distri-bution (Equation 4), without considering competing mutations.
In conclusion, allowing for strong selection has altered our theoretical understanding of the distribution of fitness effects in the following ways. By correctly account-ing for the fact that the fixation probability cannot rise above one, the distribution of fixed beneficial mutations more closely matches the distribution of newly arising beneficial mutations when selection is strong (Figure 3). Although the distribution of surviving mutations is always more bell-shaped, the difference from the distribution of newly arising beneficial mutations is largely confined to regions where selection is weak. Importantly, our results (Figure 4) also demonstrate that data on the selection co-efficients of fixed mutations must be treated with caution whenever clonal interference is present, as multiple muta-tions are likely to be segregating at the time of fixation, causing selection coefficients to be greatly exaggerated.
We thank the OLM discussion group for helpful comments on the manuscript. This work was supported by funding from the Natural Science and Engineering Research Council of Canada to R.D.H.B. (PGS–D grant), L.K.M. (CGS–M grant), and S.P.O. (discovery grant).
LITERATURE CITED
Atwood, K. C., L. K. Schneiderand J. F. Ryan, 1951 Periodic
se-lection inEscherichia coli.Proc. Natl. Acad. Sci. USA37:146–155.
Barrett, R. D. H., R. C. MacLeanand G. Bell, 2006 Mutations of
intermediate effect are responsible for adaptation in evolving
Pseudomonaspopulations. Biol. Lett.2:236–238.
Bradshaw, H. D., K. G. Otto, B. E. Frewen, J. K. McKayand D. W.
Schemske, 1998 Quantitative trait loci affecting differences
in floral morphology between two species of monkeyflower (Mimulus). Genetics149:367–382.
Bull, J. J., M. R. Badgettand H. A. Wichman, 2000 Big-benefit
mu-tations in a bacteriophage inhibited with heat. Mol. Biol. Evol.
17:942–950.
Colosimo, P. F., K. E. Hosemann, S. Balabhadra, G. Villarreal,
M. Dicksonet al., 2005 Widespread parallel evolution in
stickle-backs by repeated fixation of ectodysplasin alleles. Science307:
1928–1933.
Crow, J. F., and M. Kimura, 1965 Evolution in sexual and asexual
populations. Am. Nat.99:439–450.
deVisser, J. A. G. M., and D. E. Rozen, 2006 Clonal interference
and periodic selection of new beneficial mutations inEscherichia coli.Genetics172:2093–2100.
Ewens, W. J., 1967 The probability of survival of a new mutant in a
fluctuating environment. Heredity22:307–310.
Ewens, W. J., 1979 Mathematical Population Genetics.Springer, Berlin.
Fisher, R. A., 1922 On the dominance ratio. Proc. R. Soc. Edinb.42:
321–341.
Fisher, R. A., 1930 The Genetical Theory of Natural Selection.Oxford
University Press, Oxford.
Gerrish, P., 2001 The rhythm of microbial adaptation. Nature413:
299–302.
Gerrish, P. J., and R. E. Lenski, 1998 The fate of competing
ben-eficial mutations in an asexual population. Genetica 102/103:
127–144.
Gillespie, J. H., 1983 A simple stochastic gene substitution model.
Theor. Popul. Biol.23:202–215.
Gillespie, J. H., 1984 Molecular evolution over the mutational
land-scape. Evolution38:1116–1129.
Gillespie, J. H., 1991 The Causes of Molecular Evolution.Oxford
Uni-versity Press, New York.
Gumbel, E. J., 1958 Statistics of Extremes.Columbia University Press,
New York.
Haldane, J. B. S., 1927 The mathematical theory of natural and
ar-tificial selection, part V: selection and mutation. Proc. Camb. Philos. Soc.23:838–844.
Hegreness, M., N. Shoresh, D. Hartland R. Kishony, 2006 An
equivalence principle for the incorporation of favorable muta-tions in asexual populamuta-tions. Science311:1615–1617.
Imhof, M., and C. Schlotterer, 2001 Fitness effects of
advanta-geous mutations in evolving Escherichia colipopulations. Proc. Natl. Acad. Sci. USA98:1113–1117.
Kassen, R., and T. Bataillon, 2006 Distribution of fitness effects
among beneficial mutations before selection in experimental populations of bacteria. Nat. Genet.38:484–488.
Kimura, M., 1957 Some problems of stochastic processes in
genet-ics. Ann. Math. Stat.28:882–901.
Kimura, M., 1964 Diffusion models in population genetics. J. Appl.
Probab.1:177–232.
Kimura, M., 1983 The Neutral Theory of Molecular Evolution.
Cambridge University Press, Cambridge, UK.
Kimura, M., and T. Ohta, 1974 Probability of gene fixation in an
expanding finite population. Proc. Natl. Acad. Sci. USA 71:
3377–3379.
Miralles, R., P. J. Gerrish, A. Moyaand S. F. Elena, 1999 Clonal
inter-ference and the evolution of RNA viruses. Science285:1745–1747. Morjan, C. L., and L. H. Rieseberg, 2004 How species evolve
col-lectively: implications of gene flow and selection for the spread of advantageous alleles. Mol. Ecol.13:1341–1356.
Mukai, T., S. I. Chigusa, L. E. Mettler and J. F. Crow,
1972 Mutation rate and dominance of genes affecting viability inDrosophila melanogaster.Genetics72:333–355.
Novick, A., and L. Szilard, 1950 Experiments with the chemostat
on spontaneous mutation of bacteria. Proc. Natl. Acad. Sci. USA
36:708–720.
Orr, H. A., 1998 The population genetics of adaptation: the distribution
of factors fixed during adaptive evolution. Evolution52:935–949. Orr, H. A., 2000 The rate of adaptation in asexuals. Genetics155:
Orr, H. A., 2002 The population genetics of adaptation: the
adap-tation of DNA sequences. Evolution56:1317–1330.
Orr, H. A., 2003 The distribution of fitness effects among beneficial
mutations. Genetics163:1519–1526.
Orr, H. A., 2005 The genetic theory of adaptation. Nat. Genet.6:
119–127.
Otto, S. P., and C. D. Jones, 2000 Detecting the undetected:
esti-mating the total number of loci underlying a quantitative trait. Genetics156:2093–2107.
Otto, S. P., and M. C. Whitlock, 1997 The probability of fixation
in populations of changing size. Genetics146:723–733. Rice, J. A., 1988 Mathematical Statistics and Data Analysis.Wadsworth,
Belmont, CA.
Rokyta, D. R., P. Joyce, S. Brian Caudle and H. A. Wichman,
2005 An empirical test of the mutational landscape model of ad-aptation using a single-stranded DNA virus. Nat. Genet.37:441–444. Rozen, D. E., J. A. G. M.deVisserand P. J. Gerrish, 2002 Fitness
effects of fixed beneficial mutations in microbial populations. Curr. Biol.12:1040–1045.
Sanjuan, R., A. Moyaand E. Santiago, 2004 The distribution of
fitness effects caused by single-nucleotide substitutions in an RNA virus. Proc. Natl. Acad. Sci. USA101:8396–8401. Wahl, M. L., P. J. Gerrishand I. Saika-Voivoda, 2002 Evaluating
the impact of population bottlenecks in experimental evolution. Genetics162:961–971.
Wang, R. L., A. Stec, J. Hey, L. Lukensand J. Doebley, 1999 The
limits of selection during maize domestication. Nature 398:
236–239.
Whitlock, M., 2003 Fixation probability and time in subdivided
populations. Genetics164:767–779.
Wilke, C. O., 2004 The speed of adaptation in large asexual
popu-lations. Genetics167:2045–2053.
Wolfram Research, 2005 Mathematica. Wolfram Research,
Champaign, IL.
Communicating editor: N. Takahata
APPENDIX
Assuming weak selection and a fluctuating popula-tion size, the average probability of fixapopula-tion of a bene-ficial mutation is2sNe=N (Ewens1967; Kimuraand
Ohta1974; Ottoand Whitlock1997). Here, the arith-metic average population size isN, and the ‘‘effective’’ population size is Ne, whose calculation depends on
the nature of the population fluctuations (Ottoand Whitlock 1997; Wahlet al.2002). Unfortunately, we lack an analytical expression for the fixation probability when selection is strong and population size varies. We conjecture that an adequate approximation for the average fixation probability under strong selection is given byP ¼1e2sNe=N, which is nearly 2sN
e=N when
selection is weak but has the advantage of remaining,1 when selection is strong. This approximation is equiv-alent to the one used when the population size is con-stant;i.e.,Ne¼N (see Figure 1). This functional form
is also suggested by diffusion analysis in populations of large effective size (Kimura1957, 1964), which assumes weak selection. Simulations confirm thatP provides a satisfactory approximation for the fixation probability over a range of parameter values in populations un-dergoing repeated bottlenecks (within a factor of two; supplemental Figure 3 at http://www.genetics.org/ supplemental/).
We next consider the time to fixation of a beneficial mutation. If the mutation arises when the population
size is Na and fixes when the population size is Nf, a
deterministic model of selection can again be used to predict that
T ¼lnððNa1ÞðNf1ÞÞ=lnð11sÞ lnðNaNfÞ=lnð11sÞ:
Mutations are more likely to arise when the population size is large, but they are more likely to fix when the population size is small. Averaging the time to fixation over all possible events requires precise knowledge of the fluctuations in population size and the strength of selection. Assuming that mutations arise and fix uni-formly over time, however, provides a generic approx-imation for the time to fixation,
T X
t
f¼1
Xt
a¼1
lnðNaNfÞ t2lnð11sÞ¼
2 lnðNgmÞ
lnð11sÞ; ðA1Þ
whereNgm is the geometric mean population size over
time. In Equation A1, t represents the period of the population size cycle if population size changes cycli-cally. If not, Equation A1 is evaluated by taking the limit astgoes to infinity. Simulations indicate thatTprovides a satisfactory approximation for the average time to fixation over a range of parameter values in populations undergoing repeated bottlenecks (within a factor of two; supplemental Figure 4 at http://www.genetics.org/ supplemental/).
To account for clonal interference, we should de-termine the expected number of mutations that com-pete for fixation when the focal mutation appears at time t (see Equation 5) and then average over all possible times at which the focal mutation could arise. To do so exactly requires a precise description of the manner in which the population size fluctuates. As a first-order approximation, we estimate the number of competing mutations using
lðsÞ ¼PNmT
2: ðA2Þ This approximation ignores the covariance between the number of contending mutations and the time to fixation of a focal mutation, which should be generated by the fluctuations in population size.
Using Equation A2 to rederive Equation 7, the cdf among fixed beneficial mutations becomes
HðsÞ ¼NgmNmk=lnð11sÞ 1k P
; ðA3Þ
where kis again given by Equation 8 and the average probability of fixation across the distribution of new mutations is now
P¼1 112scv2Ne N
1=cv2
The corresponding probability density function for fixed mutations ishðsÞ ¼dHðsÞ=ds.
We assessed the accuracy of Equation A3 against simulations of a population whose size cycles fromN0
to 27N
0 via seven doubling events followed by a 1/27
serial dilution. In these simulations, the growth of the population was assumed to be deterministic (no sam-pling except during the dilution or ‘‘bottleneck’’ gen-eration), and births occurred at a rate proportional to the fitness of an individual. Under this scenario, the size of the bottleneck, N0, and the period of the cycle, t,
determine NeN0ln 2ð Þt (Wahl et al. 2002), N
N0ð2t1Þ=t, and NgmN0
ffiffiffiffiffiffiffiffiffi
2t1 p
for use in Equation A3. Every combination of the following parameters was explored: selection coefficients (s¼0.01, 0.1, 1, 2, and 10), beneficial mutation rate (m¼107and 109), and initial population size (N0¼105, 106, and 107), assuming
that the fitness effects of new mutants were exponential (cv¼1).
Figure A1 indicates that Equation A3 accurately pre-dicts the distribution of fixed selective effects across this range of parameters. Interestingly, Equation 2 of Rozenet al.(2002) provides a more accurate prediction of the distribution of fixed beneficial mutations with a fluctuating population size (with Ne in place of N)
than with a constant population size (Figure 2). The improved performance of their method is due to the fact that the fixation probability used, 2sNe=N,
re-mains reasonably accurate even when selection is strong (s?0:1) because of the reduction in effective popula-tion size caused by the fluctuapopula-tions (Ne>N).
FigureA1.—Median selection coefficient of fixed
benefi-cial mutations estimated from numerical simulationsvs. ana-lytical results. Median estimatedsis given from the results of our fluctuating population size model, given byH(s) in Equa-tion A3, or from those of a model assuming weak selecEqua-tion given by Equation 2 in Rozenet al.(2002), but replacingN
withNefrom Wahlet al.(2002). The horizontal axis measures