Optimization in the Position of Tail Engine on
the Fuselage for Drag Reduction
Manish Kumar 1, Rajan Lakra2, Sandeep Patil3, Eshwar Reddy Cholleti4
Assistant Professor, Department of Aeronautical Engineering, PCE College, Nagpur, Maharashtra, India1 Assistant Professor, Department of Aeronautical Engineering, PCE College, Nagpur, Maharashtra, India2 Assistant Professor, Department of Aeronautical Engineering, PCE College, Nagpur, Maharashtra, India3
Founder & CEO of 3D Srishti PVT Ltd, India.4
ABSTRACT: The main purpose of our project is to study the boundary layer in the air flow over the fuselage and how boundary layer is affected due to introduction of tail engine. For the following purpose we considered a cylindrical pipe as fuselage and used propeller as the tail engine. We tested our model in the wind tunnel at different positions (10cm, 20cm, 30cm from rear edge of fuselage), different velocities of wind tunnel (6.2m/s, 9m/s, 12.4m/s) and different motor rpm (rpm=0, rpm=175, rpm=350) and concluded our results whether the boundary layer shifts or not by placing tail engine. If it shifts, at what position it will be most suitable to place the engine. We noted height in manometer and obtained pressure and normal reaction force. After that, we calculated drag and found without engine mounting, there will be more drag but after placing engine at the rear of the fuselage we concluded that the skin friction drag is reduced substantially. From above experimental result we concluded that, the drag is gradually decreasing as we are on increasing rpm of mounted motor but when air flow velocity is increases, some drag also increases due to shift of air flow from laminar to the turbulence.
KEYWORDS: Boundary Layer, Fuselage, Rear Engine, Wind Turbine, Throttle.
I.
INTRODUCTIONWind tunnel speedMotor rpmPosition from rear of fuselage
6.2m/s 0 10cm
9m/s 175 20cm
12.4m/s 350 30cm
Robert B. Brown1, we observed that A mid wing aircraft employs a unique configuration for mounting 3 high bypass turbofan engines. The exhaust from the each of engine is directed by 2 nozzles. The left engine (port) is mounted on the in board position of the left wing adjacent to the fuselage. Similarly right engine is mounted in the starboard side. Andrew J. Comb2The third engine is mounted above the aft position of the fuselage and is fixed to the vertical stabilizer. The air inlet of this engine is positioned forwardly of the leading edge of the vertical stabilizer while reversely portion comprising the exhaust nozzle opens to the left and right side of the vertical stabilizer.
The air molecules at the surface of a fuselage are effectively stationary. If the flow is smooth i.e known as a laminar flow, the velocity of the air increases steadily as measurements are taken further away from the surface. However the smooth flow is often disturbed by the boundary layer breaking away from the surface and creating a low pressure region immediately behind the airfoil. This low pressure region results in increased overall drag. Attempts have been made over the years to delay the onset of this flow separation by careful design and smooth surfaces.
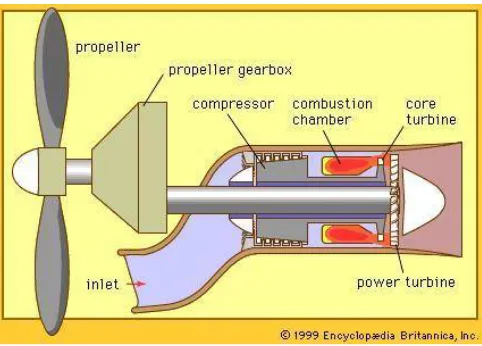
As we know that low pressure region is created immediately after the airfoil, overall drag increases over fuselage. To reduce this drag, an engine is placed at the rear of fuselage. This engine is mounted in the vertical stabilizer. The inlet air from this engine is passed to the compressor through the S-shaped duct and produces thrust. Due to this engine, the flow will be attached to the fuselage delaying the breaking of flow.
Fig. – 2 Conceptual Design
II. RESEARCH METHDOLOGY
Model Specification
1) Diameter of the propeller = 5inch 2) Pitch of the propeller = 3inch 3) Motor speed = 1400rpm 4) 1400kV brushless motor 5) Fuselage: a. cylindrical shape
b. Length = 32inch c. Diameter = 4.5inch 6) Wind tunnel: a).Suction type
b).Dimension of test section = 100x30x30 cm c).Subsonic wind tunnel
during experiment. Spokes are attached by gas welding. Two sections are cut below the fuselage to attach these spokes with the pressure tubes. A stand is provided to place the engine over fuselage. Wind tunnel is tested if it working properly. Glass of the test section of the wind tunnel is removed to place the fuselage in test section. Pressure tubes of the model are connected with the manometer pressure tubes. Glass of the test section is fitted again and all the openings in wind tunnel are packed. Wind tunnel speed is changed using knob associated with the control panel and speed is calculated using anemometer. Battery, necessary wires connections and the engine mounting are done through the removable glass of test section. Safety precautions have been considered. Velocity of air in the wind tunnel is set at 6.2m/s, 9m/s, 12.4m/s. Then model is placed in the wind tunnel test section. Pressure tubes of the model are connected to the manometer pressure tubes. Pressure over the model is noted without mounting engine at above mentioned 3 different throttles.
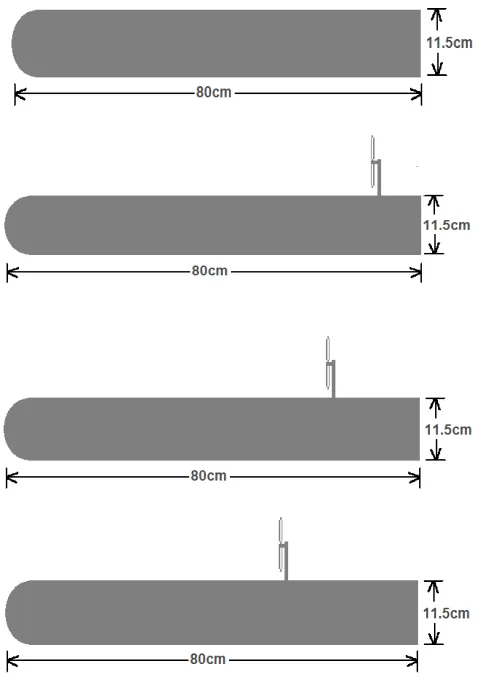
Engine is mounted at position 1 (30cm from rear of fuselage) and pressure is noted at above mentioned throttles with 3 different motor rpm (0 rpm, 175rpm, 350rpm).Now, engine is mounted at position 2 (20cm from rear of fuselage) and pressure is noted at above mentioned throttles with 3 different motor rpm mentioned above. Finally, engine is mounted at position 3 (10cm from rear of fuselage) and pressure is noted at above mention throttles with 3 different motor rpm mentioned above.
Pressure from manometer = ρ*g*H
Cp =
P-PsPo-Ps=
ρgΔH0.7239(Po - Ps=0.7239 Pa)
ΔH = H – Hs Where H is the manometer height for dynamic pressure
Hs is the manometer height for static pressure Ρ (Density of water) =1000 kg/m2
g (acceleration due to gravity)=9.81 m/sec
ΔP (Change in pressure) = ρgΔH
Normal reaction (N) = ΔP x A Drag = μN (Frictional force)
μ (surface friction coefficient) = 0.21 (for cast iron)
Area around pressure holes =Πrh = 3.581x10⁻⁴ m2
Let us consider an example for our analytical calculations. Calculations for pressure pt. 1 (without engine mounting):
Manometer rise H=21.5cm
Manometer rise for statics pressure=21.3cm
ΔH = H – Hs = 0.2cm
Cp =P-PsPo-Ps
=ρgΔH0.7239 =
1.2245*9.81*0.20.7239= 1.8217ΔP = P-Ps = ρgΔH = 2.4024 Pa
N = ΔP x A = 2.4024 x 3.581 x 10-4 = 8.6302 x 10⁻⁶ N = 8.6302x10⁻⁴N
D = μN = 0.21 x 8.6302 = 1.8123x10⁻⁴ N
III. EXPERIMENTAL SET-UP
Specifications & dimensions:
and having pitch 3inch as our tail engine. Speed of the motor with which the propeller is being rotated is 1400rpm. The motor is a brushless type DC motor of 1400kV. To supply the necessary power, we used a battery of 2200mAh. A 30A Electronic Speed Controller (ESC) is used to control the speed of motor. We tested our model in wind tunnel, which is a subsonic open and suction type wind tunnel. Dimension of the test section of the wind tunnel is 100cmx30cmx30cm. We constructed our model in such a way that it can be placed easily in this test section. The blower fan of wind tunnel is 5 blades Aluminium dia cast fan. Motor of wind tunnel is of 3 HP, AC induction motor of speed 2880rpm of 440V working on 15A. Tunnel of the wind tunnel is of length 4.2m approx. and having contraction ratio 9:1
Construction:
For the construction of model we used a hollow pipe (Cast iron) of length 80cm and diameter 11.5cm. One end of the fuselage is welded with thin metal sheet in spherical shape and the other end kept open for battery setup. A cut section of dimension10x5cm is provided lower side of the model with the help of the grinder. Similarly three cut section are provided at the upper surface of the model at distance of 10cm, 20cm, and 30cm from rear of model for motor assembly. Three holes are drilled behind cut section for wiring purpose. Surface finishing is obtained by using grinder for smooth flow. Model is painted with the Spray paint to avoid brush strokes and to have great smoothness. Sharp edge of rear of fuselage is grinded to ensure proper safety and to reach the required dimension for the model.
Pressure tube assembly:
In order to provide pressure tube in model, six holes are drilled on the upper surface of model. These holes are provided hollow spokes (volleyball air inlet pipe) which are welded with gas welding from inner side of model. These spokes are connected to the pressure pipes. These pipes are carried out from the cut section provided at the bottom surface of the model.
Motor Engine Mounting:
Motor is fixed to stand with the help of four screw. The propeller is mounted on motor shaft with hub screw. Holes are provided behind each cut section for mounting engine stand. The entire assembly of propeller, motor and stand is mounted on those cut section of the fuselage with the help of nut and bolt.
Procedure:
Our model is placed inside of the subsonic suction type wind tunnel. Glass of the test section of the wind tunnel is removed to place the fuselage in test section. Pressure tubes of the model are connected with the manometer pressure tubes. Glass of the test section is fitted again and all the openings in wind tunnel are packed. Wind tunnel speed is changed using knob associated with the control panel and speed is calculated using anemometer. Battery, necessary wires connections and the engine mounting are done through the removable glass of test section. Safety precautions have been considered.
IV. RESULTS AND DISCUSSION
At air speed 6.2m/s Drag vs Position (Where Engine Motor RPM is throttle of wind tunnel) Engine position R=0 R=175 R=350
1 37.939 26.205 17.708 2 32.521 23.497 13.57 3 30.717 22.596 4.533
Graph – 1 ( Drag vs Position at 6.2 m/s)
At air speed 9m/s Drag vs Position (Where Engine Motor RPM is throttle of wind tunnel) Engine position R=0 R=175 R=350
1 38.842 26.205 18.986 2 34.327 23.497 14.472 3 32.521 22.596 9.961
At air speed 12m/s Drag vs Position (Where Engine Motor RPM is throttle of wind tunnel) Engine position R=0 R=175 R=350
1 42.451 26.205 20.784
2 37.036 25.01 14.474
3 32.521 23.491 12.67
Graph – 3 ( Drag vs Position at 12.4 m/s)
Drag
Engine position
v=6.2m/s v=9m/s v=12.4m/s0 26.205 28.011 30.715
1 17.178 18.986 20.784
2 13.57 14.472 14.474
3 4.533 9.961 12.67
Coefficient of Pressure
Engine position v=6.2m/s v=9m/s v=12.4m/s
0 26.205 28.011 30.715
1 17.178 18.986 20.784
2 13.57 14.472 14.474
3 4.533 9.961 12.67
Graph – 5 (Cd vs Engine Position) On the basis of position:
From the above data we concluded that as we move the engine towards the rear edge of the model, drag and coefficient of pressure are reduced gradually. Drag and coefficient of pressure are maximum for position 1 (i.e. 30cm from rear edge of model) which reduce when engine is moved to position 2(i.e. 20cm from rear edge of the model) and are minimum for position 3(i.e. 10cm from the rear edge of model).
Hence, position 3 (i.e. 10cm from the rear edge of the model) is most suitable to mount the engine.
On the basis of air speed:
From the above data we concluded that as we increase the air speed of wind tunnel, drag and coefficient of pressure are increasing gradually. Drag and coefficient of pressure are minimum for air speed 6.2m/s which increase when air speed is 9m/s and are maximum for air speed 12.4m/s.
Hence, air speed 6.2m/s is most suitable speed of wind tunnel.
On the basis of motor rpm:
From all the above observations we concluded that as we increase the motor rpm, drag and coefficient of pressure are reduced. Drag and coefficient of pressure are maximum for motor rpm 0, which reduce when motor rpm is 175 and are minimum for motor rpm 350.
Hence, we concluded that motor rpm 350 is most suitable.
From the above data we concluded that there is some drag over the model which is reduces due to introduction of tail engine.
IV. CONCLUSIONS
I. Without engine mounting, there will be more drag but after placing engine at the rear of the fuselage we concluded that the skin friction drag is reduced substantially.
Wind tunnel speed Motor rpm Position from rear of fuselage
6.2m/s 0 10cm
9m/s 175 20cm
12.4m/s 350 30cm
II. We tested our model at different conditions.
III. From above experimental result we concluded that, the drag is gradually decreasing as we are increasing rpm of mounted motor but when air flow velocity is increases, some drag also increases due to shift of air flow from laminar to the turbulence.
IV. At the rear of the fuselage we also observe that because of engine mounting drag is increased.
REFERENCES
[1]. Vegas, J. R. and Coakley, T. J. , "Numerical Investigation of Turbulence Models for Shock-Separated Boundary Layer Flows ," AIAA Paper 77-44, presented at AIAA 15th Aerospace Sciences Meeting, Los Angels, Calif., Jan. 24-26, 1977.
[2]. M. J. Johnson, K. Ravindra, and R. Andres, ‘Comparative study of the elimination of the wing fuselage junction vortex by boundary layer suction and blowing’,AIAA 94-0293, 32nd Aerospace Science Meeting and Exhibit, January 10-13,1994 / Reno, NV
[3]. Steger, J. L., "Implicit Finite Difference Simulation of Flow About Arbitrary Geometries with Application to Airfoils," AIAA Paper 77-665, presented at Ala 12th Thermo physics Conference at Albuquerque, New ex., June 27-29, 1977
[4]. Cebeci, T., "Calculation of Compressible Turbulent Boundary Layers with Heat and Mass Transfer," AIAA Paper 70-741, presented at AIAA 3rd Fluid and Plasma Dynamics Conference, Los Angels, Calif., June 29-July 1, 1970.
[5]. Maccormack, R. W. and Baldwin, B. S . , "A Numerical Method for Solving the Navier-Stokes Equations with Application to Shock-Boundary Layer Interactions," AIAA Paper 75-1, presented at AIAA 13th Aerospace Sciences Meeting, Pasadena, Calif., Jan. 20-22, 1975.
[6]. Hopkin's, E. J. and Inouye, M. I., "An Evaluation of Theories for Predicting Turbulent Skin Friction and Heat Transfer on Flat Plates at Supersonic and Hypersonic Mach Numbers," AIM Journal, Vol. 9, No. 6 , June 1971, pp. 993-1003.
[7]. Reda, D. C. and Murphy, J. D., "Shock Wave Turbulent Boundary Layer Interaction i n Rectangular Channels, Part 11: The Influence of Sidewall Boundary Layers on Incipient Separation and Scale of Interaction." AIAA Page No 7 3-234, at AIAA 11th Aerospace Sciences Meeting in Washington, D.C., Jan. 10-12, 1973.
[9]. Settles, Vas, I. E . , and Bogdonoff, S.M., "Details of a Shock-Separated Turbulent Boundary Layer at a Compression Corner," Journal, Vo1. 14, No. 12, Dec. 1976, pp. 1709-1715.
[10]. Robert B. Brown, ‘Engine mounting and boundary layer control fluid supply apparatus’, Assignee- The Boeing Company, Patent no.: 3,948,469.
[11]. Andrew J. Comb,‘Aircraft’,Assignee- Britton Norman Ltd., Patent No.: 3,807,665.
[12]. Richard T Cathers, William M. Douglass, ‘Trijet Aircraft’, Assignee- McDonnell Douglas Corporation, Santa Monica, California, Patent No.: 3,666,211.
[13]. John A. Mangeiga, Christopher J. Wilusz, Cornelius H. Dykhuizen, ‘Aircraft engine mount’, Assignee- General Electric Company, Patent No.: 6,330,995 B1.
[14]. Robert F. Brodell, Edward J. Hovan, Steven T. Selfors, Constantino V. Loifredo, Paul W. Duesler, ‘Nacelle and mounting arrangement for an aircraft engine’, Assignee- United Technologies Corporation, Patent No.: 5,524,847
[15]. Robert E. Wagenfeld, ‘System for reducing aircraft noise and hush kit’, Assignee- Valsan Partners Limited Partnership, Patent No.: 4,836,469 [16]. M. D. Shirkey, ‘The results of low-speed wind tunnel tests to investigate the effects of the NASA refan jt8d engine nacelles on the stability and control’, NASA Washington, D.C., Report no.: CR-134503.
[17]. S. Goldstein, ‘On laminar boundary layer flow near a position of separation’, Dept. of Mathematics, The University, Manchester, 27 October 1947.
[18]. W. R. Sears and D. P. Telionis, ‘Boundary layer separation in unsteady flow’ SIAM J. Appl. Mathematics, Vol.28, No. 1, January 1975. [19]. John C. Lin, ‘Review of research on low-profile vortex generators to control boundary layer separation’, Flow Physics and Control Branch, NASA Langley Research Center, Hampton, VA 23681-2199, USA, Progress in Aerospace Sciences 38 (2002) 389–420.
[20]. David E. Yates and Keith Blodgett and FassiKafyeke, ‘High speed aerodynamic integration of a fuselage mounted turbofan engine’,AIAA-98-3421.
[21]. E. Achenbach, ‘Distribution of local pressure and skin friction around a circular cylinderin cross-flow up to Re = 5x10⁶’, J. Fluid Mech. (1968), vol. 34, part 4,pp. 625-639, Received 15 March 1968.
[22]. B.S. Baldwin and H. Lomax,NASA Ames Research Centre, ‘Thin layer approximation and algebraic model for separated turbulent flows’, AIAA 16th Aerospace Science Meeting, Huntsville, Alabama/January 16-1 8, 1978.