Analysis of Event Related Potential for Motor
Movement Task
Vinay kumar Vijay1, Sachin Dave2 , Prakriti Trivedi3
P.G. Student, Department of Computer Engineering, Government Engineering College, Ajmer, India1
P.G. Student, Department of Computer Engineering, Government Engineering College, Ajmer, India2
Associate Professor, Department of Computer Engineering, Government Engineering College, Ajmer, India3
ABSTRACT: Brain Computer Interface (BCI) is communication system for the people who lost their ability of
speaking and cannot move their left and right hands due to some cord injury. BCI uses Brain rhythm as input for BCI system. Brain rhythm is an Event Related Potential (ERP) which is generated in human brain during some imagination of task (left hand movement, right hand movement). In this paper, we analyze the ERP feature for both Left Hand Movement and Right Hand Movement and compare them using EEGLAB toolbox. Comparison is done on the basis of Event Related Synchronization (ERS) and Event Related Desynchronization (ERD). EEG signal for both Left Hand and Right Hand movement are downloaded from physioNet.
KEYWORDS: Brain Computer Interface, Event Related Potential, Event Related Synchronization, Event Related
Desynchronization, EEGLAB.
I. INTRODUCTION
BCI system work as an interface between its user and devices. BCI uses EEG signal to communicate with devices and this EEG signal is captured by human brain using EEG devices. BCI technology defines in two ways: invasive and non-invasive. Nowadays, non-invasive technology is mostly used in BCI research because it does not require implanting electrodes directly into brain. EEG signal is type of potential which is generated during some imagination of task (left hand movement, right hand movement). ERP is a method that measure electrical activity of brain with respect to time using EEG electrodes which is placed on the scalp.
II. RELATEDWORK
User brain produces many events at a single time instance. Hence for a single trial, response of an event is not visible in EEG recordings, to measure the response of an event user takes many trial and average the results of all the trial. This process is called Event Related Potential (ERP). ERP image is generally two dimensional representations of data using event time with respect to number of trials. So in our work, we analyze the EEG data using ERP image.
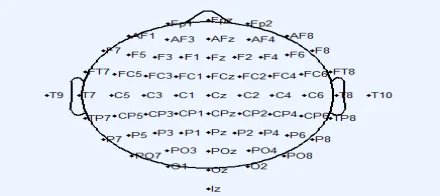
We evaluate the ERP results from frontal lobe for channels FC1, FC3, FC5, FC2, FC4, and FC6. EEG signal generated by left hand movement goes to Right motor cortex area of brain for desynchronization and EEG signal generated by right hand movement goes to Left motor cortex area of brain for desynchronization. Channel position map show in figure 1.
III. WORKINGPROCEDURE
ERP Analysis of Left Hand movement and Right Hand Movement are done by EEGLAB. EEGLAB is an interactive graphical user interface (GUI) tool which provide some standard inbuilt function such as remove artifacts, baseline removal, data filtering, epoch extraction, data resampling, visualize epoch and event statics.
Fig 2.Block diagram of Working Procedure
Signal preprocessing is done by EEG LAB. Independent component analysis is performed before analyze the ERP feature because it extract the feature in the form of single component so that we can evaluate the ERP feature independently.
A. Signal Pre- Processing
It include Filtering of EEG signal, amplification of signal. EEG signal filtering is done by using the FIR filter of EEGLAB. Signal pre- processing of EEGLAB includes importing of EEG data, and channel location files in different formats including Matlab, Binary, Neuroscan, and ASCII.
B.Artifacts detection and Rejection
EEGLAB is a GUI tool which Provide option to detect artifact visually and remove it by selecting the appropriate area of EEG scalp map graph.
C. Independent Component Analysis
Independent Component Analysis converts the high dimensional data space into low dimensional data space. It maximizes the joint entropy and minimizes the redundant information. In EEGLAB, ICA is implemented by runica( ) function. It removes the artifact which is generated by the muscles and eye blink activity. It also filters the noise and speech data.ICA is a linear decomposition data method which returns the output as a single component. If Y is the scalp data matrix and P is the component activation matrix then ICA is defined by the following equation:
RY = P (1)
Signal Pre- Processing
Artifacts detection and Rejection
Independent Component Analysis
Where R is matrix of spatial filter of EEG scalp data. Equation (1) describes that applying spatial filter R to data Y give the result as an ICA process.
IV. EXPERIMENTAL RESULTS
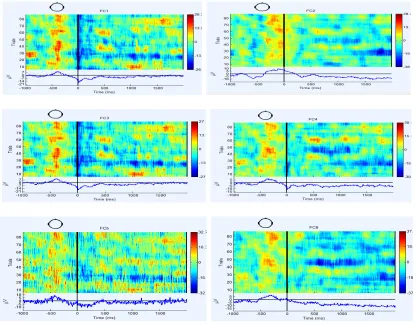
EEG dataset is collected from PhysioNet. This dataset consists of two or three minutes of EEG recordings. The data is in EDF+ format (European Data Format) which has 64 EEG channels as per the international 10-20 system. Data are sampled at the frequency of 160 Hz. We have selected six channels FC1, FC3, FC5, FC2, FC4, and FC6 on frontal lobe. After processing of data give the following result show in fig.3 and fig.4 respectively for left hand movement and right hand movement
Fig 3. ERP map for Left hand movement
Fig 4.ERP map for Right hand movement
Fig 5.ERP comparison for Left Hand movement and Right Hand movement
(Blue represents the ERP of Left hand movement and Red represents the ERP of Right hand movement)
Finally we have done an ERP comparison analysis for left hand movement and right hand movement which is show in figure 5. Red line represents the right hand movement activity and blue line represents the left hand movement activity. from figure 5 it is observed that for right hand movement event related synchronization occur at channel FC2, FC4, FC6 and event related desynchronization occur at channel FC1, FC3, FC5. For Left hand movement activity event related synchronization occur at channel FC1, FC3, FC5 and event related desynchronization occur at channel FC2, FC4, FC6.
V. CONCLUSION
REFERENCES
[1] J. R. Wolpaw, N. Birbaumer, D. J. McFarland, G. Pfurtscheller, and T. M. Vaughan, “Brain–computer interfaces for communication and control,” Clinical neurophysiology, vol. 113, no. 6, pp. 767–791, 2002.
[2] http://sccn.ucsd.edu/eeglab.
[3] Pfurtscheller,G., Neuper,C.,(1997),Motor imagery activates primary sensorimotor area in humans, Neuroscience Letters, Vol.239,pp 65–68. [4] Jung,T.,(2001),Analysis and visualization of single-trial event-related potentials, Human Brain Mapping, Vol 14,pp 166-185.
[5] Lee TW, Girolami M, Bell AJ, Sejnowski TJ. A Unifying Information-theoretic Framework for Independent Component Analysis. Compute. Math. Appl., 2000; 31: 1-21.
[6] http://www.physionet.org/pn4/eegmmidb/
[7] Zhang, F., Mishra, A., Richardson, A. G., & Otis, B. (2011). A low-power ECoG/EEG processing IC with integrated multiband energy extractor. IEEETransactions on Circuits and Systems I-Regular Papers, 58, 2069–2082.
[8] Yeom,H.G., Sim,K.B.,(2008)ERS and ERD Analysis during The Imaginary Movement of Arms, International Conference on Control, Automation and Systems 2008,Oct. 14-17.
[9] M. Teplan, “Fundamentals of eeg measurement,” Measurement science review, vol. 2, no. 2, pp. 1–11, 2002 [10] Rogers, Y., Sharp, H., Preece, J.: Interaction design: beyond human-computer interaction. John Wiley & Sons (2011).
[11] P. W. Ferrez and J. del R Millan, “Error-related eeg potentials generated during simulated brain–computer interaction,” Biomedical
Engineering, IEEE Transactions on, vol. 55, no. 3, pp. 923–929, 2008
[12] Narayanan Srinivasan. Cognitive neuroscience of creativity: EEG based approaches. Methods, 42(1):109–116, 2007.