ABSTRACT
BLANCHARD, MARGARET ELIZABETH. A Multi-Scale Spatial Data Integration System for Park Management. (Under the direction of Dr. Hugh A. Devine.)
The Investigating Parks for Active Recreation for Kids (I-PARK) project is focused on
determining relationships among the presence, type, or condition of park attributes and the
level of physical activity of children observed in the park. Researchers also hope to
determine if age, race/ethnicity, socioeconomic status, and gender play a part in differences
in park use or physical activity. Toward this goal, I-PARK researchers created five
independent datasets for 20 parks in Durham, NC. These datasets included surveys of parks
for typical features, two types of observations of child play activities, interview data, and
park service area characteristics. As originally collected, these datasets predominantly
represented tabular data with an underlying spatial reference to park zones.
This project tested the ability to use a Geographic Information System (GIS) to create a data
integration model to allow simultaneous query of these complex, independent, spatial
datasets. Linkages between datasets allowed for cross-dataset queries, editing, and
visualization using geography as the integration method. The data integration system was
evaluated by investigating two data integration research questions: 1) “Is the presence or
features of play equipment potentially related to use of a park?” and 2) “Do local crime
study into the model and performing one of the queries. Again, the query functions were
successful and confirmed that the model structure was valid with the inclusion of new
datasets. This process also tested the time investment needed to further populate the data
model. It was determined that additional park data can be added to the model in under 1
hour, this is significantly less when compared to the 2 or 3 days required to establish the
original data model.
Lastly, this project developed an electronic behavioral mapping data collection system. This
system was designed to increase the efficiency of the current manual mapping technique,
while minimizing errors from digitizing points or data transcription. The method was tested
with a group of graduate students collecting data in one park using both collection systems.
The new system decreased data collection time by approximately 20-30 seconds per
observation; reduced data collection error; reduced data preparation time by eliminating the
A Multi-Scale Spatial Data Integration System for Park Management
by
Margaret Elizabeth Blanchard
A thesis submitted to the Graduate Faculty of North Carolina State University
in partial fulfillment of the requirements for the Degree of
Master of Science
Natural Resources
Raleigh, North Carolina
2008
APPROVED BY:
________________________________ ________________________________
Dr. Jason N. Bocarro Dr. Jay F. Levine
________________________________
DEDICATION
BIOGRAPHY
The author was born in Amsterdam, New York and grew up in the shadow of the Hudson and
Mohawk Rivers. Her childhood was filled with dreams of saving the world from PCBs and
other toxics. She obtained a Dual BS from Rensselaer Polytechnic Institute in Geology and
Environmental Science in 1998. She then spent several years in the Washington, DC area
working as an Environmental consultant until her career took a slight left turn into the world
of Medicare. In 2005 she began graduate school at NC State University where she
discovered the power of GIS. Throughout her degree she renewed her interest in toxics and
developed new interests in veterinary and human epidemiology. She still hopes to save the
ACKNOWLEDGEMENTS
I would like to express my sincere gratitude to my advisor, Dr. Hugh Devine, for his
unwavering support. He willingly took a chance on a graduate student by bringing me on in
December 2005 and has continued to have faith in me and show confidence in me throughout
my entire time at NC State University. I would also like to thank Dr. Jay Levine for his
support and willingness to work with me and Dr. Jason Bocarro for his unwavering
enthusiasm and agreeing to jump in at the last minute. In connection with this work, I am
grateful for the input and support of Dr. Myron Floyd, Dr. Perver Baran, Dr. Orcun Kepez,
Professor Robin Moore, and Tom Danninger.
I would like to thank the staff of the Center for Earth Observation for their support and
advice. I am ever grateful to Bill Slocumb for his willingness to get to the root of an ESRI
problem and to Linda Babcock for listening and making things happen. I would also like to
thank my fellow graduate students for their ideas, support, and willingness to put up with me.
I would also like to thank Felicia Mangum, who always saved me from falling between the
cracks. Without her, I wouldn’t have had health insurance!
Lastly, I would like to thank all my family and friends for their solid support. Without those
TABLE OF CONTENTS
LIST OF TABLES ... x
LIST OF FIGURES ... xi
1.0 Introduction and Background ... 1
1.1 Data Management ... 1
1.1.1 Decision Support Systems ... 1
1.1.2 Data Models ... 2
1.1.3 Use of a GIS... 3
1.2 Increased Childhood Obesity... 4
1.3 Investigating Parks for Active Recreation for Kids (I-PARK) Project Overview... 5
1.3.1 Park Environmental Audit Data... 5
1.3.2. System for Observing Play and Recreation in Communities (SOPARC) Observation Data ... 6
1.3.3 Interview Data... 7
1.3.4 Park Service Area Data... 7
1.3.5 Behavioral Mapping Data ... 8
1.4 Utilization of Geographic Information Science (GIS)... 8
1.4.1 Software Product... 9
1.5 Project Objectives and Research Questions... 9
2.0 Literature Review ... 11
2.1 Study of Neighborhood Parks and Park Use... 11
2.1.1 Childhood Obesity ... 11
2.1.1.1 Health Disparities in Populations... 12
2.1.2 Role of Physical Activity in Curbing Childhood Obesity ... 13
2.1.3 Outdoor Activity ... 13
2.1.4 Ecological Approach to Health Promotion ... 14
2.1.5 Investigating Parks for Active Recreation for Kids (I-PARK) Overview ... 15
2.2 Data Collection Methods ... 15
2.2.1 Environmental Assessment of Public Recreation Spaces (EAPRS) Data ... 15
2.2.2 System for Observing Play and Recreation in Communities (SOPARC) Observation Data ... 16
2.2.3 Interview Data... 16
2.2.4 Park Service Area Data... 17
2.2.5 Behavioral Mapping Data ... 17
3.0 Objective ... 22
4.0 Method: Data Collection and Organization ... 23
4.1 Overview... 23
4.2 Investigating Park for Active Recreation for Kids (I-PARK) Project Data Overview. 23 4.2.1 Creation of Park Zones ... 26
4.3 Environmental Audit Dataset... 28
4.3.1 Data Collection Method... 28
4.3.2 Data Organization and Storage ... 29
4.3.3 Data Preparation... 31
4.3.3.1 Creating a Linking Field ... 32
4.3.4 Example Data... 33
4.4 SOPARC Observation Data... 33
4.4.1 Data Collection Method... 33
4.4.2 Data Organization and Storage ... 34
4.4.3 Data Preparation... 34
4.4.4 Example Data... 35
4.5 Interview Data... 35
4.5.1 Data Collection Method... 35
4.5.2 Data Organization and Storage ... 35
4.5.3 Data Preparation... 36
4.5.4 Example Data... 36
4.6 Park Service Area Data... 36
4.6.1 Data Collection Method... 36
4.6.2 Data Organization and Storage ... 42
4.6.3 Data Preparation... 42
4.6.4 Example Data... 42
4.7 Behavioral Mapping Data ... 43
4.7.1 Data Collection Method... 43
4.7.2 Data Organization and Storage ... 45
4.7.3 Data Preparation... 45
4.7.4 Example Data... 45
4.7.5 Behavioral Mapping Reference Data... 46
4.8 Spatial Zones Data ... 46
4.9 Summary ... 48
5.0 Method: Developing a Personal Geodatabase to Create a Data Model and Model Validation... 50
5.1 Overview... 50
5.2 Data Model Requirements ... 50
5.3 Geodatabase Overview ... 51
5.3.1 Feature Dataset... 52
5.3.2 Feature Class... 52
5.3.4 Relationship Classes ... 53
5.3.4.1 Common Fields... 55
5.3.4.2 Linking Spatial Data to Spatial Data ... 56
5.3.4.3 Linking Spatial Data to Non-Spatial Data ... 56
5.3.4.4 Linking Non-Spatial Data to Non-Spatial Data ... 57
5.4 Relationship Class Requirements ... 57
5.4.1 Data Types ... 57
5.4.2 Cardinality... 58
5.4.3 Relationship Types... 59
5.4.4 Forwards and Backwards Labeling... 60
5.5 Creating the I-PARK Geodatabase and Establishing Relationship Classes ... 61
5.5.1 Environmental Audit Data ... 62
5.5.1.1 Importing Data ... 62
5.5.1.2 Creating Relationships ... 63
5.5.2 SOPARC Observation Data... 64
5.5.2.1 Importing Data ... 64
5.5.2.2 Creating Relationships ... 65
5.5.3 Interview Data... 66
5.5.3.1 Importing Data ... 66
5.5.3.2 Creating Relationships ... 67
5.5.4 Park Service Area Data... 67
5.5.4.1 Importing Data ... 67
5.5.4.1.1 Transportation Files ... 68
5.5.4.1.1.1 Creating the Feature Dataset... 68
5.5.4.1.2 General Park Data ... 69
5.5.4.1.2.1 Creating the Feature Dataset... 69
5.5.4.2 Creating Relationships ... 70
5.5.5 Behavioral Mapping Data ... 70
5.5.5.1 Transforming Data ... 71
5.5.5.2 Importing Data ... 71
5.5.5.3 Creating Relationships ... 72
5.5.6 Zones Data ... 73
5.5.6.1 Transforming Data ... 73
5.6 Final Geodatabase... 73
5.7 Modifying the Geodatabase for Advanced Use ... 74
5.7.1 Using Relationship Classes to Join Data ... 74
5.8 Creating Customized Tools... 75
5.8.1 IPARK Toolbox ... 76
5.8.1.1 Make Feature Layer ... 76
6.0 Method: Creating a Customized ArcPad Data Collection Application... 85
6.1 Behavioral Mapping Process ... 85
6.2 Purpose of Electronic Data Collection... 86
6.3 Creating Base Maps for Data Collection ... 86
6.3.1 Creating a Spatial Reference for Base Map Data ... 87
6.4 Initial Application/Tool Development Process... 90
6.4.1 Initial Application and Tool Use... 92
6.4.2 Initial Development Recommendations... 93
6.5 Application/Tool Development Modification Process ... 94
6.6 Application/Tool Case Study... 95
6.6.1 Control Observations ... 96
6.6.2 User Feedback... 96
6.7 Final Application and Tool Modification Development... 97
6.8 Case Study Data Manipulation ... 98
6.9 Case Study Data Analysis... 103
6.9.1 Time Savings ... 103
6.9.2 Error Reduction... 103
6.9.3 Location Comparison... 104
6.10 Populating the Data Model ... 106
7.0 Results ... 107
7.1 Project Objectives and Research Questions... 107
7.2 Validating the Data Model... 107
7.3 Queries ... 108
7.3.1 Simple Visual Queries ... 108
7.3.2 Relationship Classes and Simple Visual Query... 110
7.3.3 Queries Using Tools ... 114
7.4 Research Questions: 1) “Is the presence or features of play equipment potentially related to use of a park?” and 2) “Do local crime statistics potentially affect park users’ feelings about park safety?” ... 115
7.4.1 Querying the Data for Research Question 1: “Is the presence or features of play equipment potentially related to use of a park?” ... 115
7.4.1.1 Querying the Play Set Features Data ... 115
7.4.1.2 Querying the SOPARC Data ... 116
7.4.1.3 Query Results... 119
7.4.1.4 Joining Query Results Tables ... 121
7.4.1.5 Data Analysis and Further Query Activities... 121
7.4.2 Querying the Data for Research Question 2: “Do local crime statistics potentially affect park users’ feelings about park safety?” ... 122
7.4.2.1 Querying the Park Service Area Data... 122
7.4.2.2 Querying Interview Data... 123
7.4.2.3 Query Results... 125
7.4.2.4 Joining Query Results Tables ... 126
7.5 Model Validation Using Duke Park Data ... 127
7.5.1 Querying Duke Park Data... 130
7.5.2 Query Results... 131
7.5.3 Joining Query Results Tables ... 132
7.5.4 Validation Discussion ... 135
8.0 Discussion... 136
8.1 Problem Statement ... 136
8.2 Project Achievements ... 136
8.2.1 Model Development... 136
8.2.2 Behavioral Mapping Data Collection Application ... 137
8.3 Improved Decision Making ... 138
8.4 Recommendations... 138
8.4.1 I-PARK Data Collection ... 138
8.4.2 Georeferenced Data ... 140
8.4.3 Behavioral Mapping Data Collection ... 140
8.5 Future Efforts ... 141
8.5.1 Use of Unified Modeling Language ... 141
8.5.2 ArcGIS Enterprise Geodatabase ... 142
8.6 Conclusion ... 142
References... 144
Appendix... 152
Appendix 1 – Environmental Audit Data Example Data Entry Screen/Data Description 153 Appendix 2 – SOPARC Observation Form and Data Description ... 167
Appendix 3 – Interview Form and Data Description... 169
Appendix 4 – Park Service Area Data Description ... 175
Appendix 5: Behavioral Mapping Data ... 176
Appendix 6 – Behavioral Mapping Reference Data Descriptions... 179
Appendix 7 – Park Zones Data Descriptions... 180
Appendix 8: Data Collection Tool Visual Basic Application Code ... 181
Appendix 9 – Visual Basic Application Code for Hide Points and Hide/Unhide Points Applet... 183
Appendix 10 – Customized Application and Toolbar Visual Basic Code... 187
Appendix 11 – Research Question 1 Output Tables (“Is the presence or features of play equipment potentially related to use of a park?”) ... 188
Appendix 12 – Research Question 2 Output Tables (“Do local crime statistics potentially affect park users’ feelings about park safety?”)... 190
LIST OF TABLES
Section 4.0
Table 1. Description of I-PARK Datasets... 25
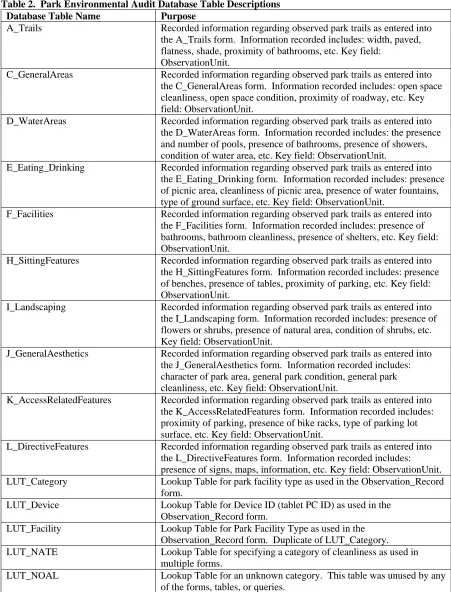
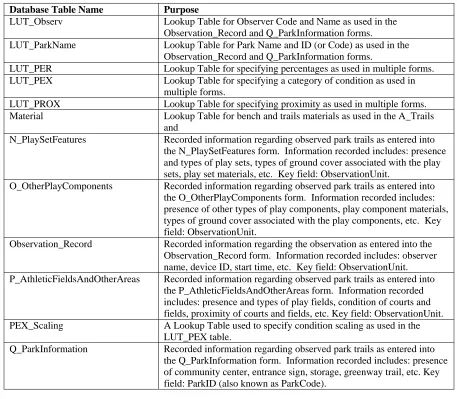
Table 2. Park Environmental Audit Database Table Descriptions ... 30
Table 3. Environmental AuditData Example... 33
Table 4. SOPARC Observation Example Data... 35
Table 5. Interview Data Example ... 36
Section 6.0 Table 1. Paired Swing Structure Observations (Compare Field)... 105
Table 2. Paired Play Structure Observations (Compare Field)... 105
Table 3. Euclidian Distance Calculations for Swing Structure... 106
LIST OF FIGURES
Section 4.0
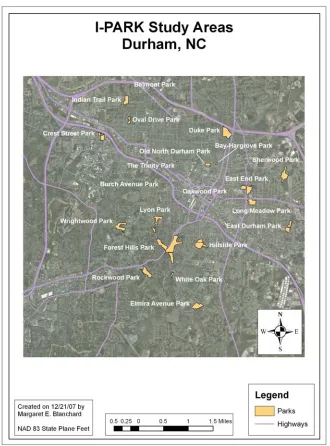
Figure 1. Map of the Twenty I-PARK Study Areas ... 24
Figure 2. Example of SOPARC Observation Zones as Designated at Forest Hills Park ... 27
Figure 3. Aerial Photography of Forest Hills Park with Park Zones Identified ... 28
Figure 4. Forest Hills Park Service Area with Included Parcels... 38
Figure 5. I-PARK Developed Forest Hills Park Service Area with Park Area Shown ... 40
Figure 6. I-PARK Developed Forest Hills Park Service Area... 41
Figure 7. Forest Hills Park Service Area Attribute Table... 42
Figure 8. Diagram of Behavioral Mapping Circular Movement around Study Area (C. Montgomery 2007)... 43
Figure 9. Map of Three Parks Selected for I-PARK Behavioral Mapping Data Collection... 44
Figure 10. Behavioral Mapping Example Data ... 46
Figure 11. Select and Export of Forest Hills Park Based on Select by Attribute ... 47
Section 5.0 Figure 1. Geodatabase Structure ... 51
Figure 2. Selection of Zone 1 in GIS and SOPARCWeek1 Data Display ... 54
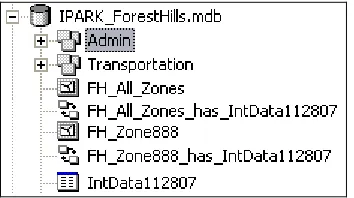
Figure 3. Environmental Audit Data as Imported into Geodatabase ... 62
Figure 4. Environmental audit Tabular Data with Relationship Classes to Zones Spatial Data... 64
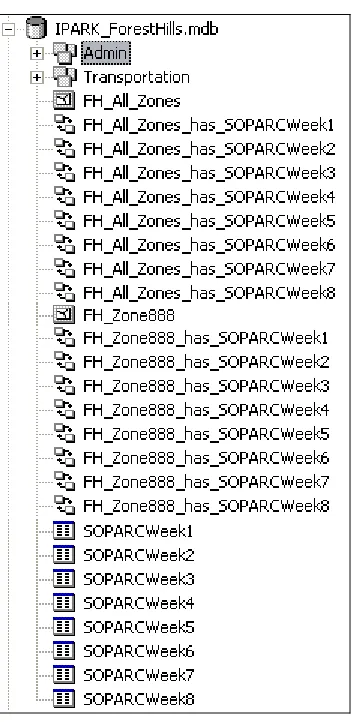
Figure 5. SOPARC Observation Data as Imported into the Geodatabase ... 65
Figure 6. SOPARC Observation Tabular Data with Relationship Classes to Zones Spatial Data ... 66
Figure 7. Interview Data as Imported into the Geodatabase... 66
Figure 8. Interview Tabular Data with Relationship Classes to Zones Spatial Data ... 67
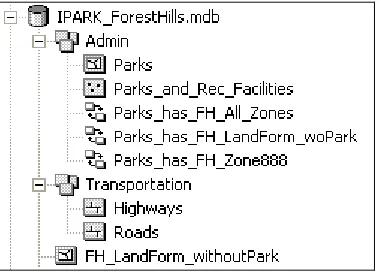
Figure 9. Park Service Area Data Included in Geodatabase ... 68
Figure 10. Park Service Area Transportation Feature Dataset ... 69
Figure 11. Park Service Area Admin Feature Dataset ... 70
Figure 12. Park Service Area Data with Relationship Classes to Parks Spatial Data ... 70
Figure 13. Behavioral Mapping Data as Imported into the Geodatabase Structure ... 72
Figure 14. Behavioral Mapping Data with Relationship Classes to Zones Spatial Data... 72
Figure 15. Zones Data as Imported into the Geodatabase Structure... 73
Figure 16. Join Interface When Using Existing Relationship Classes... 75
Figure 17. Customized IPARK Toolbox ... 76
Figure 18. Make Feature Layer Tool Interface ... 77
Figure 19. Make Query Table Tool Interface ... 78
Figure 23. Customized I-PARK Model Tool Interface ... 83
Figure 24. Customized I-PARK Toolbar ... 84
Section 6.0 Figure 1. Diagram of Behavioral Mapping Circular Movement Around Study Area (C. Montgomery 2007)... 85
Figure 2. Spatial Adjustment Relationship: Image on Left Is AutoCAD Drawings; Image on Right Is Georeferenced Durham County Data... 87
Figure 3. Spatial Adjustment Link Points for Forest Hills Park ... 88
Figure 4. Spatial Adjustment Link Arrows... 89
Figure 5. Transformation Result for Forest Hills Park: 1 = Tennis Court, 2 = Pool, 3 = Pavilion, 4 = Main Building with Bridge Location Differences Noted... 90
Figure 6. Initial Data Collection Application and Observation Collection Tool... 92
Figure 7. Data Collection Application and Observation Collection Tool with Modifications ... 95
Figure 8. Observation Collection Tool Form – Final Version... 98
Figure 9. Forest Hills Park Case Study Observations (Control and Comparison)... 100
Figure 10. Forest Hills Park Case Study Observations for Play Structure (Control and Comparison)... 101
Figure 11. Forest Hills Park Case Study Observations for Swing Structure (Control and Comparison)... 102
Section 7.0 Figure 1. All Spatial and Tabular Data Included in the Model and Added to the Map Document... 109
Figure 2. Visual Query of Forest Hills Park Data... 110
Figure 3. Tables Related to the Forest Hills Zones Layer through Relationship Classes.... 111
Figure 4. Simple Visual Query Results Showing Zone 2 Data... 112
Figure 5. Consecutive SQL Query Results Showing Number of Incidents of More than Four Young Sedentary Males Were Observed ... 113
Figure 6. Select Layer by Attribute Query Tool Interface... 114
Figure 7. Select Layer by Attributes Query Results ... 115
Figure 8. Diagram of Play Set Features Query Process... 116
Figure 9. Play Set Features Query Results Window... 116
Figure 10. Diagram of SOPARC Query Process ... 117
Figure 11. SOPARC Week 1 Observation Query Results Window ... 117
Figure 12. Forest Hills Park Play Feature and Activity Level Query in Customized Query Tool Interface... 119
Figure 13. Query Output – Tested for Forest Hills Park Code and Presence of Play Set Equipment... 120
Figure 14. Query Output - Tested for Forest Hills Park Code and Vigorous Activity in All Ages and Genders ... 120
Figure 15. Diagram of interview Query Process ... 123
Figure 17. Crime and Safety Queries in Customized Query Tool Interface... 125 Figure 18. Park Service Area Output – No Query Performed ... 126 Figure 19. Query Output - Tested for Forest Hills Park Code and Safety Question
Responses Not Equal to 5 ... 126 Figure 20. Final Query Output - Joined Tables ... 127 Figure 21. Map of Duke Park Zones... 129 Figure 22. Duke Park Play Feature and Activity Level Query in Customized
Query Tool Interface... 131 Figure 23. Query Output – Tested for Duke Park Code and Presence of Play
Set Equipment... 132 Figure 24. Query Output - Tested for Duke Park Code and Vigorous Activity in
1.0 Introduction and Background
1.1 Data Management
Many disciplines, such as public health, physical sciences, social sciences, and others, are
seeing an increase in the amount of data collected for research projects (Szalay and Gray
2006). The increase in data volume can be seen as a result of the increased cross disciplinary
nature of research, new or improved data collection techniques, and/or decreased scale
limitations (Szalay and Gray 2006; Zhizhin et al. 2007). As a result, research projects may
collect multiple datasets that contain different data types at different scales, thus increasing
the data complexity of the project. Without some integrating system that allows cross-dataset
analysis, it is unlikely that researchers will fully utilize the collected data. A data
management system lends itself to robust data analysis and decision support by providing an
environment that links datasets together on common elements. A Decision Support System
(DSS) provides this integration by linking the datasets via common data elements.
1.1.1 Decision Support Systems
A comprehensive Decision Support System (DSS) provides an environment in which data
can be presented to the end-user in an organized, meaningful, and presentable format (Rizzoli
and Young, 1997). Providing more comprehensive information to the end-user lends itself to
performing better analysis, developing better knowledge, and making better decisions
(Stewart et al. 2000). Additionally, an environment in which different data types and sources
can be integrated and analyzed together may provide cost and time savings to the project and
using a DSS that integrates multiple data sources and allows for cross-data queries. Use of a
Geographic Information System (GIS) as a DSS is a solution that allows these types of
analyses by using geography as the linking mechanism (Rao et al. 2007). A GIS also
provides a method of visualization that often engenders the development of additional
research questions. As researchers are able to symbolize changes in data values using a
spatial environment as the backbone for the study, they may be able to identify new areas of
needed research or additional research questions previously not identified. Thus, the use of a
GIS as a DSS provides the basis for improved decision making processes and allows for the
development of data models that can be used to replicate a data structure as projects grow or
are transported to other applications.
1.1.2 Data Models
Data collection often occurs in multiple phases via different methods and results in multiple
independent and related databases existing as separate data sources. To provide a
comprehensive DSS, these data sources must be fully understood and the relationships
between them must be modeled correctly in an organized manner (Lam et al. 1994).
Linkages between databases increase the interoperability of the system. Interoperability is
the cooperation among information systems to provide services, index resources, and execute
functions across the system without the users’ implicit knowledge of the underlying
results in more robust and complex queries. A GIS provides an environment in which data
models can be used to promote interoperability with the use of geographic relationships to
link independent data sources via their geography.
1.1.3 Use of a GIS
A GIS is most commonly associated with the ability to visualize spatial data. However, a
GIS is actually a sophisticated tool that allows for the query and analysis of non-spatial data
as well as display of spatial information. Relationships between non-spatial (tabular) and
spatial data allow a user to view, edit, and query both data types within the GIS environment.
That is, tabular data can be visualized in a spatial setting with symbolization used to identify
variations in the tabular data. GIS provides an excellent visual tool for decision-makers,
however, interacting with a GIS can be cumbersome for those without much GIS experience.
The learning curve can be steep and the system may not be intuitive (Hare et al. 2003; Koch
and Denike 2001). This experience grows more difficult as the data complexity issues
increase. That is, as multiple datasets of varying scales and data types are combined, the
complexity of the data increases. Increased data complexity requires the use of a properly
developed model to develop a reasonably easy to use solution for the end-user.
This project explored the use of GIS to integrate the multiple complex datasets needed to
study the potential impact of parks and their relationship to the physical activity of children.
This study was designed to examine the role that neighborhood parks may play in reducing
1.2 Increased Childhood Obesity
Public concern regarding childhood obesity has steadily increased as the proportion of people
who are overweight and obese has increased in all sex, age, race, and education subgroups
for the past several decades (Mokdad et al. 1999; Committee on Prevention of Obesity in
Children and Youth 2005). Being overweight and obese are linked to the development of a
number of chronic diseases, including hypertension, hyperlipidemia, diabetes mellitus, and
osteoarthritis (Flegal et al. 1998). Studies have found that regular physical activity decreases
the incidence of these chronic diseases, as well as colon cancer, depression, and anxiety
while achieving decreased weight (USDHHS 1996). Research has also confirmed that obese
children had a significantly lower daily activity level (Trost et al. 2001). Therefore, the
relationship between physical activity levels and obesity needs investigation and in particular
the environments that can promote physical activity.
Past approaches to increasing physical activity, such as counseling, health classes and
physical education classes, lunch monitoring programs, and others have proven ineffective in
reducing obesity (Gard and Wright 2005). So a new approach is being tested to encourage
physical activity by modifying local landscapes to enhance community access to trails and
parks (Bedimo-Rung et al. 2005). By offering more options for safe park-based recreation,
communities can potentially promote increased physical activity and reduce childhood
physical activity performed within parks, and the public impression of parks (Bedimo-Rung
et al. 2005).
1.3 Investigating Parks for Active Recreation for Kids (I-PARK) Project Overview
In an effort to examine the relationship between local neighborhood park features, such as
the type of play equipment, fields, or facilities and the level of physical activity by children,
researchers at NC State University formed the Investigating Parks for Active Recreation for
Kids (I-PARK) project. This project, which studied 20 parks in Durham, NC, was funded by
the Robert Wood Johnson Foundation, Active Living Research program.
The I-PARK project intended to establish relationships between the presence, type, or
condition of park attributes with the level of physical activity of children observed in the
park. Researchers also examined whether age, race/ethnicity, socioeconomic status, and
gender contributed to differences in park use or level of physical activity. Additionally, the
I-PARK project examined park service areas based geographic features such as local highways
and roads, crime data, and other census information. In this effort, the I-PARK team
gathered five datasets across the 20 parks via different methods. These datasets represented
park feature data, zone-based activity observation data, zone-based interview data, park
service area data, and point-based activity data.
1.3.1 Park Environmental Audit Data
The park feature dataset was collected using the Environmental Assessment for Public
researchers systematically inventory public areas for features and associated attributes
(Saelens et al. 2006). In the I-PARK study, collected features included the presence of play
sets, swings, playing fields, etc, as well as condition of the features. Examples included the
presence of play set material (plastic, metal, etc.), trail ground cover (paved, gravel, etc.),
restroom proximity, water fountain condition, etc. This data was collected by trained teams
of two using field inspections. The data were collected on PCs and stored in Microsoft
Access™ (Microsoft 2007a) forms. The forms were created based on the EAPRS Direct
Observation Tool.
1.3.2. System for Observing Play and Recreation in Communities (SOPARC) Observation Data
Zones were created to facilitate the collection of the SOPARC data to make SOPARC
observation data collection more management. Multiple park zones were delineated for each
park, based on potential activity or play areas. For example, an open play field was
designated as one zone, and an area with a play structure was identified as a separate zone.
The SOPARC observation procedure was used in this study for assessing physical activity in
parks (McKenzie and Cohen 2006). It provided a validated method to assess activity level,
activity type, gender, estimated age, and ethnic group of park users based on visual scans of
park zones. The data were collected by trained teams of two who performed visual scans of
1.3.3 Interview Data
Interviews were conducted to document information regarding park activities, frequency of
visits, mode of transportation to the park, impressions and opinions regarding the park, and
other data. The interviews were conducted with park users based on convenience sampling
by the team members who were collecting SOPARC observation data. This dataset was
collected using paper forms and then were data entered into a Microsoft Excel spreadsheet.
1.3.4 Park Service Area Data
Park neighborhood characteristics may play an important role in how potential park users
view or use a park. For example, the presence of a major highway between an area of houses
very close to a park, may prevent residents of those homes from using the park. The standard
practice for determine a park service area is to identify a quarter mile circumference around
the park boundary. For this project, the park service area was edited based on specific
attributes of the neighborhood (e.g., highways) to determine an alternate representation of the
service area of the parks. These edited areas were developed using urban land form (street
center-line, the city/county parcel, the building footprint, and the building permit data),
crime, and census data that was collected from Durham County and the US Census Bureau.
The data was then processed based on the Twin Cities Walking Study (Forsyth et al. 2007).
For each park, the urban land form measurements of net residential density, street
connectivity, average block size, percentage of retail use, and lot coverage, as well as the
The result was an ESRI shapefile for each of the 20 parks that contained urban land form,
crime, and census data in the attribute table for the alternate park service area.
1.3.5 Behavioral Mapping Data
Behavioral mapping is another observation method used in this study to assess behavior of
individuals in a specific location (Sommer and Sommer 2002). Observations were conducted
based on individual point locations within a specified area of the park. For this project, the
behavioral mapping dataset was collected at three of the twenty parks by trained teams of
two individuals. The team members used a paper map to identify point location and a
handheld device to record specific attributes about the observed children. For example, if a
child was observed to be using a swing, the observers recorded the point location of the child
on the paper map and attributes about the child (activity level, gender, estimated age group,
interactivity with other children or adults) using the handheld device.
1.4 Utilization of Geographic Information Science (GIS)
The project objectives for I-PARK required cross-cutting data analysis. For example,
researchers would like to determine if the presence of play sets has an influence on physical
activity level. This analysis requires the query of the park environmental audit data and the
SOPARC observation data.
data to be realized. A GIS represented an opportunity to link these various data sources
together using geography as the linking mechanism. The park environmental audit data,
SOPARC observation data, and interview data all represented tabular data that could be
linked to a zoned area within each park. The park service area data and behavioral mapping
data represented spatial data that had a geographic representation built into the data
collection process. However, these datasets were not specifically linked to zones as
originally collected.
1.4.1 Software Product
The ESRI ArcGIS® (ESRI 2007b) product package was selected for the development of the
GIS management tool to make this linkage. The choice was made primarily because of the
product’s presence at NC State University and many other universities and agencies. The
ArcGIS product package was also chosen because it contains a rich spatial data structure, the
personal geodatabase. This structure is based on Microsoft Access and was readily
compatible with each of the existing I-PARK data structures.
1.5 Project Objectives and Research Questions
The overall objective of this research was to design and test a GIS data structure to support
research queries that required interconnection of the I-PARK datasets. To perform analyses
across the datasets, we developed a generalized data model in ESRI ArcGIS that created
relationships between and within the five data types and provided a means for the end-user to
view and query the data. The underlying data model was organized on spatial elements (park
zone. For example, collected park environmental audit data (e.g., presence of bathrooms)
was linked to the park zone and displayed in a GIS for visualization by the end-user.
The ESRI® geodatabase architecture was utilized to integrate and interconnect the spatial and
non-spatial databases and provide interoperability. For example, the non-spatial data
regarding play structure attributes was linked to the zone (spatial data) in which the play
structure was present.
An additional goal of this work was to develop and test a field collection tool that allowed
point-based behavioral mapping of children at play utilizing ArcPad® on a handheld device.
This streamlined technique allowed for the user to select the point location on a map in
ArcPad, record specific observation attributes for each point, store the observation data in a
2.0 Literature Review
2.1 Study of Neighborhood Parks and Park Use
Recreation-related park research has focused on multiple variables that influence park use
(e.g., safety concerns, neighborhood design, service area, etc.) and the level of physical
activity exhibited in parks. With the increase in obesity in the US, especially childhood
obesity, researchers are trying to determine methods by which parks can influence the
activity level of children using the parks. Additionally, data is being collected to determine
environmental attributes that may act as deterrents to park use by neighborhood residents.
Researchers are also using data to determine better ways to service the community with
opportunities for physical activity as general means for increasing overall health and
decreasing childhood obesity. For example, time spent outdoors has been shown to be a
strong predictor of children’s physical activity (Baranowski et al. 1993; Burdette et al. 2004;
Klesges et al. 1990; Sallis et al. 1993). Furthermore, research consistently shows associations
between physical activity and access to parks and recreation areas (Sallis et al. 2000; Sallis
and Glanz, 2006).
2.1.1 Childhood Obesity
Increasing rates of adult and childhood obesity have been studied and documented by the
Centers for Disease Control and Prevention (CDC). Between 1963 and 2004, CDC found
that obesity rates increased from 4 to 19% for children ages 6 to 11 years and from 5 to 17%
for children ages 12 to 19 years (Committee on Progress in Preventing Childhood Obesity
observed that obesity rates increased from 5 to 14% for children ages 2 to 5 years
(Committee on Progress in Preventing Childhood Obesity 2006; Ogden et al. 2006). In 2006,
Ogden et al. documented that 33.6% of US children were obese (17.1%) or at risk for
becoming obese (16.5%) (Ogden et al. 2006). In 2004, Sondik projected that, at current
rates, 20% of US children and youth will be obese as adults (Committee on Progress in
Preventing Childhood Obesity 2006). Additional researchers confirmed that a child that is
classified as overweight or obese has an increased chance of remaining overweight or obese
in adulthood (Frank et al. 2003, Freedman et al. 2001).
2.1.1.1 Health Disparities in Populations
Health disparities between different ethnic/racial groups, as well as between different
socio-economic groups, have been well documented (Flegel et al. 1998; Sobal and Stunkard 1989).
Some researchers have focused on the social risks (e.g., poverty, low parent education level,
etc.) that play a role in the decreased quality of the health of children (Larson et al. 2008;
Lavizzo-Mourey et al. 2005; Chen et al. 2006). Many of these researchers have documented
that race/ethnic and socioeconomic status come together to result in elevated obesity and
disease risk for specific racial/ethnic minority populations (Williams et al. 1997).
Adolescents in poor households are overweight or obese twice as often as those from middle-
and high-income households. This is distinctly true among African American and Mexican
American women (Committee on Progress in Preventing Childhood Obesity 2006). Other
2.1.2 Role of Physical Activity in Curbing Childhood Obesity
As a result of this dramatic increase in obesity in children, multiple government campaigns
have been launched to increase public awareness regarding eating healthy and increasing
physical activity (Gorton 2000). For example, the US Department of Health and Human
Services (USDHHS) Healthy People 2010 program has 30 goals that include increasing “the
proportion of adolescents who engage in moderate physical activity for at least 30 minutes on
5 or more of the previous 7 days”; increasing “the proportion of persons aged 2 years and
older who consume at least two daily servings of fruit”; and reducing “the proportion of
children and adolescents who are overweight or obese” to 5% by 2010 (USDHHS 2001).
However, studies have found that few education campaigns have the intended large impact
that is desired.
In an effort to identify causes of obesity, researchers have found that physical inactivity is a
significant contributing factor in developing childhood obesity (Trost et al. 2001, Weinsier et
al. 1998). Additionally, researchers found that time spent outdoors has a strong correlation to
physical activity (Klesges et al. 1990; Burdette et al. 2004). Therefore, time spent outdoors
in open spaces, such as parks, should be encouraged as a method to decrease obesity in
children.
2.1.3 Outdoor Activity
It is through a need for a multi-armed effort that researchers are studying physical
found two major obstacles to physical activity by children: 1) physical distances to school or
other destinations and 2) traffic dangers (Frank et al. 2003, CDC 2002). Decreased activity
by adults and children has led researches to study neighborhood design and its impact on
physical activity. Studies have shown that adolescent access to recreational facilities and
physical activity opportunities are significantly related to physical activity (Mota et al. 2005;
Humpel et al. 2002). Additionally, observational studies of preschool children found the
children to be much more active when playing outdoors as opposed to indoors (Sallis et al.
1993, 1998; Baranowski et al. 1993; Klesges et al. 1990). Their activity levels were strongly
associated with the number of play spaces near their homes and the amount of time spent in
those spaces (Sallis et al. 1993, 1998; Blommaert 1981). Through these findings,
modifications to the location community, such as adding walking/biking trails and improving
parks, are being made. The goal is to increase physical activity by making it easier to access
(Bedimo-Rung et al. 2005). Communities should offer more recreation options in a safe
environment and promote increased physical activity within parks or using physical activity
as a form of travel to/from parks (Committee on Progress in Preventing Childhood Obesity,
2006). For these reasons, local authorities must make well-informed decisions regarding
placement or improvement of parks or recreation opportunities.
2.1.4 Ecological Approach to Health Promotion
As previously described, policy is being altered to change the focus from one limited set of
change at the interpersonal level (McLeroy et al. 1988). This ecological approach allows for
greater opportunities for research and the collection of a large amount of independent data.
The datasets, in many cases, may have increased value when linked together and queried
simultaneously, rather than queried independently of each other.
2.1.5 Investigating Parks for Active Recreation for Kids (I-PARK) Overview
The I-PARK project gathered multiple datasets to study the relationship between local
neighborhood park features and the level of physical activity by children. Researchers also
looked to determine if age, race/ethnicity, socioeconomic status, and gender play a part in
differences in park use or physical activity. Additionally, the I-PARK project developed
alternate park service areas based on urban land form, crime, and census data to determine a
better representation of neighborhood park users. To achieve these goals, the project
required the collection of five independent datasets that were gathered using the methods
detailed below.
2.2 Data Collection Methods
2.2.1 Environmental Assessment of Public Recreation Spaces (EAPRS) Data
The environmental audit data was collected using the Environmental Assessment of Public
Recreation Spaces (EAPRS) Direct Observation Tool. The validated instrument is designed
to gather a comprehensive assessment of a physical environment through observation rounds
(Saelens et al. 2006). Researchers developed the instrument via an initial observation test at
playgrounds in Cleveland, Ohio, modifications based on observer comments and low
(Saelens et al. 2006). The instrument includes a validation process that is designed to the
check the inter-reliability between teamed observers. For the I-PARK project, the EAPRS
instrument gathered data regarding Durham neighborhood park attributes and qualities of the
attributes. Examples of gathered attributes include the presence of trails, presence of play
equipment, presence of bathrooms, etc. The instrument also gathered the condition of the
park attributes.
2.2.2 System for Observing Play and Recreation in Communities (SOPARC) Observation Data
The System for Observing Play and Recreation in Communities (SOPARC) tool is a
validated direct observation tool designed to gather the physical activity level and
characteristics of park users (McKenzie and Cohen 2006). SOPARC is one of many
observation instruments but it specifically designed for observation in home or
non-school areas (McKenzie 2000). The tool is defined by its coded categories and protocols for
data collection that provide a rich dataset. The tool has been used in multiple studies to
observe physical activity of adults and children (McKenzie et al. 2005, 2006). For the
I-PARK project, the SOPARC tool provided a validated method to assess activity level,
activity type, gender, estimated age, and ethnic group of children based on visual scans of
park zones.
determine public perceptions of the park or reasons for park use (Cohen et al. 2007). For the
I-PARK project, interviews were conducted to document responses to numerous questions
regarding the park and the general area, such as frequency of visits, mode of transportation to
the park, impressions and opinions regarding the park, feelings about park safety, and other
data.
2.2.4 Park Service Area Data
Research has examined the relationship between neighborhood design and physical activity
(Atkinson et al. 2005), as well as the impact of neighborhood characteristics and
demographics on individuals walking to work (Frank 2000). Additionally, researchers have
investigated the relationship between perceived neighborhood safety with respect to crime
(Romero et al. 2001), physical barriers (Timperio et al. 2004), and environmental health
concerns (Goodway and Smith 2005). As a result, I-PARK researchers determined that
alternate representations of the park service area (rather than the typical quarter mile service
area) were necessary for determining a better representation of park user population. The
urban land form, crime, and census datasets were gathered from Durham County and the US
Census Bureau. The data was then processed using the Twin Cities Walking Study as the
model (Forsyth et al. 2007). .
2.2.5 Behavioral Mapping Data
Behavioral mapping is another systematic observation method used to document observed
behavior in a specific environment. Behavioral mapping has been used by researchers to
individual with disabilities move around a classroom (Charlop et al. 1983), how visitors
interact with information presented in a museum (Choi 1999), or how ambient scent impacts
social interaction (Zemke and Shoemaker 2007).
Unlike SOPARC, behavioral mapping is collected based on points that represent the location
of individuals. For the I-PARK project, behavioral mapping observations were collected for
a subsection of three parks in the study where maps of point locations of children at play
were created. Observers also recorded activity level, gender, estimated age group, and
interactivity with other children or adults using a handheld device.
2.2.6 Data Complexity
Large data collection projects often result in multiple independent datasets. These datasets
can often be found in different data structures and be difficult to analyze. As a result, the
value in the data is within the effective management of the data (Arvanitis et al. 2000). To
do so, provides an environment in which multiple datasets with a complex data structure can
be utilized for better decision making through visualization and cross-query analysis.
2.3 Decision Support Systems
Project and resource managers often find themselves making decisions based on limited data
or by independently reviewing separate data sources. The development of a comprehensive
analysis, developing better knowledge, and making better decisions (Stewart et al. 2000).
Additionally, an environment in which different data types and sources can be integrated and
analyzed together may provide cost and time savings to the project and resource managers.
Cities can make informed decisions regarding park improvements and modifications using a
DSS that integrates multiple data sources and allows for cross-data queries. Use of a
Geographic Information System (GIS) as a DSS is a solution that allows these types of
analyses (Stewart et al. 2000). A GIS also provides a method of visualization that may be
necessary to promote improved park policy to individuals in other groups or agencies.
2.3.1 Data Management and Data Models
Complex data structures that represent multiple independent dataset require good data
management to fully realize the value of the data. However, to provide the proper
management solution, system requirements, functionality, and data relationships must be
defined early in the conceptualization process (Bugg et al. 2002). Even with a clear concept,
the development process is an iterative process that requires multiple versions to ensure
compliance with project goals (Bugg et al. 2002). Further benefits can be obtained from a
data management solution via the development of a standard data model. The use of a data
model provides the flexibility to make a defined solution transportable to other projections or
applications (Rizzoli and Young 1997).
2.3.2 Use of a GIS
Use of a GIS provides a unique solution to the need for an effective data management by
of a study site. Through these relationships, tabular data can be visualized and used to easily
and cleanly convey data to decision makers. Visualization creates a strong impact and
provides an opportunity for both technical and non-technical audiences to gain an
understanding of a concept (Swain 2001). Through this opportunity, parks or other
management entities can use a GIS to query and visualize their resources to garner support
for decisions or to investigate further inquires.
2.3.3 Park Management
Multitudes of GIS-based resource management systems are in use in various disciplines. The
application of these systems may be small localized issues such as linking urban park use
with local pond water quality decisions (Stoianov et al. 2000) or for Canadian Goose
population control decisions (Hebou et al. 2004). Or the application may tackle large
cross-boundary issues such as ecosystem management for all US federal forests (Rauscher 1999).
On the other hand, GIS can be used at a national scale. The US National Park System (NPS)
utilizes GIS in the Inventory & Monitoring program to “collect, organize, and make available
natural resource data and to contribute to the Service’s institutional knowledge by facilitating
the transformation of data into information through analysis, synthesis, and modeling” (NPS
2006). In addition, the NPS uses GIS to identify priority areas for fire treatment management
and evaluate progress towards local ecological goals (Keifer et al. 2000; Caprio et al. 1997).
The use of GIS in the recreation research aimed at park use and physical activity is fairly
limited. However, researchers have utilized a GIS to visualize neighborhood characteristics,
census data, and physical activity level for the Trial of Activity for Adolescent Girls
(Ashwood and Overton 2003). Researchers working with the Twin Cities Walking Study
also utilized a GIS to generate urban form measurements based on existing transportation,
crime, and census data (Forsyth et al. 2006). The I-PARK project takes the research a step
further by combining five collected datasets and developing a DSS that provides both a
3.0 Objective
The purpose of this research was to develop a data integration system that allows the
simultaneous query of complex, independent, spatial datasets. These datasets (five) represent
surveys of parks for typical features, two types of observations of child play activities,
interview data, and park service area characteristics.
The objective of this project was to develop a system that allows cross-data investigation
relationships between park attributes and park use. Two questions were framed for
investigation within this project: 1) “Is the presence or features of play equipment potentially
related to use of a park?” and 2) “Do local crime statistics potentially affect park users’
feelings about park safety?”. The ability to test such questions constituted the check of the
data system viability. The transportability of the system was validated by importing data
from a second park into the model and performing the same queries.
This project also had an additional objective to create a fully electronic behavioral mapping
data collection system. This electronic system was designed to mimic the current manual
mapping technique, while minimizing errors from digitizing points or data collection, and
decreasing data collection and data preparation time. To determine if this objective was met,
4.0 Method: Data Collection and Organization
4.1 Overview
This chapter will provide an overview of the five datasets utilized in this study and a review
of the study area. The data collection techniques, original data storage method, and
preprocessing techniques are also described. The next chapter will discuss the development
of the ESRI geodatabase data model and the model validation process.
4.2 Investigating Park for Active Recreation for Kids (I-PARK) Project Data Overview
For this project, twenty-one parks were originally selected for data collection in 2007 in
Durham, NC. One park was dropped early in the data collection process due to safety
concerns, therefore, data for 20 parks (Figure 1) were collected. The information collected
included park features data (environmental audit dataset), zone-based observation data
(SOPARC dataset), and park service area data. In addition, a convenience sample of
interview data was performed at 13 parks. A lack of individuals present in seven of the parks
reduced the sample set to 13 from 20. A second observation dataset that collected point
locations of children (behavioral mapping dataset) was collected at three parks. The three
parks were selected based on the high amount of usage observed during the SOPARC
observation data collection process. All five datasets were collected and stored in
independent data structures. The five datasets and the collection methods are detailed in the
Table 1. Description of I-PARK Datasets
Dataset Type and Format Observation Geography Number of Parks for Data Collection Original Collection Method Purpose Park Environmental Audit Data Tabular Park Zone (Polygon)
20 Collected on Tablet PCs in 20 parks and
originally stored in multiple MS Access databases.
Documents
characteristics/features of each park zone such as the presence of bathrooms, play areas, play equipment, paved roads, etc. SOPARC Observation Data Tabular Park Zone (Polygon)
20 Collected on paper forms and later
keyed into multiple MS Excel
worksheets.
Documents park use and characteristics (e.g., accessibility, usability, etc.), as well as activity type and level, gender, ethnicity, and age of park users (i.e., children) based on scans of park zones.
Interview Data Tabular
Park Zone 13 Collected on paper forms and later keyed into one MS Excel worksheet.
Documents park user information such as preferred activity types, modes of transportation to the park, impressions of the park, and more based on park zones. Park Service Area
Data Spatial
Park (Polygon) 20 Data obtained from US Census Bureau and the City of Durham (crime, parcel,
transportation).
Determines park service area based on urban land form measurements, census data, and crime statistics. Behavioral Mapping Data Spatial Point (of observed child)
3 Points placed on paper maps and
attributes collected via handheld device. Points later digitized.
A case study was conducted within the scope of this project to collect points and attributes via an ArcPad Data Collection Tool.
4.2.1 Creation of Park Zones
Prior to data collection, it was determined that zoned areas within parks would be necessary
for manageable and meaningful data collection. Parks represent various sized areas defined
by different types of play structures or activity functions (e.g., a play structure area is in a
different location than a soccer field). Therefore, depending on the size of the park, each
park was subdivided into a number of zones based on defined areas of activities. Each zone
was given a unique number for that park. Observations collected at the zone level were
coded with the appropriate zone. However, because some park characteristics are not valid at
the zone level (e.g., presence of park entrance), each park was also given a general zone
(zone 888) for general park attributes. Figures 2 and 3 illustrate the zones designated for data
collection at Forest Hills Park.
Within this data model, the zones are the linking element that is used to create relationships
between datasets. These relationships will be discussed in more detail in Section 4.3.3.1.
Figure 3. Aerial Photography of Forest Hills Park with Park Zones Identified
4.3 Environmental Audit Dataset 4.3.1 Data Collection Method
The Environmental Audit dataset was collected using the Environmental Assessment of
Public Recreation Spaces (EAPRS) Tool (Saelens et al. 2006). EAPRS is a comprehensive
inventorying tool that provides researchers with a method to catalog the elements and
characteristics of public recreation spaces through observation. This tool also provides a
method to test the reliability of the observers through paired observations (Saelens et al.
Data collection was performed using two teams of two observers in September and August
2007. Each park was visited at least once by one of the teams and primary and secondary
observers were reversed at least once in each park to perform reliability rounds to test the
consistency of observations.
4.3.2 Data Organization and Storage
Data was collected by multiple teams of two using multiple tablet PCs. These observers
visited multiple parks (sometimes on the same day) over multiple weeks. The data was
collected using Microsoft Access forms and stored in 15 data tables, depending on the data
type (e.g., trails data was stored in the A_Trails table). To promote consistency, checkboxes
or dropdown boxes were provided whenever possible and the data was stored in a systematic
database structure. The data elements provided in the dropdown boxes were defined in 12
lookup tables (e.g., LUT_Facility) within the database structure. The 27 tables included in
each database are detailed in Table 2. Within each database, observation data were stored in
15 of the 27 tables in (e.g., trails attribute information were collected in the A_Trails table).
A detailed description of the Microsoft Access tables, field values, and sample screen shots
Table 2. Park Environmental Audit Database Table Descriptions
Database Table Name Purpose
A_Trails Recorded information regarding observed park trails as entered into the A_Trails form. Information recorded includes: width, paved, flatness, shade, proximity of bathrooms, etc. Key field:
ObservationUnit.
C_GeneralAreas Recorded information regarding observed park trails as entered into the C_GeneralAreas form. Information recorded includes: open space cleanliness, open space condition, proximity of roadway, etc. Key field: ObservationUnit.
D_WaterAreas Recorded information regarding observed park trails as entered into the D_WaterAreas form. Information recorded includes: the presence and number of pools, presence of bathrooms, presence of showers, condition of water area, etc. Key field: ObservationUnit.
E_Eating_Drinking Recorded information regarding observed park trails as entered into the E_Eating_Drinking form. Information recorded includes: presence of picnic area, cleanliness of picnic area, presence of water fountains, type of ground surface, etc. Key field: ObservationUnit.
F_Facilities Recorded information regarding observed park trails as entered into the F_Facilities form. Information recorded includes: presence of bathrooms, bathroom cleanliness, presence of shelters, etc. Key field: ObservationUnit.
H_SittingFeatures Recorded information regarding observed park trails as entered into the H_SittingFeatures form. Information recorded includes: presence of benches, presence of tables, proximity of parking, etc. Key field: ObservationUnit.
I_Landscaping Recorded information regarding observed park trails as entered into the I_Landscaping form. Information recorded includes: presence of flowers or shrubs, presence of natural area, condition of shrubs, etc. Key field: ObservationUnit.
J_GeneralAesthetics Recorded information regarding observed park trails as entered into the J_GeneralAesthetics form. Information recorded includes: character of park area, general park condition, general park cleanliness, etc. Key field: ObservationUnit.
K_AccessRelatedFeatures Recorded information regarding observed park trails as entered into the K_AccessRelatedFeatures form. Information recorded includes: proximity of parking, presence of bike racks, type of parking lot surface, etc. Key field: ObservationUnit.
L_DirectiveFeatures Recorded information regarding observed park trails as entered into the L_DirectiveFeatures form. Information recorded includes: presence of signs, maps, information, etc. Key field: ObservationUnit. LUT_Category Lookup Table for park facility type as used in the Observation_Record
form.
LUT_Device Lookup Table for Device ID (tablet PC ID) as used in the Observation_Record form.
Table 2 (continued).
Database Table Name Purpose
LUT_Observ Lookup Table for Observer Code and Name as used in the Observation_Record and Q_ParkInformation forms.
LUT_ParkName Lookup Table for Park Name and ID (or Code) as used in the Observation_Record and Q_ParkInformation forms.
LUT_PER Lookup Table for specifying percentages as used in multiple forms. LUT_PEX Lookup Table for specifying a category of condition as used in
multiple forms.
LUT_PROX Lookup Table for specifying proximity as used in multiple forms. Material Lookup Table for bench and trails materials as used in the A_Trails
and
N_PlaySetFeatures Recorded information regarding observed park trails as entered into the N_PlaySetFeatures form. Information recorded includes: presence and types of play sets, types of ground cover associated with the play sets, play set materials, etc. Key field: ObservationUnit.
O_OtherPlayComponents Recorded information regarding observed park trails as entered into the O_OtherPlayComponents form. Information recorded includes: presence of other types of play components, play component materials, types of ground cover associated with the play components, etc. Key field: ObservationUnit.
Observation_Record Recorded information regarding the observation as entered into the Observation_Record form. Information recorded includes: observer name, device ID, start time, etc. Key field: ObservationUnit. P_AthleticFieldsAndOtherAreas Recorded information regarding observed park trails as entered into
the P_AthleticFieldsAndOtherAreas form. Information recorded includes: presence and types of play fields, condition of courts and fields, proximity of courts and fields, etc. Key field: ObservationUnit. PEX_Scaling A Lookup Table used to specify condition scaling as used in the
LUT_PEX table.
Q_ParkInformation Recorded information regarding observed park trails as entered into the Q_ParkInformation form. Information recorded includes: presence of community center, entrance sign, storage, greenway trail, etc. Key field: ParkID (also known as ParkCode).
4.3.3 Data Preparation
Data was collected by multiple teams of two using multiple tablet PCs. These observers
visited multiple parks (sometimes on the same day) over multiple weeks. The data was
collected using Microsoft Access forms and stored in multiple data tables, depending on the
data type (e.g., trails data was stored in the A_Trails table). As a result of this data storage
structure, the data was provided to the author in the form of 15 separate databases (that each
contained in the Observation_Record table with the data recorded in tables A, C, D, E, F, H,
I, J, K, L, N, O, and P (as described in Table 2), based on the “ObservationUnit” field. This
was achieved through a series of MakeQuery and AppendQuery functions in Microsoft
Access. These queries joined the data fields found in the Observation_Record table with the
data elements found in each of the other tables. The data found in table Q was not collected
based on the ObservationUnit field. Therefore, using the same MakeQuery and
AppendQuery functions, table Q data were joined with the Observation_Record data based
on ParkID field. These processes resulted in 14 new tables within the 15 databases (210
tables in total).
To ensure the ability to query, the 15 databases needed to be consolidated into one database.
In this effort, an empty shell database was created with 14 tables (A, C, D, E, F, H, I, J, K, L,
N, O, P, and Q). Another set of MakeQuery and AppendQuery functions were used to merge
the 15 databases together in the new database. In other words, all 15 copies of the A_Trails
data were joined together in one table in a new database. The same was done with
C_General data, and so on. This process resulted in one new database with 14 tables that
represented the data previously recorded and merged with the Observation_Record data. The
fields contained in the 14 tables are described in detail in Appendix 1.
4.3.3.1 Creating a Linking Field
01, etc.). Park zone values were also converted from numeric values to a three character
string value with leading zeros (e.g., zone 1 became zone 001, etc.). A derived ParkZoneID
field was created by concatenating the updated park code with the zone field into the new
field value. This resulted in a unique field for each park and park zone combination across all
the data sources. As an example, Forest Hills Park (ParkCode value of 15) has 11 park zones
so Forest hills Park has 11 unique ParkZoneID values (e.g., Forest Hills zone 2 is represented
as a ParkZoneID of 15002.
4.3.4 Example Data
Table 3 provides an abbreviated example of the data after the Observation_Record data was
joined with the data contained in table A (A_Trails). This table illustrates that there is a
concrete paved trail in park 9, zone 1.
Table 3. Environmental Audit Data Example
4.4 SOPARC Observation Data 4.4.1 Data Collection Method
SOPARC is a validated method used to assess activity level, activity type, gender, estimated
age, and ethnic group of park users based on visual scans of park zones (McKenzie and
Cohen 2006). This dataset was collected for 20 of the parks over eight weeks in May
park was visited at least seven times by teams of two observers on various week and
weekend days during the hours of 9:30 am and 6:30 pm. During park visits, the primary and
secondary observers were reversed at least once in each park to perform reliability rounds.
4.4.2 Data Organization and Storage
The SOPARC observation data were collected as coded values recorded on paper forms and
then transcribed into Microsoft Excel (e.g., a flat data model). The observation form and a
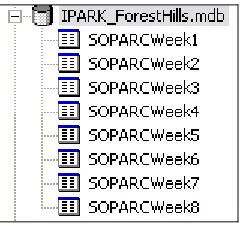
description of the 45 fields can be found in Appendix 2. The author received this data in the
form of one Microsoft Excel workbook with worksheets for each of the eight observation
weeks.
4.4.3 Data Preparation
When reviewing the Excel table, unexpected values were encountered (e.g., “1*” was found
in a numeric-only field). All instances of questionable data were compiled and a series of
questions were posed to researchers. Through this process, values were corrected and the
complete dataset was scrubbed of any invalid values.
A Microsoft Access database was created by importing the data from these Excel files into
eight database tables (Week1, Week2, Week3, Week4, Week5, Week6, Week7, and Week8).
This was achieved using the “Get External Data” and “Import” function in Microsoft Access.