SAHS Detection Based on ANFIS Using Single
Channel Airflow Signal
Minu M Paul 1, Amithab M 2
P.G. Student, Department of Electronics and Communication Engineering, Nehru College of Engineering and Research Centre, Thrissur, Kerala, India1
Assistant Professor, Department of Electronics and Communication Engineering, Nehru College of Engineering and Research Centre, Thrissur, Kerala, India 2
ABSTRACT: The aim of this paper is to present an efficient and accurate detection algorithm for Sleep Apnea-Hypopnea syndrome (SAHS) based on the single-channel airflow (AF) signal. SAHS is a sleep disorder which happens due to the infrequent breathing during sleep or pauses in breathing. Studies show that 80% of patients remain undiagnosed and untreated, which could lead to stroke, heart attack, hypertension or depression. The nasal airflow signals extracted from polysomnography recordings are obtained from PhysioNet apnea–ECG database. The features of the signals are extracted using wavelet transform method. To derive an optimum set of features with minimum redundancy, a mutual information based feature selection method is applied. The features obtained from 8 recordings are used for classification of SAHS by using two classifiers such as AdaBoost (AB) and adaptive neuro fuzzy inference system (ANFIS). Training and testing process have been repeated by using randomly obtained six sequences of whole data. According to the results, the classification accuracies have been obtained as 98.43% and 98.68% respectively. Therefore ANFIS based classification has increased degree of accuracy hen compared to AdaBoost. As well as the use of single channel input makes the real time SAHS detection easier and less complex. So this method can be a valuable solution for saving undiagnosed SAHS patients without disrupting their daily life activities.
KEYWORDS: Sleep apnea-hypopnea syndrome, AdaBoost, Airflow signal, Wavelet, Mutual information, Adaptive neuro-fuzzy inference system.
I. INTRODUCTION
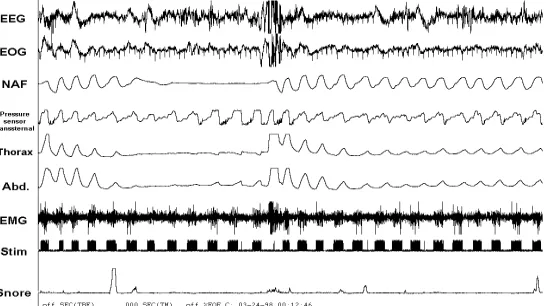
Sleep Apnea-Hypopnea Syndrome (SAHS) is a most common sleep-related breathing disorder. It is characterized by the repeated occurrence of involuntary episodes of reduction in respiration due to partial or total collapse of the upper airway while asleep [1]. Studies have been conducted around the world over the last few years, which have estimated that approximately 4% of men and 2% of women of the age of 30 to 60 years suffer from SAHS [2]. And 80% of patients remain undiagnosed and untreated for many years as they are unaware of their own symptoms [3]. Undiagnosed SAHS patients have risk factors of automobile and industrial accidents, cognitive impairments, stroke and cardiovascular diseases [4] [5]. Common symptoms of SAHS include snoring, daytime sleepiness, depression, tiredness and low concentration [6] [7].
A patient suffering from SAHS has respiratory pauses that repeat throughout the night. The duration of this pauses vary with depends upon patient health condition. Common duration of the apnea event is about 20 to 40 seconds [8]. A hypopnea is defined as a respiratory pause that meeting the duration with an associated reduction around 30 to 50% in breathing. In the case of apnea, the associated reduction is about 90% or even totals breathing cessations. Respiratory pauses associated with the presences of an apnea event are usually lead to significant reduction in oxygen saturation level and causes arousals. This fall is proportional to the causing airflow reduction [10] [11].
Electrooculogram (EOG), Thoracic respiratory movement, abdominal respiratory movement, Electroencephalogram (EEG), Electromyogram (EMG), Oxygen saturation of blood (SpO2) and Airflow (AF) [12]. The resulting recording called polysomnographic (PSG) is then visually inspected offline by a medical specialist. Although this method’s efficiency is well known but time is required to derive the parameter apnea- hypopnea index(AHI), which is used as an indicator to estimate SAHS and its severity [13]. So this makes PSG a time consuming, expensive as well as the complex procedure for detecting SAHS [14] [15] [16].
A number of approaches have been developed to reduce the complexity, cost and time delay of PSG procedure [14]. One common approach is the computation of different values of AHI, like the respiratory disturbance index (RDI) from AF, the apneic related events from ECG or the oxygen desaturation index (ODI) from SpO2 are used for diagnosis of SAHS [17] [18] [19]. By using reduced set of signals from PSG can also help to detect the SAHS. Single channel signals such as photoplethysmography (PPG) and SpO2 are also used for detection of SAHS.
In this paper, the single channel AF signal recording analysis is proposed for the detection of SAHS. This work focuses on evaluating the performance of SAHS detection methods based on the global analysis in single channel AF. This study was aimed to obtain an optimum set of features from AF signal. The proposed method starts with feature extraction, which is obtained by using wavelet decomposition of signals. The analysis in frequency domain is justified due to the overnight recurrence of the events [20] [21] [22].These spectral features can help to characterize SAHS as well as other diseases [23]. In order to remove redundant features, a feature selection stage based on the mutual information is included [22]. The feature selection algorithm used for selecting optimum sets of features on the basis of their relevancy and redundancy [25]. And then finally they are classified by using two classification methods for real time sleep apnea detection. The boosting algorithm called AdaBoost is used for constructing a weak classifier into strong classifier so as to improve the diagnosis [26]. Another classification method known as ANFIS is also used to distinguish SAHS and its severity.
Hence, we estimated two cases: the first one is a binary classification in which the main aim is to determine the SAHS-positive (presence) or SAHS-negative (absence) of SAHS and the second one is multi-classification in which the objective is to detect the severity condition of SAHS. Severity level of SAHS can be categorized as no-SAHS, mild-SAHS, moderate-SAHS and severe-SAHS.
II. POPULATION UNDER STUDY
For the evaluation of the methodology, PSG recording of 8 sleep apnea subjects was used. AF recording was acquired from Apnea-ECG database in the PhysioNet databank. Physio Net is an online forum for dissemination and exchange of recorded biomedical signals. It provides free electronic access to Physio Bank data and Physio Toolkit software via the World Wide Web. Physio Bank currently includes databases of multi-parameter cardiopulmonary, neural and other bio medical signals from healthy subjects and patients in a variety of conditions.
The National Institutes of Health’s National Centre for Research Resources (NIH-NCRR) is the sponsor of creation and maintenance of PhysioNet as the major public outreach component of the Research Resource for Complex Physiologic Signals. The free distribution Apnea-ECG Database was used for the evaluation process in this study, combined for the PhysioNet/Computers in Cardiology Challenge 2000.
The database contains 70 recordings, sampled at 100 Hz, approximately 8 hours long with simultaneously recorded respiration signals. But only 8 recordings (age: 43.3 ± 8.3 years, 7 M and 1F) of them include respiratory signals which include nasal airflow, abdominal and oxygen saturation. For the evaluation of proposed method, we use only a single channel signal which is selected as the nasal airflow signal. So the airflow signal is extracted from the database is stored as .mat file (this can be loaded to the MATLAB software). The apnea annotation in the recordings was done by sleep disorder experts using standard criteria with signals analysis. So, each of the recordings has label as ‘A’ or ‘N’ and it indicates the presence or absence of apnea respectively during that time.
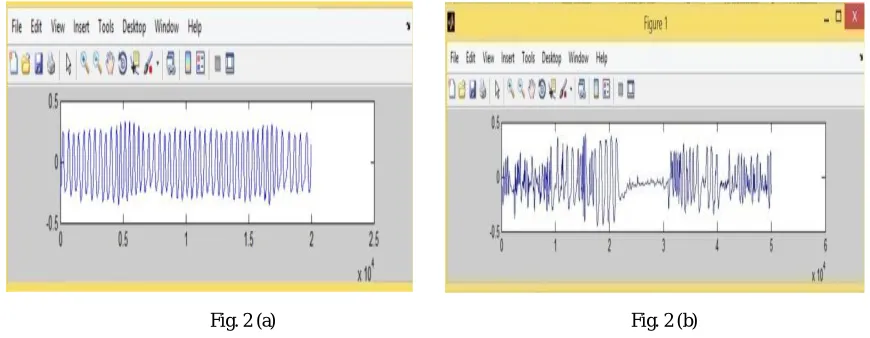
Fig. 2 (a) Fig. 2 (b)
Figure 2: Represents the air flow signal which is obtained from nasal cavity without apnea event and air flow signal obtained with apnea event in figure (a) and (b) respectively.
III.RELATED WORK
Our methodology consists of four steps. Feature extraction stage is performed by using wavelet decomposition of AF signals. Next, an optimum set of extracted features is obtained by using a feature selection process. Then an Adaboost algorithm and ANFIS classification are adopted to determine real time SAHS condition and its severity.
1. Feature Extraction
The extracted AF signal from the PSG can be used as input to the feature extraction stage. The AF signal of patients suffering from SAHS may persistently modify throughout the night. This unsystematically varying behavior of AF signal will lead to frequency domain analysis. Wavelet transform forms a general mathematical tool for signal processing with many applications in AF data analysis. The wavelet decomposes signals over a dilated and translated function called wavelet which transforms the continuous function into highly redundant function. It decomposes the signal into a number of time shifted and scaled version of a selected mother wavelet. Wavelet transform is capable of providing frequency and time domain information simultaneously. Wavelet analyses are suitable for non-stationary signals because of good results in frequency as well as time domain.
Standard deviation, Skewness. All the features have been calculated after decomposing each 11 levels of detail coefficients and approximation coefficients. Totally 96 features have been extracted from each patient signals obtained from recordings.
2. Feature selection
Feature selection method is used for selecting a subset of relevant features from the original set of features. It widely used for dimensionality reduction and data minimization for learning, improving predictive accuracy and for increasing comprehensibility of models. Two main aspect of feature selection are minimum redundancy and maximum relevance. The main objective of feature selection is to identify most informative features (m) out of the original features (d) where m less than d. The proposed method uses mutual information based feature selection method for optimum set of features. The mutual information I(X;Y) is the amount of uncertainty in X due to the knowledge of Y. Mathematically it is defined as:
( ; ) =∑ ∈ ∑ ∈ ( , ) ( ) ( )( , ) (1)
where ( , ) is the joint probability function of X and Y, ( ) and ( )are the marginal probability function for X and Y. We can also express as:
( ; ) = ( )− ( | ) (2)
where ( ) is the marginal entropy, ( | )is the conditional entropy.
3. Classification Approach
The main purpose is to build models with the ability to determine SAHS on the basis of the information contained in the feature set. In the classification phase, we employ two classifiers for detecting SAHS. First classifier is AdaBoost procedure which is a met algorithm which can mainly uses on application like classification problems. Second one is ANFIS which combines the merits of both the neural classifier and the fuzzy classifier for better performances.
i. Classification based on AdaBoost
AdaBoost (adaptive boosting) is a multiple learning algorithm that can be used for classification or regression. AdaBoost is a popular boosting technique which helps to combine multiple weak classifiers into single strong classifiers. AdaBoost is called adaptive because it uses multiple iterations to generate a single composite strong learner. A weak classifier is simply a classifier that is only slightly correlated to the true classifier where as strong classifier is well-correlated to the true classifier.
AdaBoost creates the strong learner by iteratively adding weak learners. For training set selection each weak classifiers should be trained on a random subset of the total training set. AdaBoost assigns a weight to each training example which determines the probability that each example should appear in the training set. Example with highest weight will include more in training set. After training a classifier AdaBoost increases the weight on the misclassified example which will be part of the next classifiers training set and the next classifier trained will perform better on them. So the resulting classifier will has higher accuracy than the weak learner’s classifiers.
The algorithm takes as input a training set (x1,y1),…, (xm , ym) where each x1 belong to some domain space X and
label y1 is some label set Y. In binary class Y= {-1, +1}.AdaBoost calls weak learning algorithm repeatedly in a series of
round t=1, 2,..,T. Initialize Di(t)=1/m for t= 1,2…..,T. The weak learner’s job is to find weak hypothesis ht : X -> {-1,+1}
approximate for the distribution Di. Weak hypothesis is calculated by its error. The output weight
= ∈
The distribution Di is updated using this equation.
( ) = ( ) ( ) (4)
where is a normalization factor. The final hypothesis H is a weighted majority vote of the T weak hypotheses where is the weight assigned to ht.
( ) = (∑ ℎ ( )) (5)
The final output is just linear combination of all the week classifiers and then the final decision of classification is done by looking at the sign of ( ).
ii.Classification based on ANFIS
The Adaptive neuro fuzzy inference system (ANFIS) is a fuzzy Sugeno model put in the framework of adaptive systems to facilitate learning and adaptation. ANFIS model has been used as a classifier for classification of SAHS in this work. ANFIS is a classifier like a neural network that uses fuzzy inference system. ANFIS concatenates fuzzy logic principles and neural networks. ANFIS has a set of fuzzy if-then rules with suitable membership functions to generate the input-output values. ANFIS is a hybrid classifier that uses a learning algorithm to specify parameters of Sugeno-type fuzzy inference systems. It implies both of the least-square method and the back-propagation gradient descent method for training fuzzy inference system membership function parameters.
ANFIS architecture consists of five layers of nodes. Out of the five layers, the first and the fourth layers consist of adaptive nodes while the second, third and fifth layers consist of fixed nodes. The adaptive nodes are associated with their respective parameters, get duly updated with each subsequent iteration while the fixed nodes are devoid of any parameters. To present the ANFIS architecture, two fuzzy if-then rules based on a first order Sugeno model are considered:
Rule 1: If (x is A1) and (y is B1) then (f1 = p1x+ p1y + r1)
Rule 2: If (x is A2) and (y is B2) then (f2 = p2x + q2y + r2)
where x and y are the inputs, Ai and Bi are the fuzzy sets, fi are the outputs within the fuzzy region specified by the fuzzy
rule, pi, qi and ri are the design parameters that are determined during the training process. ANFIS normally has five
layers. They are fuzzification layer, inference process, defuzzification layer, and summation layer.
In the first layer, all the nodes are adaptive nodes. The outputs of layer 1 are the fuzzy membership grade of the inputs, which are given by:
1 = ( )
, For i=1, 2 (6)
1 =
−2( ), For i=3, 4 (7)
where ( ),
−2( ) can adopt any fuzzy membership function. For example, if the bell shaped membership function
is employed, ( ) is given by:
( )= 1
1+ − 2
(8)
where , and are the parameters of the membership function. Parameters are referred to as premise parameters. In the second layer the nodes are fixed nodes. They are labeled with M, indicating that they perform as a simple multiplier. The outputs of this layer can be represented as:
= = ( ) ( ), For i=1, 2 (9) which are the so-called firing strengths of the rules.
In the third layer, the nodes are also fixed nodes. They are labeled with N, indicating that they play a normalization role to the firing strengths from the previous layer. The outputs of this layer can be represented as:
= =
( ) , For i=1, 2 (10)
which are the so-called normalized firing strengths.
In the fourth layer, the nodes are adaptive nodes. The output of each node in this layer is simply the product of the normalized firing strength and a first order polynomial. Thus, the outputs of this layer are given by:
= = ( + + ), For i =1, 2 (11)
In the fifth layer, there is only one single fixed node labeled with S. This node performs the summation of all incoming signals. Hence, the overall output of the model is given by:
=∑ =∑( ) (12)
IV.EXPERIMENTAL RESULT
In order to validate the effectiveness of the proposed algorithm nasal airflow signal from PSG recording from SAHS subjects were used for training and testing of classification model.
1. Feature extraction and selection
In this work, the features are extracted using wavelet decomposition. Purpose of wavelet decomposition is to analysis and understands structures of different time scales of signal. Spectral analysis of the signals was performed using the DWT. Selection of appropriate wavelet and the number of decomposition levels is very important in analysis of signals using the WT. The number of decomposition levels is chosen based on the dominant frequency components of the signal. The levels are chosen such that those parts of the signal that correlate well with the frequencies required for classification of the signal are retained in the wavelet coefficients.
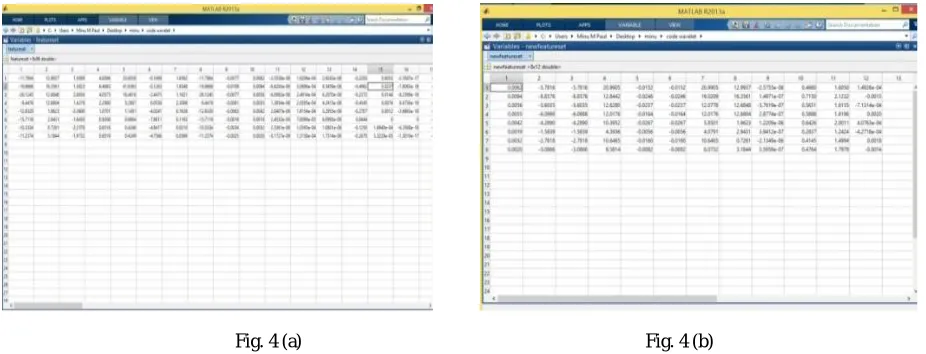
Fig. 4 (a) Fig. 4 (b)
Figure 4: The feature set obtained from each signal recordings (a) features extracted after passing through the each wavelet decomposition level (b) features obtained after mutual information based feature selection stage.
In the present study, the number of decomposition levels was chosen to be 11. Thus, the signals were decomposed into the details D1–D11 and one final approximation A11. The smoothing feature of the Daubechies wavelet of order 2 (db2) made it more suitable to detect changes of the airflow signals. Therefore, the wavelet coefficients were computed using the db2 in the present study. The wavelet coefficients were computed using the MATLAB software package. All the 8 features are obtained from each 12 levels of decomposition, which gives 96 features from each dataset. Totally 768 features are extracted from dataset consisting of 8 recordings shows in Figure 4 (a).
The mutual information based feature selection algorithm was applied to the obtained feature set from wavelet analysis. Hence Figure 4 (b) shows the final optimum set was composed of 12 features which have highly related information for classification from each recording.
2. Classification
Table 1: The comparison result obtained for AdaBoost and ANFIS classifiers
V. CONCLUSION
In this paper, efficient and easy implementation method for detecting SAHS using single channel airflow signal has been proposed. The nasal based respiratory airflow signals extracted from polysomnography recordings have been obtained from PhysioNet apnea-ECG database. Wavelet transform have been applied on the airflow signals for obtaining feature set. The 11 levels are chosen such that those parts of the signal that correlate well with the frequencies required for classification of the signal are retained in the wavelet coefficients. The features obtained after mutual information based feature selection method is used from classification. The 12 features obtained from each 8 recordings have been used for training and testing the AdaBoost and ANFIS algorithm. Training and testing process have been repeated by using the randomly obtained five different sequences of dataset for generalization. The classification accuracy for AdaBoost has 98.43% where as ANFIS is 98.68% with reduced number of features utilized. According to the result, ANFIS based classification has sufficient accuracy for SAHS detection. The result demonstrates that the method has promising detection reliability and can be used as timesaving adjunct to the present polysomnography SAHS diagnostic system. Embedded systems which integrated with proposed method can improve the medical services efficiency for detection. We will also focus as our future work on developing different feature extraction and selection methods which can result in a more robust detection system by using larger dataset.
REFERENCES
[1] C. Guilleminault, F. L. Eldridge, and W. C. Dement, “Insomnia with sleep apnea: a new syndrome,” A Treatise on Electricity and Magnetism, 3rd ed., vol. 2. Oxford: Clarendon, pp.68-73, 1892.
[2] Yashar Maali, “A novel partially connected cooperative parallel PSO-SVM algorithm: Study based on sleep apnea detection”, IEEE Congress on Evolutionary Computation (CEC), pp.1-8, 10-15 June 2012.
[3] V. Mohsenin and R. Valor, "Sleep apnea in patients with hemispheric stroke," Archives of Phys. Med. and Rehab., vol. 76, pp. 71-76, 1995. [4] A. Sassani, et al, “Reducing Motor-Vehicle Collisions, Costs, and Fatalities by Treating Obstructive Sleep Apnea Syndrome,” Sleep, vol. 27,
pp. 453-458, 2003
[5] E. Lindberg et al, “Role of Snoring and Daytime Sleepiness in Occupational Accidents,” Am. J. Respir. Crit. Care Med., vol. 164, pp. 2031-2035, 2001
[6] T. Young et al, “Epidemiology of Obstructive Sleep Apnea: A Population Health Perspective,” Am. J. Respir. Crit. Care. Med., vol.165, pp. 1217-1239, 2002.
[7] F. Lopez-Jiménez et al, “Obstructive Sleep Apnea,” Chest, vol. 133, pp 793-804, 2008.
[8] N.J.Moser, B.A.Phillips, D.T.R.Berry, and L.Harbison, “What is hypopnea, anyway?”Chest, vol.105, no.2, pp.426–428, 1994.
[9] R.B.Berry, R.Brooks, C.Gamaldoetal, “The AASM Manual for the Scoring of Sleep and Associated Events: Rules, Terminology and Technical Specifications”, Version2.0, American Academy of Sleep Medicine, Darien, USA, 2012.
[10] D.J.Pitson and J.R.Stradling, “Autonomic markers of arousal during sleep in patients undergoing investigation for obstructive sleep apnea, their relationship to EEG arousals, respiratory events and subjective sleepiness,” Journal of Sleep Research, vol. 7, no.1, pp.53–59,1998. [11] R.J.Thomas, “Arousals in sleep-disordered breathing patterns and implications, ”Sleep,vol.26,no.8,pp.1042–1047,2003
[12] S. P. Patil, et al, “Adult Obstructive Apnea,” Chest, vol. 132, pp. 325-337, 2007.
[13] J. A. Bennet and W. J. M. Kinnear WJM, “Sleep on the cheap: the role of overnight oximetry in the diagnosis of sleep apnoea hypopnoea syndrome,” Thorax vol. 54, pp. 958-959, 1999.
[14] W. W. Flemons et al, “Home Diagnosis of Sleep Apnea: A Systematic Review of the Literature,” Chest, vol. 124, pp. 1543-1579, 2003 [15] R. B. Berry et al, “Rules for scoring respiratory events in sleep: update of the 2007 AASM manual for the scoring of sleep and associated
events,” J. Clin. Sleep Med., vol. 8(5), pp. 597-619, 2012.
Classifier Accuracy (%) F-Measure Kappa
AdaBoost 98.43 0.979 0.970
[16] F. R. de Almeida et al, “Nasal pressure recordings to detect obstructive sleep apnea,” Sleep Breath, vol. 10, pp. 62-69, 2006. [17] U. J. Magalang et al, “Prediction of the apnea-hypopnea index from overnight pulse oximetry,” Chest, vol. 124, pp. 1694-1701, 2003. [18] T. Penzel et al, “Systematic Comparison of Different Algorithms for Apnoea Detection Based on Electrocardiogram Recordings,” Med.
Biol.Eng. Comput., vol. 40, pp. 402-407, 2002.
[19] C. A. Nigro et al, “Comparison of the automatic analysis versus the manual scoring from ApneaLink™ device for the diagnosis of obstructive sleep apnoea syndrome,” Sleep Breath, vol. 15, pp. 679-686, 2011.
[20] D. Álvarez et al, “Multivariate analysis of blood oxygen saturation recordings in obstructive sleep apnea diagnosis,” IEEE Trans. Biomed.Eng., vol. 57, no. 12, pp. 2816–2824, 2010.
[21] J. V. Marcos et al, “Automated detection of obstructive sleep apnea syndrome from oxygen saturation recordings using linear discriminant analysis,” Med. Eng. Phys., vol. 59, pp. 141-49, 2010.
[22] G. C. Gutiérrez-Tobal et al., “Pattern recognition in airflow recordings to assist in the sleep apnoea–hypopnoea syndrome diagnosis,” Med.
Biol.Eng. Comput., vol. 51, pp. 1367-80, 2013.
[23] G. C. Gutiérrez-Tobal et al, “Linear and nonlinear analysis of airflow recordings to help in sleep apnoea-hypopnoea syndrome diagnosis,”
Physiol. Meas., vol. 33, pp. 1261-75, 2012.
[24] C. Gómez et al, “Complexity analysis of the magnetoencephalogram background activity in Alzheimer's disease patients,” Med. Eng. Phys., vol. 28, pp. 851-59, 2006
[25] L. Yu and H. Liu, “Efficient feature selection via analysis of relevance and redundancy,” J. Mach. Learn. Res., vol. 5, pp. 1205-1224, 2004. [26] I. H. Witten, E. Frank and M. A. Hall, “Data Mining: Practical Machine Learning Tools and Techniques”. Burlington, MA: Morgan
Kaufmann/Elsevier, 2011.
[27] A. L. Goldberger, L. A. N. Amaral, L. Glass, J. M. Hausdorff, P. Ch. Ivanov, R. G. Mark, J. E. Mietus, G. B. Moody, C.-K. Peng and H. E. Stanley, “PhysioBank, PhysioToolkit, and PhysioNet: Components of a New Research Resource for Complex Physiologic Signals,” Circulation, Vol. 101, No. 23, pp. e215-e220, 2000.
[28] Y. Chan, “Wavelet Basics,” Kluwer Academic Publishers, 1995.
[29] F. W. David, “An Introduction to Wavelet Analysis”, Birkhause, Basel, 2002.
[30] Gonzalo C. Gutiérrez-Tobal, Daniel Álvarez, Félix del Campo, and Roberto Hornero, “Utility of AdaBoost to Detect Sleep Apnea-Hypopnea Syndrome from Single-ChannelAirflow”, IEEE Transaction on Biomedical Engineering, 2015.
[31] Y. Freund, and R. E. Schapire, “A decision-theoretic generalization of on-line learning and an application to boosting”, J. Comput. System Sci., vol. 55(1), pp. 119-139, 1997.