The Selective Values of Alleles in a Molecular Network Model Are
Context Dependent
Jean Peccoud,
1Kent Vander Velden, Dean Podlich, Chris Winkler, Lane Arthur
and Mark Cooper
Pioneer Hi-Bred International, Johnston, Iowa 50131-0552 Manuscript received July 11, 2003
Accepted for publication January 6, 2004
ABSTRACT
Classical quantitative genetics has applied linear modeling to the problem of mapping genotypic to phenotypic variation. Much of this theory was developed prior to the availability of molecular biology. The current understanding of the mechanisms of gene expression indicates the importance of nonlinear effects resulting from gene interactions. We provide a bridge between genetics and gene network theories by relating key concepts from quantitative genetics to the parameters, variables, and performance functions of genetic networks. We illustrate this methodology by simulating the genetic switch controlling galactose metabolism in yeast and its response to selection for a population of individuals. Results indicate that genes have heterogeneous contributions to phenotypes and that additive and nonadditive effects are context dependent. Early cycles of selection suggest strong additive effects attributed to some genes. Later cycles suggest the presence of strong context-dependent nonadditive effects that are conditional on the outcomes of earlier selection cycles. A single favorable allele cannot be consistently identified for most loci. These results highlight the complications that can arise with the presence of nonlinear effects associated with genes acting in networks when selection is conducted on a population of individuals segregating for the genes contributing to the network.
R
ECENTLY there has been interest in interpreting analyze the epistatic interactions between the genes con-the quantitative genetic properties of gene net- trolling this pathway and their impact on the selection works at the population level (Frank1999;Omholtet process.al.2000). This is warranted on at least three grounds: Fundamental to genetics is the relationship between (i) much of the molecular genetic evidence points to the genotype of an individual, the environment where the roles of genes in nonlinear networks in the determi- it lives, and its resulting phenotype. This relationship is nation of gene-to-phenotype relationships, (ii) we have often referred to as genotype-to-phenotype (GP) map-a growing body of dmap-atmap-a on the structurmap-al map-and functionmap-al ping. Since the true mechanisms of gene expression properties of the genomes of organisms and as this pool have historically been poorly understood, geneticists of data continues to expand it is becoming more feasible have derived such mappings from the joint distributions to construct models of gene networks, and (iii) for many of genotypic and phenotypic data. The simplest map-aspects of basic and applied genetics it is necessary to ping, Mendelian genetics, considers traits that are deter-study the properties of allelic variation for genes at the mined completely by individual genes. Many traits, how-level of phenotypic effects and variation within popula- ever, are more complex than that; they are quantitative tions. Bridging the molecular and population-level views in nature and are influenced by contributions from of gene-to-phenotype relationships is a challenging area alleles at multiple loci. These multiple-gene cases have of research for quantitative genetics. At present there been studied using linear statistical models that allow is no agreed-upon quantitative framework but a number both additive and nonadditive (dominance and epista-of approaches are being investigated. We constructed
sis) effects (Falconer and Mackay 1996). Complex a model of the gene network controlling the galactose
traits are also often dependent on the environment in metabolism pathway in yeast, using differential
equa-which a genotype is expressed. In addition to the direct tions. This model has been used as a
genotype-to-pheno-effect of the environment, genotype-by-environment type map with which to evaluate the performance of
(G ⫻ E) interactions can have important effects on individuals in simulations of a mass selection process.
complex traits. Traditionally, genotype-to-phenotype Combining these two approaches makes it possible to
mappings have predominantly been linear combina-tions of terms representing dominance, epistasis,G⫻ Einteractions, and genotype-by-genotype (G ⫻ G) in-1Corresponding author:Pioneer Hi-Bred International,
Bioinformat-teractions (CooperandPodlich2002). ics & Discovery Research, P.O. Box 552, 7250 NW 62nd Ave., Johnston,
IA 50131-0552. E-mail: [email protected] Even though these linear statistical relationships
by which the induced state of the GAL system leads to a lowed geneticists to represent the phenotypic variability
modification of the environmental conditions that lead to this of a large number of simple traits, working beyond the
induction. In an effort to capture this behavior, we introduced limitations of linear mappings is one of the main chal- in the model GalExt and GluExt, which can be regarded as lenges faced by geneticists today. Interactions between external pools of molecules not affected by the dynamics of intracellular reactions. Passive diffusion or active transport of genes contribute to complex phenotypes in plants (Eshed
these molecules into the cell can be represented by chemical andZamir1996;Liet al.1997, 2001;Luoet al.2001),
equations transforming these molecules into their intracellu-mice (Leamyet al.2002), and microorganisms (Elena
lar counterparts, Gal and Glu, respectively (Table 1, reactions andLenski2001;Steinmetzet al.2002). Genetic factors R01, R02, and R05). Gal and Glu can be regarded as the that contribute to many pathologies do not have any variables indicative of the intracellular environment. The val-ues of the two control variables GalExt and GluExt indicate the direct effect on the phenotypes that are essentially
deter-presence of sugars in the environment. Absence and deter-presence mined byG⫻EandG⫻Ginteractions (Perera1997;
were indicated by 0 and 10, respectively. The combination of Weatherall2001). These observations are interpreted
GalExt and GluExt values defines an environment.
as nonlinear effects of gene interactions and are usually Dynamics:The time evolution of the model is represented referred to collectively as epistatic effects (Rutherford by mass-action differential equations. The set of coupled dif-ferential equations can automatically be derived from the 2000).
chemical equations of Table 1 (ErdiandToth1989). Specifi-De Jong has recently reviewed various families of
mod-cally, the matrices of stoichiometric coefficients for the re-els that have been used to represent genetic networks
actants␣i,rand productsi,rof the reactions can be used to (De Jong2002). Considering the small copy number of represent the generic form of a chemical equation:
the molecules involved in gene expression mechanisms,
Markovian models (Peccoud and Ycart 1995; Goss Rr⫽
兺
Mi⫽1 ␣i,rXi→
kr
兺
Mi⫽1
i,rXi. (1)
and Peccoud 1998) based on a stochastic version of
the mass action law are an appealing representation of The ratevrof each reaction depends on the concentration of its reactants:
gene network dynamics. However, the cost of comput-ing Monte Carlo simulations limits their use to only
vr⫽kr
兿
M
i⫽1
[Xi]␣i,r. (2)
those pathways having a well-documented stochastic out-come at the cellular level (Arkinet al.1998;McAdams
The time evolution of a molecule concentration is ruled by andArkin1999). Approximating the network dynamics the balance between the rates of the reactions producing this by a system of differential equations provides a useful molecule and the ones using it as a reactant:
compromise between a realistic representation, speed
of simulation, and a wealth of theoretical properties d[Xi]
dt ⫽
兺
ri,rvr⫺
兺
r␣i,rvr. (3)
and analysis techniques that can complement numerical
simulations. The complete set of differential equations is given in the
appendixin MATLAB format.
Genotypes, phenotypes, and traits:To analyze the response of a gene network to selective pressure, it is necessary to estab-MATERIALS AND METHODS
lish a correspondence between the basic properties of genetics at a population level and the characteristics of genetic
net-Modeling the galactose genetic switch:The galactose
path-way is an attractive system for dynamic modeling since it inte- works. Our analysis relies on the following:
Segregating loci as model parameters:The reaction rates are grates a gene network, a metabolic pathway, and a response
to environmental perturbations. In a first approximation, it genetically determined. It is well established that directed mutations of promoters or protein domains can affect the rates is possible to associate the phenotype to the activity of the
metabolic pathway and the genotype to the genes in this path- of protein-DNA interactions, protein-protein interactions, and gene expression or even affect the catalytic properties of an way. Our model of the galactose pathway (GAL) system (Figure
1 and Table 1) is a simplistic representation of the complex enzyme. Hence, each parameter is determined by a number of segregating loci. The precise mapping of the genetic space mechanisms of gene expression. It is representative of the
common understanding of the molecular mechanisms respon- onto the parameter space depends on the number of genes involved (N) and the extent of genetic polymorphism. In the sible for the response of yeast to the presence of galactose
and glucose in its environment. case of a bimolecular reaction like R09 (Table 1, Figure 1), the rate of the binding of the Gal4p protein on the GAL Biology:To date, the effect of the environment has often
been ignored in models of gene networks. Alternatively, it promoter can be determined by the sequence coding for Gal4p and by the regulatory sequence of GAL. Potentially, is possible to consider the environment as a set of external
parameters, where simulation runs with various parameter two loci could determine the rate of this reaction but if only one of them is polymorphic, it is not necessary to consider in values can be compared to evaluate the impact of the
environ-ment on the model dynamics (Venkateshet al.1999). For the model the locus corresponding to the conserved sequence. In the context of this article, a single locus was associated with many situations it seems that this approach is able to capture
the biological logic of the network. In the case of the galactose each parameter (i.e.,N⫽27).
Alleles as discrete parameter values:The association between pathway of yeast, the environment can change the state of the
genetic switch by inducing or repressing the expression of the loci and parameters makes it natural to associate allelic poly-morphism with variation of specific parameter values. Each GAL genes. However, the relationship between the network
and its environment is not one-way. The induction of the GAL polymorphic locus is assumed to have two alleles in this article (larger numbers can be considered). A null allele translates genes by galactose results in the transformation of galactose
Figure1.—Diagram of the galactose switch. Recent overviews of the GAL switch have been provided byIdekeret al. (2001) andOstergaard et al.(2000). GalExt and GluExt are the two environmental variables of the system. Galactose is transported into the cell primarily by Gal2p, using an ATP-dependent mechanism. It is necessary to take into consideration a small passive diffusion of galactose into the cell to trigger the induction of the GAL genes by galactose. Although there are a number of well-characterized metabolites between galactose and glucose 6-phosphate, we represent the whole pathway by a single step catalyzed by a hypothetical enzyme labeled E. Since the glucose-6-phosphatase catalyzing the transformation of Glu-6P into glucose is not part of the GAL network, it was omitted from the model. The gene coding for Gal4p, gal4g, can be in a repressed form, gal4gX, when complexed by Mig1 in the presence of glucose (Ronne1995;OstlingandRonne1998). For simplicity we considered a single enzyme in the pathway coded by a single gene noted GAL. The expression of GAL is induced by Gal4p. When in the induced state GAL-4, it expresses the E enzyme along with the Gal3p and Gal80p transcription factors. Gal80p represses this expression by binding to the GAL-4 complex. Gal3p is the galactose sensor of the GAL system. Galactose binds Gal3p through an ATP-dependent mechanism. The resulting complex Gal3p* binds to the GAL-4-80 complex and induces the expression of the GAL genes (YanoandFukasawa1997).
having a less dramatic effect result in parameters having an of the transition to flowering. The genetic analysis of this trait x-fold higher or smaller value than the wild type. The within- relies primarily on this single observation of individuals in a locus parameter values are assumed to be additive so that the population. Traits are a means to score the various characteris-heterozygous genotype is given the average parameter value tics of genotypes. In the case of the GAL system, the most of the homozygous genotypes for the two alleles. Different obvious trait is the capability to process galactose when it is levels of dominance at the individual parameter level can be the only source of carbon available. How does this translate allowed but are not considered here. In the context of this in the context of our model of the galactose switch? There article, we do not consider the possibility of introducing muta- are several possible interpretations of this trait. The variable tions. The genetic space is thus finite and discrete. Its 3N
representing the enzymes or the variables representing metab-genotypes are the 3Nparameter combinations resulting from
olites can be used as indicators. In this case we elected to use the selection of one of the three possible parameter values Glu-6P as an indicator of the state of the galactose pathway. (columns) in each of the 27 lines of Table 1. To quantify the trait, we assigned target values for Glu-6P in Phenotypes as vectors of traits:Traditionally the phenotype of the three environments (we ignore the trivial case where no an individual is defined by the value of the biometric data sugar is present Gal⫺Glu⫺). Arbitrarily, we decided that Glu-that can be measured at some point in time (e.g., grain yield 6P should be 0 in the two environments where the pathway of crops, the number of bristles on a segment of Drosophila should not work (Gal⫺ Glu⫹, Gal⫹ Glu⫹) and 2 in Gal⫹ spp.). These biometric data rarely translate directly into mo- Glu⫺. The system of differential equations was integrated lecular variables but they are indicative of the performance betweent⫽0 andt⫽104where it is assumed to reach steady of the individual. To relate a model to experimental observa- state. By notingX
⫺⫹(104), the value of Glu-6P at time 104in tions, it is necessary to derive trait values from the model itself. the Glu⫹Gal⫺environment, this first trait is
Traits as functions of a model:The biometric data collected to score a trait are static, time-independent observations. Even T
1(k1, . . . ,k27) though life is a dynamic process that develops in time,
pheno-types are observed in standard conditions that remove time ⫽√(X⫹⫺(104)⫺2)2⫹(X⫹⫹(104)⫺0)2⫹(X⫺⫹(104)⫺0)2. from the observation. Even traits tightly associated with the (4) timing of development are considered static in genetics. The
A second trait was also defined for this model. Comparable transition from vegetative growth to reproduction or flowering
levels of external galactose and glucose are expected to lead time provides a good illustration of this point. The whole
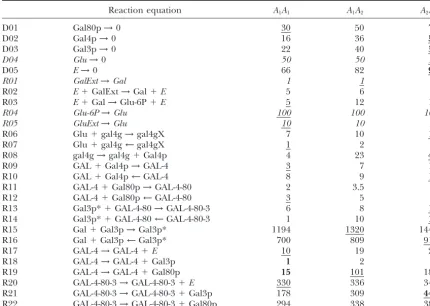
TABLE 1
Chemical equations and parameters
Reaction equation A1A1 A1A2 A2A2
D01 Gal80p→0 30 50 70
D02 Gal4p→0 16 36 56
D03 Gal3p→0 22 40 58
D04 Glu→0 50 50 50
D05 E→0 66 82 98
R01 GalExt→Gal 1 1 1
R02 E⫹GalExt→Gal⫹E 5 6 7
R03 E⫹Gal→Glu-6P⫹E 5 12 19
R04 Glu-6P→Glu 100 100 100
R05 GluExt→Glu 10 10 10
R06 Glu⫹gal4g→gal4gX 7 10 13
R07 Glu⫹gal4g←gal4gX 1 2 3
R08 gal4g→gal4g⫹Gal4p 4 23 42
R09 GAL⫹Gal4p→GAL-4 3 7 11
R10 GAL⫹Gal4p←GAL-4 8 9 10
R11 GAL-4⫹Gal80p→GAL-4-80 2 3.5 5
R12 GAL-4⫹Gal80p←GAL-4-80 3 5 7
R13 Gal3p*⫹GAL-4-80→GAL-4-80-3 6 8 10
R14 Gal3p*⫹GAL-4-80←GAL-4-80-3 1 10 19
R15 Gal⫹Gal3p→Gal3p* 1194 1320 1446
R16 Gal⫹Gal3p←Gal3p* 700 809 918
R17 GAL-4→GAL-4⫹E 10 19 28
R18 GAL-4→GAL-4⫹Gal3p 1 2 3
R19 GAL-4→GAL-4⫹Gal80p 15 101 187
R20 GAL-4-80-3→GAL-4-80-3⫹E 330 336 342
R21 GAL-4-80-3→GAL-4-80-3⫹Gal3p 178 309 440
R22 GAL-4-80-3→GAL-4-80-3⫹Gal80p 294 338 382
Reactions are labeled in the first column. The chemical equation of the reaction is given in column 2. Each parameter has two allelic valuesA1andA2. The columnsA1A1,A1A2, andA2A2indicate the parameter values used when genotypes are homozygous (A1A1andA2A2) or heterozygous (A1A2). Parameters that are underlined indicate the genotype of the individual with the highest performance that was generated at the 35th generation of the 34th run. Parameters in boldface type correspond to the favorable alleles that were consistently fixed in⬎95% of the 1000 runs. Lines (reactions) in italics are nonsegregating in experiment 1 and experiment 2 because they correspond to interactions outside of the GAL system. Parameter values in boldface type were made nonsegregating in experiment 2.
the value of Glu at time 104in the Gal⫺Glu⫹environment, oped a simple genetic algorithm application that was inter-this second trait is faced with a gene network simulator utilizing CVODE (Cohen
andHindmarsh1996). For this article we have limited
our-T2(k1, . . . ,k27) selves to a mass selection strategy where the phenotype of an individual is the only criterion used to evaluate the
perfor-⫽√(Y⫹⫺(104)⫺2)2⫹(Y⫹⫹(104)⫺2)2⫹(Y⫺⫹(104)⫺2)2.
mance of a genotype. (5)
The initial population (500 individuals) contained equal A trait value can be computed for each of the genotypes of numbers of each allele at all segregating loci in the galactose the genetic spaces considered in this article. So, for instance, pathway model. A constant selection pressure of 20% was T1(30, 36, 22, 50, 66, 1, 7, 5, 100, 10, 7, 1, 4, 3, 8, 2, 3, 6, 1, applied to all cycles of selection across all simulations. We 1194, 700, 10, 1, 15, 330, 178, 294) is the trait value of the simulated a case where there was sustained directional selec-genotype where all loci areA1A1except D02 (A1A2) and R02 tion for smaller values of the performance function over 100 (A2A2). cycles of selection. One thousand replicates of the simulation
Performance as a function of traits:A numerical performance were conducted. function is computed for selection purpose. This summarizes
results from a number of elementary traits that determine how well an individual performs in a given environment. There
RESULTS are multiple ways of combining several trait values in a
perfor-mance function. In the context of this work, we considered
Model: The model of the molecular network
de-⌽(k1, . . . ,k27)⫽T1(k1, . . . ,k27)T2(k1, . . . ,k27). (6) scribed in this article has two specific features not com-monly found in the literature on gene networks: (1)
Simulation of selection: To simulate effects of selection
in-TABLE 2 in Gal⫺Glu⫹and Gal⫹Glu⫹conditions but we cannot get close to the target value of 2 in the Gal⫹ Glu⫺
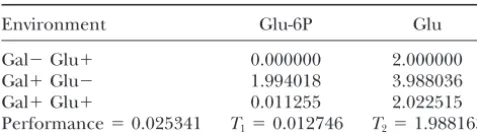
Performance computation
condition. When the best individual is compared to the best individuals typically found in the last cycle of
Environment Glu-6P Glu
selection, it turns out that their behavior is very compa-Gal⫺Glu⫹ 0.000000 2.000000
rable. Minimal changes in Glu-6P values result in a sig-Gal⫹Glu⫺ 1.994018 3.988036
nificant difference in theT1value, which propagates to Gal⫹Glu⫹ 0.011255 2.022515
the performance value. Even more interesting is the Performance⫽0.025341 T1⫽0.012746 T2⫽1.988163
examination of the time evolution of Glu-6P and Glu To illustrate how performance is computed, the
perfor-when the molecular network is integrated. Asymptotic mance of the best-performing individual generated across the
values are quickly reached in Gal⫺ Glu⫹ and Gal⫹ entire simulation is computed. This individual was found in
Glu⫺ but the system oscillates when placed in Gal⫹ the 35th generation of the 34th run of the simulation.
Simula-tions were run in the three different environments containing Glu⫹conditions. The amplitudes of the oscillations are sugars and the values of Glu-6P and Glu att⫽104are reported.
significant (0.5 for Glu and 0.3 for Glu-6P) but the The two traits can be derived from these data by using
Equa-values are close to the target Equa-values at t ⫽ 104. This tions 4 and 5. The performance score is the product of the
shows how dependent the outcome of the selection two trait values.
process is on the trait and performance functions. Simulations: Running such an experiment is a sig-teraction of the model with the environment, and (2) nificant computational challenge. There are very sig-trait and performance functions are defined to evaluate nificant differences of simulation time between runs the performance of a model parameterization. since some simulations can be achieved in 1.7 hr while Control variables: For the sake of reproducibility, the others would take up to 4.4 hr on a processor running simulations described in this article do not take full at 2.8 MHz. Most of the time is spent evaluating the advantage of the possible time evolution of control vari- performance of 50,000 individuals generated during ables. Instead of assigning a constant value to environ- 100 populations of 500 individuals. Since the model mental factors such as the sugar concentrations, it is needs to be simulated in three different environmental possible to specify the variation of these concentrations conditions, the differential equations are integrated in time. This feature makes it possible to evaluate other
150,000 times in each run. To speed up the genetic traits of the model. For instance, it is possible to quantify
algorithm, previously evaluated phenotypes are re-the ability of re-the network to react to changes of re-the
corded in a cache. Some simulations are more likely environment. The trait functions described in this work
than others to explore larger regions of the genetic do not distinguish the networks that will quickly adapt
space. Even though the total number of individuals eval-to new conditions from the ones that will need more
uated is the same for all simulations, some will evaluate time to turn the galactose switch on and off. In models
more genotypes than others, which explains the differ-of other regulatory networks, control variables have also
ences of simulation time. To complete the 1000 runs been used to represent the effect of physical parameters
in an acceptable time (ⵑ15 hr), the simulations were of the environment such as temperature, volume, or
distributed over the 56 nodes of a Linux cluster, each light.
node having two processors. The selection process simu-Performance function:To assess the way individuals are
lated in this experiment is extremely basic. Its imple-scored by the performance value, we looked for the
mentation did not require much programming. To ana-individual with the lowest performance value that was
lyze the response of regulatory networks to actual generated across the entire experiment. This individual
breeding programs, we also interfaced the molecular was found at the 35th cycle of run 34. It is interesting
network simulation environment with QU-GENE, an that this individual was not found in the population
environment for simulating breeding strategies (Pod-generated at the end of the selection process (cycle
lichandCooper1998;Micallefet al.2001). 100). The performance value of the best individual is
Response to selection:There are two ways to analyze
ⵑ0.025 (see Table 2). The values achieved at the end
the network response to selection. The time evolution of the selection process are typically close to 0.20. This
of performance is indicative of the effect of selection eightfold difference tends to indicate that a dramatic
while the time evolution of allele frequencies tells us loss of performance occurred during the selection
pro-how this effect is achieved. Two experiments (series of cess. That is when it becomes necessary to examine how
1000 simulations with identical parameters and initial these performance values are achieved,i.e., the property
conditions) were conducted. In experiment 1, the only of the trait and performance functions used in the
simu-nonsegregating loci were those corresponding to inter-lation. The values in Table 2 show that the target values
actions that are often considered “outside” the galactose for Glu-6P are reached in the three environmental
con-switch. In a second experiment, experiment 2, we also ditions andT1 can reach a very low value. This is not
Figure2.—Time evolution of the population average performance distribution. Data were recorded during experiment 1 and experiment 2, each consisting of 1000 simulations. Histograms of the inverse of the population average performance values were computed for each of the 100 cycles of selection. The frequency of each performance category was color coded. Results from experiment 1 (left) show that the distribution is clearly nonnormal since it exhibits at least eight modes. Beyond cycle 80, the selection process has reached its asymptotic distribution. The distribution observed in experiment 2 (center) is fairly similar to results of experiment 1. The main difference is the weight of the bottom mode (blue peak), indicating that a large fraction of the simulations never achieved good performance values. To better compare these two distributions, the time evolutions of their mean values were plotted on the third graph (right). It shows that better performance is achieved in experiment 2 (green line) for the early phases of the selection process. However, the long-term response to selection in experiment 2 is not as good as that in experiment 1.
effect in the results of experiment 1 (see Table 1 for selection process are large enough to move the popula-tion from one peak to the next.
details).
The response to selection of this genetic system can Allele frequencies exhibit a fairly complex behavior at most loci (Figure 3, top). Fixation of one of the two be illustrated by graphing the evolution over cycles of
selection of the mean performance value of the popula- alleles in⬎95% of the runs is observed for seven loci (D02, D05, R08, R14, R18, R19, and R21). In the other tion. However, in the case of this experiment this graph
did not appear to be the most appropriate. The best cases the final allele frequencies are variable and are distributed between 0 and 1 with peaks at 0, 50, and performers in our experiment have the lowest
perfor-mance value. As a result the selection results in a reduc- 100%. Thus, either one of the homozygotes or the het-erozygote could be favored depending on the replicate. tion of performance values over time. The other
prob-lem is that the performance function has an absolute So for most loci it is not possible to clearly identify a consistently favorable allele; the favorable allele is highly lower bound. So the plot of the mean performance
values over cycles of selection is difficult to read since context dependent. Also, since a small percentage of the runs lead to retaining the heterozygous state, both all the runs tend to accumulate toward 0. To overcome
these difficulties, the statistical distribution of the in- alleles could be retained. Also included in Figure 3 is the time evolution of the four parameters that are not verse of the mean performance value was plotted
(Fig-ure 2). polymorphic. They are the only ones exhibiting a ran-dom drift behavior. These loci can thus be considered Experiment 1:The statistical distribution of mean
per-formance values is initially unimodal (Figure 2, left). as negative controls. All the polymorphic loci have some selective value in this experiment since none of them Beyond cycle 50 or so up to eight modes can be
identi-fied. Interestingly, there is a mode corresponding to drift as the nonpolymorphic ones do.
Experiment 2:In experiment 2, the seven loci that had poor levels of performance. There are also two major
modes corresponding to good performance and a few a favorable allele in experiment 1 were fixed and thus made nonpolymorphic (see Table 1). By fixing the fa-minor modes of intermediate values. Beyond cycle 50,
the selection process appears to have reached its asymp- vorable allele in the parameter file, it was anticipated that the transient phase of the selection process would totic distribution. However, the observation of
individ-ual trajectories indicates that despite a constant selec- be shortened. It turns out that the initial mean perfor-mance values are actually better (Figure 2, center), as tion pressure, the populations can move from one mode
to the other, resulting in quick gains or losses of perfor- anticipated. However, the asymptotic distributions are significantly different. The heavily loaded mode at the mance even in the stationary regime. This pattern
mechanisms to capture their dynamics into mathemati-cal models. There are some indications in the recent literature that we now have models with some predictive power of the phenotype (ElowitzandLeibler 2000; Hastyet al. 2002;Houchmandzadehet al. 2002;Kaern et al. 2003). Analyzing the genetic properties of regula-tory networks raises a number of theoretical and techni-cal problems, which explains the limited numbers of articles dealing with this problem.
Nonlinear GP maps:Introduction of nonlinear terms in genotype-to-phenotype mappings leads to considerable theoretical difficulties that prevent any closed-form ex-pression of the model properties. As suggested by Kemp-thorne (1988), the development of software to simu-late genotype-environment systems (e.g., plant breeding
Figure3.—Evolution of allele frequencies under selection. programs) has enabled geneticists to explore the ge-During the Monte Carlo simulations corresponding to Figure
netic consequences of nonlinear mappings in silico
2, the frequencies of allele A1 at each of the 27 loci were
(PodlichandCooper1998;Micallefet al.2001) with-recorded. Histograms of these frequencies were color coded
as in Figure 2. To illustrate the effect of the selection process out the need for an analytic result. TheE(NK) frame-on the genetic make-up of the populatiframe-on, five histograms work provides a foundation for anin silicoapproach to corresponding to the selection cycles 5, 25, 45, 65, and 85 are
genetic analysis of the properties of linear and nonlinear displayed. In experiment 1 (D02, D05, R08, R14, R18, R19,
gene-to-phenotype mappings at the individual and pop-and R21) one of the two alleles is consistently fixed in⬎95%
of the simulations. For most loci, however, no allele is fixed. ulation levels (CooperandPodlich2002). It is speci-Frequency distribution is multimodal with peaks at 0, 100, fied as a generalization of Kauffman’sNKgene network and often 50%. Nonpolymorphic loci (D04, R01, R04, and model (Kauffman 1993), where a set of N genes is R05) exhibit a pattern indicative of genetic drift. Indirectly,
assumed to be under the control of, on average,Kother they indicate that all other loci have some selective value.
genes in the network. TheE(NK) framework incorpo-Plots at cycles 65 and 85 are very similar, indicating that the
asymptotic distribution of the process has been reached. Re- ratesG ⫻ E interactions through allowing a series of sults of experiment 2 are generally similar (not shown). NKgenotype-to-phenotype relationships corresponding
to different environment types for a given target popula-tion of environment types. Here the target populapopula-tion of performance. This is confirmed by comparing the time
environments is defined as a mixture model of different evolution of the mean of these two distributions (Figure
environment types. Within this generic modeling frame-2, left). The mean for experiment 2 (green line) is
work various types of genotype-to-phenotype mappings initially higher than the mean of experiment 1 (blue
can be implemented (PodlichandCooper1999;Cooper line). Since, initially, the performance response is slow,
et al.2002). So far we have examined a wide range of this results in almost a 10-cycle advantage provided by
artificial gene networks, results from molecular map-the fixation of favorable alleles. However, map-there is a
based genetic mapping of traits, and a combination of long-time cost to this more limited genetic variability
genetic analysis and crop growth models (Cooper et since the long-term response of experiment 2 is not as
al.2002). In this article, we describe a way to build a good as that in experiment 1. The response of allele
genotype-to-phenotype map within the E(NK) frame-frequencies to selection is very similar in experiment 1
work that relies on our understanding of the molecular and experiment 2 even though some minor quantitative
mechanisms of gene expression. difference can be observed.
It is interesting to relate the results presented in this Future work will relate the peaks of the performance
article to previous work based on theE(NK) framework. distribution (Figure 3) with the distributions of the
al-In a broad perspective, molecular networks can be con-lele frequencies. It appears that the context-dependent
sidered asE(NK) models. In the context of this article combinations of alleles emphasized by the results of the
we have N ⫽ 27 loci and E ⫽ 3 environments. Even different replicates of the selection process correspond
though the loci in our model interact, quantifying the to different peaks of performance on a moderately
rug-level of connections between genes,K, proves difficult. ged landscape (data not shown).
In molecular networks, interactions between genes of-ten involved more than one reaction. Hence there is DISCUSSION no straightforward way of computing
K. This limitation does not really matter since it is often used as a summary Molecular networks as GP maps:GP maps have
tradi-statistic in experiments based on an ensemble approach tionally been based on statistical models. In some cases
analyze is not random, the actual topology of the net- point rather than on calculating a trend, the selection process led to parameterization consistent with our spec-work is more meaningful than the parameterK.
Computational challenges: Simulating the evolution of ification of the selection target but more complex than we anticipated. Similarly, we illustrate that finding the a population of network models requires solving the
model with a large number of different parameteriza- right expression to combine several traits into a single performance index is challenging. Again, the examina-tions (size of the population⫻number of generations).
To estimate the fluctuations of the selection process, it tion of the outcome of the selection showed that the performance function we used in this experiment is not is necessary to repeat the simulation of the network
evolution a large number of times. Since dynamic mod- optimal. The choice of trait and performance functions is partly subjective since there is no one single way to els are orders of magnitude more expensive to simulate
than a static model of a GP map, running an experiment quantify the properties that will be maximized by the selection process. By comparing the outcomes of simu-such as the one described in this article is a significant
technical challenge. lated selection using different performance functions, it might be possible to evaluate their relevance in the Multiscale models: A major challenge in using
regula-tory gene networks or metabolic pathways as genotype- computer before using them in actual breeding pro-grams.
to-phenotype mappings is that gene networks are
dy-namical systems and consequently their properties are Genetics of molecular networks: Even though the model of the galactose switch considered in this article defined by reference to their time evolution. In contrast,
the common genetics view is a more static vision of the has not been validated by any experimental data, the results are probably representative of the results we relationship between the genotype of an individual and
its phenotype. Time is included to describe the evolu- would get from a model derived from molecular data. It will be necessary to apply the same approach to a tion of populations of individuals across generations.
Analysis of the genetics of gene networks requires intro- number of molecular network models to better under-stand how the model topology and regulation translate ducing a different timescale. By introducing a
corre-spondence between genetic loci and the parameter into genetic properties.
Performance landscape:The multiple modes of the as-space of a gene network on the one hand and by
defin-ing trait functions to quantify the performance of a ymptotic distribution of the average performance values demonstrate that the outcome of the selection process model parameterization on the other hand, we
recon-cile a theoretical framework that assumes a static rela- is highly uncertain from a common starting point. In the context of plant breeding programs where there is tionship between phenotype and genotype with
dynami-cal models of gene expression. only a single realization of the selection process, this observation raises a number of issues for risk manage-An important step of this approach is to reduce the
time evolution of the gene network into a set of static ment and breeding program design. From an evolution-ary perspective, it is striking that given a deterministic gene-to-phenotype relationships. So far, the
perfor-mance of gene networks has been reduced to the asymp- genotype-to-phenotype mapping and a stable environ-ment, the selection process can have a large diversity totic level of expression of one or a few genes in one
particular set of simulation conditions (Frank 1999; of outcomes. It would be interesting to investigate the properties of the performance landscape in vivo. This Omholtet al.2000). In this article we have formalized
and generalized the notion of trait and performance would require conducting a large number of selection experiments in parallel, starting from identical condi-functions applied to models of molecular interactions.
Instead of focusing on the level of expression of specific tions. Conducting such an experiment requires having first derived from a molecular network model a GP map genes, the traits considered in this article are derived
from metabolite concentrations. These indicators inte- explaining a large number of observed genotype-to-phe-notype relationships. Such a map should also have some grate the effect of all genes in the system along with
the effects of environmental parameters. This approach prediction power on the unobserved regions of the ge-netic space. The derivation of validated GP maps from makes it possible to integrate the environment in the
GP maps derived from molecular networks. In other the understanding of molecular mechanisms control-ling the expression of complex traits remains a major simulations, we have defined on the same model trait
functions to quantify the ability of the model to react scientific challenge (Guetet al.2002).
Exploration of the genetic space:Assuming that a GP map quickly to environmental perturbations or to quantify
the stability and robustness of a network (not shown). with good prediction power is available, then another possible application of this type of simulation is the Trait and performance functions:We were surprised to
find networks exhibiting oscillations in one environ- identification of the genotypes with outstanding levels of performance by exploring the genetic spacein silico ment at the end of the selection process. This
observa-tion illustrates the dependence of the selecobserva-tion outcome rather thanin vivo. These genotypes could then be assem-bled by fixing alleles one locus at a time, using genotyping on the trait functions and performance index. By using
could be evaluated today by introducing a genetic variabil- in our simulation experiment. This suggests that at the ity in artificial gene networks (Hastyet al.2002;Kaern population level the system is initially in a largely
addi-et al.2003). tive state, despite these molecular interactions.
How-Molecular noise:In the context of this article, the gene ever, following cycle 50 the results of the selection pro-network dynamics have been represented by differential cess are much less predictable. This indicates that the equations. It is recognized that the small copy number initial cycles of selection predictably fix particular alleles of some molecules involved in the mechanisms of gene at seven loci. The additive genetic variation associated expression (e.g., transcription complexes, genes) can with these five loci is exploited by selection. Following result in molecular fluctuations that are responsible for this additive gain, the population structure is such that some level of phenotypic variability. This has been ad- the system moves into a state where there are more dressed theoretically (Peccoud andYcart1995), nu- context-dependent, nonadditive effects exploited by se-merically (Arkinet al.1998;GossandPeccoud1998), lection. The consequence is the many possible selection and experimentally (Elowitzet al.2002). Using a sto- end points by cycle 100. It may thus be necessary to chastic model of the gene network dynamics might have refine our understanding of the consequences of molec-a significmolec-ant impmolec-act on the outcome of the selection ular interactions by, for instance, relating genetic epista-process. It is likely to smooth the performance land- sis to the control properties of the regulatory circuits scape. Having nondeterministic performance values of the gene network model (Thomas1999). Further, would also reduce the likelihood of the process being the results we observe reinforce that views of genetic trapped in local performance minima. By modeling mo- variation based on the concepts of additive and nonaddi-lecular interactions with mass-action equations as op- tive (dominance, epistatic) components of variance for posed to specialized biochemical kinetics, it is possible a trait are population specific and are therefore time to simulate the fluctuations of molecular interactions dependent in relation to the cycles of selection (Car-without changing the model. In a follow-up article we roll et al. 2003). The work presented in this article will show how molecular noise can influence the re- paves the way to a more formal analysis of the genetic sponse to selection of a molecular network. It seems properties of molecular networks. In particular, it is likely that molecular noise influences the expression of necessary to analyze physiological and statistical genetic some complex traits in higher organisms (Cooket al. effects (Cheverud and Routman 1995; Holland 1998;Kemkemeret al.2002). The framework described 2001). The techniques for analyzing genetic interac-in this article makes it possible to interac-investigate its evolu- tions between more than two loci raise a number of tionary consequences. theoretical and computational problems that are
be-Context-dependency of genetic effects:For seven of the loci, yond the scope of this article.
one of the alleles was fixed in⬎95% of the runs. These It is an inspirational first step to use models of molecular alleles can be regarded as favorable within the context interactions for gene networks and their gene-to-pheno-of this parameterization gene-to-pheno-of the genotype-to-phenotype type mappings, such as our representation of the galac-mapping of the galactose pathway. In a first approxima- tose pathway, to consider the complex biological pro-tion, these alleles have a strong additive effect on perfor- cesses involved in the changes brought about by plant mance. However, for the remaining polymorphic loci, breeding. In turn this provides a demonstration of im-the contribution of each allele to performance is context portant issues that must be considered in the design of dependent and it is not possible to classify either of the molecular plant breeding strategies.
alleles as favorable without specifying the context. At
We thank Howie Smith and two anonymous reviewers for valuable the individual level, the context refers to the alleles comments and suggestions. This work would not have been possible present at other loci associated to the trait. At this level, without the support of Bob Merrill and Roy Luedtke.
the context dependency of allele values results from the nonlinearity of the model of molecular interactions. Context dependency can also be considered at the
pop-LITERATURE CITED ulation level. The selective values of the allele at one
particular locus depend on the allele frequencies of all Arkin, A., J. RossandH. H. McAdams, 1998 Stochastic kinetic analysis of developmental pathway bifurcation in phage -infected
Esche-other loci associated to the trait being selected.
richia colicells. Genetics149:1633–1648.
Epistasis is a challenging concept with different mean- Carroll, S. P., H. DingleandT. R. Famula, 2003 Rapid appear-ings in molecular biology and genetics. At the molecular ance of epistasis during adaptive divergence following coloniza-tion. Proc. R. Soc. Lond. B Biol. Sci.270(Suppl 1): S80–S83. level, all the genes of the GAL system are engaged in
Cheverud, J. M., andE. J. Routman, 1995 Epistasis and its contribu-some form of cis or trans interaction. Epistasis seems tion to genetic variance components. Genetics139:1455–1461. prevalent at this level. For geneticists, epistasis is associ- Cohen, S. D., andA. C. Hindmarsh, 1996 CVODE, a stiff/nonstiff
ODE solver in C. Comput. Phys.10:138–143. ated with the limits of the additive model of gene action.
Cook, D. L., A. N. Gerber andS. J. Tapscott, 1998 Modeling If the complexity of the selection process indicates
epi-stochastic gene expression: implications for haploinsufficiency. static effects, it is nonetheless striking that most genetic Proc. Natl. Acad. Sci. USA95:15641–15646.
the NK model to incorporate gene by environment interactions through metabolic engineering of the GAL gene regulatory net-work. Nat. Biotechnol.18:1283–1286.
and epistasis for diploid genomes. Complexity7:31–47.
Ostling, J., andH. Ronne, 1998 Negative control of the Mig1p
Cooper, M., S. C. Chapman, D. W. PodlichandG. L. Hammer, 2002
repressor by Snf1p-dependent phosphorylation in the absence The GP problem: quantifying gene to phenotype relationships.
of glucose. Eur. J. Biochem.252:162–168. In Silico Biol.2:151–164.
Peccoud, J., andB. Ycart, 1995 Markovian modelling of gene
prod-De Jong, H., 2002 Modeling and simulation of genetic regulatory
ucts synthesis. Theor. Popul. Biol.48:222–234. systems: a literature review. J. Comput. Biol.9:67–103.
Perera, F. P., 1997 Environment and cancer: Who are susceptible?
Elena, S. F., andR. E. Lenski, 2001 Epistasis between new mutations
Science278:1068–1073. and genetic background and a test of genetic canalization.
Evolu-Podlich, D. W., and M. Cooper, 1998 QU-GENE: a simulation tion55:1746–1752.
platform for quantitative analysis of genetic models.
Bioinformat-Elowitz, M. B., andS. Leibler, 2000 A synthetic oscillatory network
ics14:632–653. of transcriptional regulators. Nature403:335–338.
Podlich, D. W., andM. Cooper, 1999 Modelling plant breeding
Elowitz, M. B., A. J. Levine, E. D. SiggiaandP. S. Swain, 2002
programs as search strategies on a complex response surface. Stochastic gene expression in a single cell. Science297:1183–
Lect. Notes Comput. Sci.1585:171–178. 1186.
Ronne, H., 1995 Glucose repression in fungi. Trends Genet.11:
Erdi, P., andJ. Toth, 1989 Mathematical Models of the Chemical
Reac-12–17.
tion, Vol. 1. Princeton University Press, Princeton, NJ.
Rutherford, S. L., 2000 From genotype to phenotype: buffering
Eshed, Y., andD. Zamir, 1996 Less-than-additive epistatic
interac-mechanisms and the storage of genetic information. BioEssays tions of quantitative trait loci in tomato. Genetics143:1807–1817.
22:1095–1105.
Falconer, D. S., andT. F. C. Mackay, 1996 Introduction to
Quantita-Steinmetz, L. M., H.Sinha, D. R.Richards, J. I.Spiegelman, P. J.
tive Genetics, Ed. 4. Prentice Hall, Englewood Cliffs, NJ.
Oefneret al., 2002 Dissecting the architecture of a quantitative
Frank, S. A., 1999 Population and quantitative genetics of regulatory
trait locus in yeast. Nature416:326–330. networks. J. Theor. Biol.197:281–294.
Thomas, R., 1999 Deterministic chaos seen in terms of feedback
Goss, P. J. E., andJ. Peccoud, 1998 Quantitative modeling of
sto-circuits: analysis, synthesis, labyrinth chaos. Int. J. Bifurcat. Chaos chastic systems in molecular biology using stochastic Petri nets.
9:1889–1905. Proc. Natl. Acad. Sci. USA95:6750–6755.
Venkatesh, K. V., P. J. Bhat, R. A. KumarandP. Doshi, 1999
Quan-Guet, C. C., M. B. Elowitz, W. HsingandS. Leibler, 2002
Combi-titative model for Gal4p-mediated expression of the galactose/ natorial synthesis of genetic networks. Science296:1466–1470.
melibiose regulon in Saccharomyces cerevisiae. Biotechnol. Prog.
Hasty, J., D. McMillenandJ. J. Collins, 2002 Engineered gene
15:51–57. circuits. Nature420:224–230.
Weatherall, D. J., 2001 Phenotype-genotype relationships in
mo-Holland, J. B., 2001 Epistasis and plant breeding. Plant Breed. Rev.
nogenic disease: lessons from the thalassaemias. Nat. Rev. Genet.
21:27–92.
2:245–255.
Houchmandzadeh, B., E. WieschausandS. Leibler, 2002
Estab-Yano, K., andT. Fukasawa, 1997 Galactose-dependent reversible lishment of developmental precision and proportions in the early
interaction of Gal3p with Gal80p in the induction pathway of Drosophila embryo. Nature415:798–802.
Gal4p-activated genes of Saccharomyces cerevisiae. Proc. Natl.
Ideker, T., V.Thorsson, J. A.Ranish, R. Christmas, J. Buhler
Acad. Sci. USA94:1721–1726.
et al., 2001 Integrated genomic and proteomic analyses of a
systematically perturbed metabolic network. Science292:929– Communicating editor: D.Voytas 934.
Kaern, M., W. J.Blakeand J. J.Collins,2003 The engineering of gene regulatory networks. Annu. Rev. Biomed. Eng.5:179–206.
APPENDIX
Kauffman, S. A., 1993 The Origins of Order: Self-Organization and Selec-tion in EvoluSelec-tion.Oxford University Press, London.
The model of the GAL switch is given in a format
Kemkemer, R., S.Schrank, W.Vogel, H.Grulerand D.Kaufmann,
suitable for use with the MATLAB functions for numeri-2002 Increased noise as an effect of haploinsufficiency of the
tumor-suppressor gene neurofibromatosis type 1 in vitro. Proc. cally integrating differential equations: Natl. Acad. Sci. USA99:13783–13788.
Kempthorne, O., 1988 An overview of the field of quantitative
genet-Y0⫽zeros(16, 1); % initial condition ics, pp. 47–56 inProceedings of the Second International Conference
on Quantitative Genetics,edited byB. S. Weir,E. J. Eisen, M. M. Y0(1)⫽0.000000; % GalExt GoodmanandG. Namkoong.Sinauer, Sunderland, MA.
Y0(2)⫽0.000000; % GluExt
Leamy, L. J., E. J. RoutmanandJ. M. Cheverud, 2002 An epistatic
Y0(3)⫽0.000000; % Gal genetic basis for fluctuating asymmetry of mandible size in mice.
Y0(4)⫽0.000000; % Glu-6P Evolution56:642–653.
Li, Z., S. R.Pinson, W. D.Park, A. H.Patersonand J. W.Stansel, Y0(5)⫽0.000000; % Gal80p 1997 Epistasis for three grain yield components in rice (Oryza Y0(6)⫽0.000000; % Gal4p sativa L.). Genetics145:453–465. Y0(7)⫽0.000000; % Gal3p
Li, Z. K., L. J.Luo, H. W.Mei, D. L.Wang, Q. Y.Shu et al., 2001 Y0(8)⫽0.000000; % GAL-4-80 Overdominant epistatic loci are the primary genetic basis of
in-Y0(9)⫽0.000000; % GAL-4-80-3 breeding depression and heterosis in rice. I. Biomass and grain
Y0(10)⫽0.000000; % Glu yield. Genetics158:1737–1753.
Y0(11)⫽0.000000; % gal4g
Luo, L. J., Z. K.Li, H. W.Mei, Q. Y.Shu, R.Tabienet al., 2001
Over-Y0(12)⫽1.000000; % gal4gX dominant epistatic loci are the primary genetic basis of inbreeding
depression and heterosis in rice. II. Grain yield components. Y0(13)⫽0.000000; %E Genetics158:1755–1771. Y0(14)⫽1.000000; % GAL
McAdams, H. H., andA. P. Arkin, 1999 It’s a noisy business! Genetic Y0(15)⫽0.000000; % GAL-4 regulation at the nanomolar scale. Trends Genet.15:65–69. Y0(16)⫽0.000000; % Gal3p*
Micallef, K. P., M. CooperandD. W. Podlich, 2001 Using clusters of computers for large QU-GENE simulation experiments.
Bioin-KC⫽zeros(27, 1); % vector of kinetic parameters formatics17:194–195.
Omholt, S. W., E. Plahte, L. OyehaugandK. Xiang, 2000 Gene
KC(1)⫽50.000000; % Gal80p→0 regulatory networks generating the phenomena of additivity,
KC(2)⫽36.000000; % Gal4p→0 dominance and epistasis. Genetics155:969–980.
KC(3)⫽40.000000; % Gal3p→0
Ostergaard, S., L. Olsson, M. JohnstonandJ. Nielsen, 2000
KC(5)⫽82.000000; %E→0 r18⫽KC(18) * Y(9); % Gal3p*⫹GAL-4-80←GAL-4-80-3 r19⫽KC(19) * Y(15); % GAL-4→GAL-4⫹Gal80p KC(6)⫽1.000000; % GalExt→Gal
KC(7)⫽6.000000; %E⫹GalExt→Gal⫹E r20⫽KC(20) * Y(15); % GAL-4→GAL-4⫹Gal3p r21⫽KC(21) * Y(9); % GAL-4-80-3→GAL-4-80-3⫹ KC(8)⫽12.000000; %E⫹Gal→Glu-6P⫹E
KC(9)⫽100.000000; % Glu-6P→Glu Gal80p
r22⫽KC(22) * Y(9); % GAL-4-80-3→GAL-4-80-3⫹ KC(10)⫽10.000000; % Glu⫹gal4g→gal4gX
Gal3p KC(11)⫽1.000000; % Glu⫹gal4g←gal4gX
r23⫽KC(23) * Y(9); % GAL-4-80-3→GAL-4-80-3⫹E KC(12)⫽23.000000; % gal4g→gal4g⫹Gal4p
r24⫽KC(24) * Y(15); % GAL-4→GAL-4⫹E KC(13)⫽7.000000; % GAL⫹Gal4p→GAL-4
r25⫽KC(25) * Y(2); % GluExt→Glu KC(14)⫽9.000000; % GAL⫹Gal4p←GAL-4
r26⫽KC(26) * Y(3) * % Gal⫹Gal3p→Gal3p* KC(15)⫽3.500000; % GAL-4⫹Gal80p↔GAL-4-80
Y(7); KC(16)⫽5.000000; % GAL-4⫹Gal80p←GAL-4-80
r27⫽KC(27) * Y(16); % Gal⫹Gal3p←Gal3p* KC(17)⫽8.000000; % Gal3p* ⫹ GAL-4-80 →
GAL-4-80-3
Y2⫽zeros(16, 1); % state of the system KC(18)⫽10.000000; % Gal3p*⫹GAL-4-80←GAL-4-80-3
KC(19)⫽101.000000; % GAL-4→GAL-4⫹Gal80p
Y2(3)⫽1 * r6⫹1 * % GalExt KC(20)⫽2.000000; % GAL-4→GAL-4⫹Gal3p
r7⫹ ⫺1 * r8⫹ ⫺1 * KC(21)⫽338.000000; % GAL-4-80-3→GAL-4-80-3⫹
r26⫹1 * r27; Gal80p
Y2(4)⫽1 * r8⫹ ⫺1 * % GluExt KC(22)⫽309.000000; % GAL-4-80-3→GAL-4-80-3⫹
r9; Gal3p
Y2(5)⫽ ⫺1 * r1⫹ % Gal KC(23)⫽336.000000; % GAL-4-80-3→GAL-4-80-3⫹E ⫺
1 * r15⫹1 * r16 KC(24)⫽19.000000; % GAL-4→GAL-4⫹E ⫹
1 * r19⫹1 * r21; KC(25)⫽10.000000; % GluExt→Glu
Y2(6)⫽ ⫺1 * r2⫹1 * % Glu-6P KC(26)⫽1320.000000; % Gal⫹Gal3p→Gal3p*
r12⫹ ⫺1 * r13⫹1 * KC(27)⫽809.000000; % Gal⫹Gal3p←Gal3p*
r14;
Y2(7)⫽ ⫺1 * r3⫹1 * % Gal80p
% reaction rates r20⫹1 * r22⫹ ⫺1 *
r26⫹1 * r27; r1⫽KC(1) * Y(5); % Gal80p→0
Y2(8)⫽1 * r15⫹ ⫺1 * % Gal4p r2⫽KC(2) * Y(6); % Gal4p→0
r16⫹ ⫺1 * r17⫹1 * r3⫽KC(3) * Y(7); % Gal3p→0
r18; r4⫽KC(4) * Y(10); % Glu→0
Y2(9)⫽1 * r17⫹ ⫺1 * % Gal3p r5⫽KC(5) * Y(13); %E→0
r18; r6⫽KC(6) * Y(1); % GalExt→Gal
Y2(10)⫽ ⫺1 * r4⫹1 * % GAL-4-80 r7⫽KC(7) * Y(1) * % E⫹GalExt→Gal⫹E
r9⫹ ⫺1 * r10⫹1 * Y(13);
r11⫹1 * r25; r8⫽KC(8) * Y(3) * % E⫹Gal→Glu-6P⫹E
Y2(11)⫽ ⫺1 * r10⫹ % GAL-4-80-3 Y(13);
1 * r11; r9⫽KC(9) * Y(4); % Glu-6P→Glu
Y2(12)⫽1 * r10⫹ % Glu r10⫽KC(10) * Y(10) * % Glu⫹gal4g→gal4gX
⫺1 * r11; Y(11);
Y2(13)⫽ ⫺1 * r5⫹1 * % gal4g r11⫽KC(11) * Y(12); % Glu⫹gal4g←gal4gX
r23⫹1 * r24; r12⫽KC(12) * Y(11); % gal4g→gal4g⫹Gal4p
Y2(14)⫽ ⫺1 * r13⫹ % gal4gX r13⫽KC(13) * Y(6) * % GAL⫹Gal4p→GAL-4
1 * r14; Y(14);
Y2(15)⫽1 * r13⫹ %E r14⫽KC(14) * Y(15); % GAL⫹Gal4p←GAL-4 ⫺
1 * r14⫹ ⫺1 * r15⫽KC(15) * Y(5) * % GAL-4⫹Gal80p↔GAL-4-80
r15⫹1 * r16; Y(15);
Y2(16)⫽ ⫺1 * r17⫹ % GAL r16⫽KC(16) * Y(8); % GAL-4⫹Gal80p←GAL-4-80
1 * r18⫹1 * r26⫹ r17⫽KC(17) * Y(8) * % Gal3p* ⫹ GAL-4-80 → GAL-4- ⫺
1 * r27;