Transactions, SMiRT-23 Manchester, United Kingdom - August 10-14, 2015
Division V, Paper ID 861
PREDICTIVE STUDY OF CAP1400 SECONDARY CORE SUPPORT
STRUCTURE VIBRATION
Xue Guohong1, Zhang Wei1, and Zhang Ming1
1
ShangHai Nuclear Engineering Research & Design Institute, China
ABSTRACT
CAP1400 is a 1400 MWe pressurized water reactor (PWR) developed by SNERDI to be the next series of nuclear power plants in China. The design is a third generation passive safety plant and is bigger than the current 1000MWe design. As a part of the feasibility study, a 1/6 scale model test of the pressure vessel and its internals was conducted to study the flow induced vibration (FIV) characteristics. This paper describes the predictive study of the secondary support structure vibration and its successful comparison with the test measurements.
INTRODUCTION
The secondary core support structure (SCSS) is a structural assembly hanging underneath the lower core
support plate which is part of the core barrel assembly. In this structural assembly, Figure 1ˈthere are 12
vertical secondary support columns, one horizontal vortex suppression plate (VSP), 4 vertical energy absorbing columns and one horizontal base plate. The intent of this design is to absorb the energy in a core drop, a highly unlikely, event to keep the control rods engaged inside the core. When the reactor coolant flow turns and expands at the bottom of the core barrel, it impinges directly on these assembly members. Therefore, the structural integrity of the SCSS is one of the safety concerns.
The design of the CAP1400 SCSS is an enlarged version of the Westinghouse AP1000 SCSS which is a new design by itself. In the AP1000 design, a flow skirt, which is outside the SCSS and attached to the pressure vessel, is used to even out the coolant flow entering the fuel assemblies. In the CAP1400 design, the flow skirt, however, is not used. Instead, an even flow distributor, attaching to the bottom of the lower core support plate, is used. Therefore, although the two designs are similar, the flow fields in the lower head region are somewhat different.
Structure-wise, it is noted that the AP1000/CAP1400 SCSS is different from the earlier Westinghouse design, e.g., the 3xL plants, which are consisted of an upper and a lower tie plate assembly. The tie plates do not possess the function of evening out the flow distributions and the two assemblies are structurally independent of each other. It is also noted that, structurally, the AP1000/CAP1400 SCSS are similar to the repaired Qin-Shan 1 SCSS design, where the columns are of the similar size and the VSP is also of the similar design.
As a part of the CAP1400 feasibility study, a 1/6 scale model of the pressure vessel and internals was constructed and a FIV test was conducted to study the flow induced vibration characteristics. Prior to the test, predictive studies were carried out on the various parts of the reactor internals. This paper describes the methodologies used in predictive study of the SCSS vibration and the comparison with the test measurements.
Figure 1. Illustration of CAP1400 SCSS.
PREDICTION METHODOLOGY
Back when the damages of the Qin-Shan 1 secondary support columns were discovered in 1999, extensive analytical studies were made on the structural response of the subject assemblies for both the original design and the repaired design. In that work, the parameters used in the forcing function calculation were benchmarked against both the 1/5 Qin-Shan 1 scale model test and the Westinghouse’s 3xL 1/7 scale model test results. For this reason, the methodology is considered to be sufficiently verified. The basic formula for this method is that the mean square response, due to random vibration, of a lightly damped structure and for finite element study, the displacement can be expressed as :
2 2
2 2
/ 4 ij ij i
N
i F K
y "
#
!$
%
(1)
Where, y is Vibratory magnitude (RMS) at the anti-node of ith mode; Fij is Vibratory force acting on jth
node (either lift or drag) of ith mode; Ki is Generalized Stiffness of ith mode; ! is Eigenvector; " is
Percentage of critical damping, taken as 1%, i is Mode number; j is Node number. To obtain the various parameters of (1), the following specific steps were used.
(1) Build a CFD model of the core barrel downcomer and the lower head region and calculate the flow field.
(2) It is assumed that the flow impinging on the columns are all in the radial direction of the columns. Therefore, the radial flow velocities at each of the support columns/energy absorbers are estimated from the CFD results. For the VSP and the base plate, it is assumed that they are horizontally laying columns. (3) Build a 1/6 scale SCSS finite element structural model with the top of the secondary support columns fixed.
(4) Perform modal analysis with the structural model to obtain the frequency, the generalized stiffness and the normalized modal shapes of each mode. This is done for the first six modes. It is noted that the option that the maximum Eigen-vector normalized to 1.0 is used.
(5) Using the flow velocity calculated from the CFD model as input, calculate vibratory nodal forces;
)] ( / [ ] ) 2 / (
[ 2 2 2 *
2 f G D A C
FL " L&
('
& eff &'
& (2)Where, FL is Lift Force; CL is Lift Coefficient;
(
is Water density; ' is flow velocity; D is CharacteristicDimension here taken as diameter of the columns; f* is Reduced frequency, equal to f×D/V; Aeff is Area
exposed to the flow; Where the forcing function, G(f*), is calculated based on Fung’s correlation:
2 2 *
2 *
*) (2 / ) [1 3(2 / ) ]/[1 (2 / ) ]
(f l D f l D f l D
23rd Conference on Structural Mechanics in Reactor Technology Manchester, United Kingdom - August 10-14, 2015 Division V
Where, leff is effective length or the correlation length, for the best fit, Fung suggested the leff /D= 2.4. It is
noted that the equation for calculating drag forces are the same except CL is substituted by CD, the drag
coefficient. The fluctuating lift and drag coefficients are assumed to be 0.5 and 0.2, respectively, which are the same as those used in [1].
The vibratory magnitude of each mode at the anti-node is calculated by summing up the nodal forces, calculated in step 5, multiplied by the Eigen-vectors in the direction of the nodal forces and divided by the generalized stiffness.
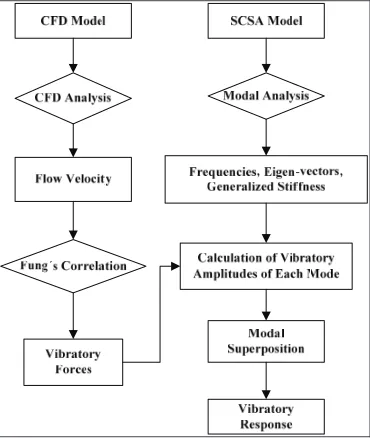
The responses of each mode are super-imposed (SRSS) to obtain the structural response of the SCSS. The entire process can be summarized in the following figure.
Figure 2 chart of entire process for prediction
FINITE ELEMENT MODEL
CFD Model
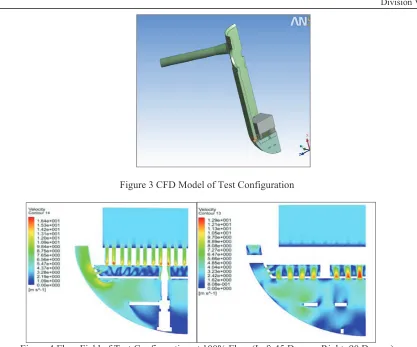
As stated above, a lower plenum CFD model was built for the CAP1400 1/6 scale model configuration. Because of symmetry, only a quarter section of the core barrel assembly, shown in Figure 3, is needed. The flow field at scale model 100% flow condition is shown in Figure 4.
Flow velocities in Table 1, in the lower head where SCSS is situated were estimated from the CFD results. It is noted that the flow velocities on the 12 support columns are divided into 3 groups:
A: 4 outer columns adjacent to the 90-deg (outlet nozzle) centerline. B: 4 outer columns adjacent to the 0-deg centerline.
C: 4 inner columns.
Figure 3 CFD Model of Test Configuration
Figure 4 Flow Field of Test Configuration at 100% Flow (Left:45 Degree, Right: 90 Degree)
Table 1 Estimated Flow Velocities on SCSS
Location V [m/s] Location V [m/s]
Group A Upper 5.2 Group C Upper 4.8
Group A Lower 6.5 Group C Lower 2.3
Group B Upper 8.3 Energy Absorber 3.2
Group B Lower 6.4 Base Plate 2.5
Vortex Suppression Plate 7.0 -
Structure Model
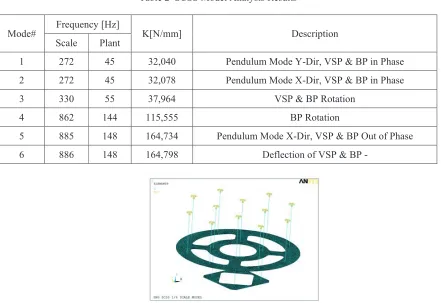
An ANSYS structural model was built in this study not only for modal analysis but also to obtain the stress/strain vs. displacement relationship. In this model, the columns are made of beam elements and the VSP and base plate were built with shell elements, as shown in Figure 5. It is also noted that Z is vertical and X-Y are the two horizontal directions.
23rd Conference on Structural Mechanics in Reactor Technology Manchester, United Kingdom - August 10-14, 2015 Division V
Table 2 SCSS Model Analysis Results
Mode# Frequency [Hz] K[N/mm] Description
Scale Plant
1 272 45 32,040 Pendulum Mode Y-Dir, VSP & BP in Phase
2 272 45 32,078 Pendulum Mode X-Dir, VSP & BP in Phase
3 330 55 37,964 VSP & BP Rotation
4 862 144 115,555 BP Rotation
5 885 148 164,734 Pendulum Mode X-Dir, VSP & BP Out of Phase
6 886 148 164,798 Deflection of VSP & BP -
Figure 5 Modal Shapes of First (Translation) and Third Mode (Rotation)
PREDICTIVE STUDY
Calculation of Modal Response
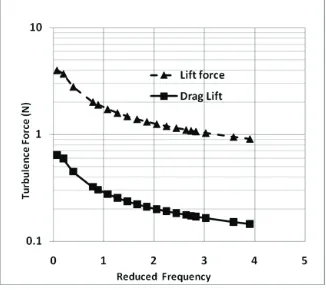
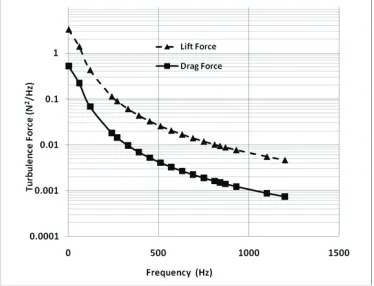
As stated before, the turbulence forcing functions on the various columns of SCSS are calculated using Fung’s correlation[1]. The maximum nodal lift and drag forces, which are on the lower portion of the 0-deg support columns, as a function of reduced frequencies are plotted in Figure 7.
Figure 7 Nodal Force on Lower Portion of the 0-deg Support Columns
Superposition of Modal Response
After the magnitudes of each mode at the anti-node are calculated, the reaction force or displacement at any given location of the SCSS is calculated by summing up (SRSS) the reaction force or displacement of all modes. This procedure was carried out using a spreadsheet.
Strain - Displacement Relationship
The strain gages are installed near the very top of the support columns. Therefore, the relationship between the bending strain at the top nodes and the displacement at the anti-node can be obtained for each mode. The total strain is also the superimposed strains from each of the six modes. The calculated bending strains at the strain gage location of the 0-deg column from the six modes investigated are shown in Table 3.
Table 3 Calculated Strains at 0-Deg Column SG locations from the 6 Modes
MODE # STRAIN MODE # STRAIN
1 4.36E-06 4 1.46E-07
2 9.99E-08 5 5.44E-09
23rd Conference on Structural Mechanics in Reactor Technology Manchester, United Kingdom - August 10-14, 2015 Division V
1/6 SCALE MODEL TEST
The 1/6 scale model was conducted in Chengdu, China. There are four loops used in this test where each pump can deliver a maximum flow rate of 816m3/hr. The test article is a geometrically scaled model, 1/6 scale of a CAP1400 reactor vessel and internals except the upper head components. In other words, the upper guide tubes and the instrumentation grid assembly are not modelled.
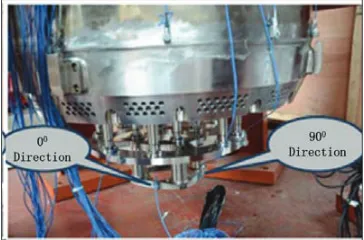
In this test, 3 vertically sensitive strain gages were mounted on the upper end of each of the 0-deg and the 180-deg columns, as shown in Figure 8. The test was conducted in room temperature and pressure.
Figure 8 SCSS Instrumentation
Responses at Transducer Locations
As stated before, originally there are 6 strain gages installed. Unfortunately, two of the strain gages, the 90 deg and the 270 deg of the 180-deg column, failed during testing. The rest of the strain gage readings are as following Table 4.
As seen from this table, the average strain gage reading at 100% flow is 7.49#$ which is very well
compared with the predicted value of 7.1#$.
Table 4 Strain Gage Reading (RMS) from Scale Model Test
Column-S.G NO. Flow Rate [%]
80 100 120
180-180 Degree S27 4.75 8.01 -
0-0 Degree S29 3.88 6.83 9.83
0-90 Degree S30 4.49 7.02 -
270 Degree S31 5.37 8.11 12.24
- AVG 4.62 7.49 11.04
Discussions
Figure 9. Using the PSD method and the same finite element model, the corresponding strain gage reading was predicted at 10.8*+. It is noted the predicted value is slightly larger than the test values. Therefore, it is concluded that the PSD method is also a useful tool.
Figure 9 PSD Input at Lower Portion of 0-Deg Columns
CONCLUSION
The modal superposition method in combination with the CFD flow field analysis, the Fung’s correlation and the assumed lift and drag coefficients proved, through comparison with the scale model test results, as a useful tool in predicting or calculating flow induced vibration due to turbulence in the secondary core support structures. Additionally, the PSD method is also a useful tool and the two methods are complimentary to each other.
REFERENCES