ISSN(Online): 2319-8753 ISSN (Print): 2347-6710
I
nternational
J
ournal of
I
nnovative
R
esearch in
S
cience,
E
ngineering and
T
echnology
(A High Impact Factor & UGC Approved Journal)
Website: www.ijirset.com
Vol. 6, Issue 8, August 2017
Influence of Cutting Parameters on Surface
Roughness in Face Milling Operation
Amit Moray1, Preeti Singh2
Asst. Professor, Department of Mechanical Engineering, Women Institute of Technology, Dehradun,
Uttarakhand,India1
Research Scholar, UTU Dehradun, Uttarakhand,India 2
ABSTRACT: Face Milling is presently the most efficient and creative manufacturing method for roughing and finishing large surfaces of metallic parts. The current study presents an approach to the determination of the optimal cutting parameters to create high metal removal rate in the face milling of high carbon alloy steel. The metal removal rate seriously varies with the change of machining parameter. This requires proper selection of the process parameter. The machining parameters taken for the study are cutting speed (rpm), feed rate (mm/tooth), depth of cut (mm) and coolant condition. Out of these four parameters the coolant used is a categorical parameter rest has numeric value. In present study the fractional factorial de-sign technique is used to optimize the process parameter in face milling of high carbon alloy steel EN-31 with tungsten coated face mill inserts. Two levels of 24-1 fractional factorial designs of eight runs were selected for conducting the experiments. The mathematical models were developed from the data generated. The significance of coefficients and adequacy of developed models were tested by‘t’-test and ‘F’ -test respectively. Out of four variables, depths of cut contribute the highest effect on MRR, followed by feed, interaction effect of feed and depth of cut. From the analysis it is clear feed con-tribute the highest effect on surface roughness. The established equations clearly show that surface roughness increased with increasing the feed and depth of cut but decreased with increasing the cutting speed under wet condition.
KEYWORDS: Optimization, EN-31, Machining parameter, Face Milling, Fractional factorial design technique.
I. INTRODUCTION
ISSN(Online): 2319-8753 ISSN (Print): 2347-6710
I
nternational
J
ournal of
I
nnovative
R
esearch in
S
cience,
E
ngineering and
T
echnology
(A High Impact Factor & UGC Approved Journal)
Website: www.ijirset.com
Vol. 6, Issue 8, August 2017
number or levels of the factors. Increased number of that is mainly due to higher order interactions which in most cases do not affect the response significantly [7]. The number of trials in a factorial experiment is considerably greater than the coefficients of a linear model to be determined. In other words a factorial experiment has a great surplus number of trials as a result increased cost of experimentation and wastage of time [8]. Obviously, it is desirable to reduce the number of trials and cost of running experiment. Often a large proportion of experimental effort is wasted in evaluating unimportant interactions and in deter-mining the experimental error with unnecessary degree of precision [9]. Hence fractional factorial design enables the size of an experiment to be reduced to a fraction that of full factorial experiment, which still provide all the important information.
II. METHODOLOGY
Work piece
EN -31 is a high carbon alloy steel having 16mm thick plate was used in this research work. The chemical composition of the material was determined with the spectrometer and tabulated in Table 1 also Composition of work piece has been shown in Table 2. The work piece used for present study in the rectangular form with the dimensions as 97 X 75 X 16 mm3
Table 1: Composition (Wt. %) of EN-31
C Si Mn Cr S P
0.95 0.25 0.46 1.36 0.04 0.035
Cutting Tool Material
The milling cutter used for machining having 4 cutting inserts made from tungsten carbide (coated).
Table 2 Composition
Serial No. Content Weight %
1 WC 87
2 Co 13
Table 3 Geometry of Cutting Tool
Serial No. Content mm
1 Cutter Dia. 50 2 Nose Radius 0.6
Cutting Fluid
Water immiscible cutting fluid was used during this experiment. However, this coolant is miscible with solvent or mineral oil. Desired coolant flow rate was achieved by regulating the supplied air pressure and the opening of nozzle.
Design of Experiment
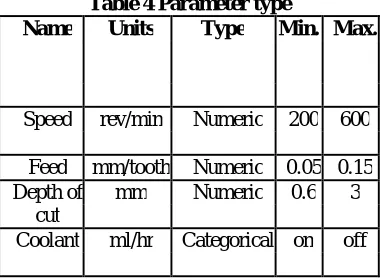
All the machining was carried out on 3 -axis CNC milling machine. Type of machining done in this experiment is Face milling. Design of experiment was multilevel factorial design which is summarized below in table 4.
Table 4 Parameter type
Name Units Type Min. Max.
Speed rev/min Numeric 200 600
Feed mm/tooth Numeric 0.05 0.15 Depth of mm Numeric 0.6 3
cut
ISSN(Online): 2319-8753 ISSN (Print): 2347-6710
I
nternational
J
ournal of
I
nnovative
R
esearch in
S
cience,
E
ngineering and
T
echnology
(A High Impact Factor & UGC Approved Journal)
Website: www.ijirset.com
Vol. 6, Issue 8, August 2017
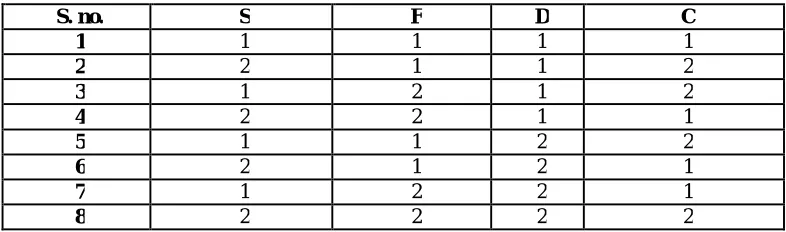
The design matrix developed to conduct the eight trials runs of 24-1 or 23 fractional factorial design as given in Table 5
Table 5: Design matrix
S. no. S F D C
1 1 1 1 1
2 2 1 1 2
3 1 2 1 2
4 2 2 1 1
5 1 1 2 2
6 2 1 2 1
7 1 2 2 1
8 2 2 2 2
The models of the type Y = f (S, F, D, C) could be developed to facilitate the prediction of a response within the specified dimensional tolerance for a particular set of direct process parameters. Assuming a linear relationship in the first instance and taking into account all the possible two factor interaction and confounded interactions, it could be written as
Y = b0+b1S+b2F+b3D+b4C+b12SF+b13SD+b14SC+b23 FD+b24FC+b34DC [Eqn. 1]
The regression coefficients of the selected model were calculated using Equation 3.2. This is based on the method of least squares.
/N, j = 0,1…..k [Eqn. 2] Where,
Xji= Value of a factor or interaction in coded form Yi = Average value of response parameter N= No. of observation
K= Number of coefficients of the model
Table 6 Coefficients of model
S. no. Coefficient Due to
1 b0 Combined effect of all parameter
2 b1 Cutting speed
3 b2 Feed rate
4 b3 Depth of cut
5 b4 Coolant effect
6 b12 Interaction of S and F 7 b13 Interaction of S and D 8 b14 Interaction of S and C 9 b23 Interaction of F and D 10 b24 Interaction of F and C 12 b34 Interaction of D and C
Checking The Adequacy Of The Developed Model
ISSN(Online): 2319-8753 ISSN (Print): 2347-6710
I
nternational
J
ournal of
I
nnovative
R
esearch in
S
cience,
E
ngineering and
T
echnology
(A High Impact Factor & UGC Approved Journal)
Website: www.ijirset.com
Vol. 6, Issue 8, August 2017
adequacy of the model was tested using analysis of variance technique. For this variance of optimization parameter (S2y) was determined. It can be calculated with Equation 3 as follows
Equation-3 Where,
ΔY2 = (Yiq-Ym)2
Ym = Arithmetical mean of repetitions Yiq = Value of response in a repetition trial N = Number of observations i = No. of trials
q = No. of repetition
Further, the variance of adequacy, also called as residual variance was determined by using following Equation 4
Equation -4 Where,
S2ad = variance of adequacy ym = observed response
yp = estimated / predicated value of response f = N-(K+1) (Degree of freedom) ∑ = residual sum of square
K = number of independently controllable variables.
The ratio of variance of adequacy to the variance of optimization parameter gives Fisher ratio:-
‘F’ ratio = S2ad/S2y Eqn. 5
The F-value obtained and denoted as (Fm) was compared with the table value as (Ft). It was found that the model was
adequate at 95% level of significance thus justifying the use of the assumed polynomial
Checking The Significance Of Coefficients Of Model
The statistical significance of the coefficients can be tested by applying‘t’ test. The level of significance of a particular parameter can be assessed by the magnitude of the‘t’ value associated with it. Higher the value of ‘t’, the more significant it becomes. ‘t’ value for the given coefficients of the models were calculated using Equation 3.7 as follows.
t = |bj|/Sbj.
where,
|bj| = absolute value of coefficients Sbj = standard deviation of coefficients
Sbj= Eqn. 6
Calculated‘t’ value were compared with the t-table value and statistically insignificant terms of the models were dropped. The value of ‘t’ from the standard table for eight degree of freedom and 95% confidence level is 2.306. Coefficients having calculated ‘t’ value less than or equal to ‘t’ value from the standard table for eight degree of freedom and 95% confidence level, are the members of reference distribution i.e. due to the and hence, they cannot be significant.
Final Modal
The final model could be obtained by dropping statistically in-significant terms from the developed models. Only significant decision variables are to be considered in the final model.
Observation
ISSN(Online): 2319-8753 ISSN (Print): 2347-6710
I
nternational
J
ournal of
I
nnovative
R
esearch in
S
cience,
E
ngineering and
T
echnology
(A High Impact Factor & UGC Approved Journal)
Website: www.ijirset.com
Vol. 6, Issue 8, August 2017
Table 7 Observational Table for surface roughness
Trial no. Speed (rev/min)
Feed (mm/tooth)
D.O.C
(mm) Coolant
(Set-1)R1
(Microns)
(Set-2)R2
(Microns)
(Set-3)R3
(Microns)
1 600 0.15 3 On 1.24 1.28 1.23 2 200 0.15 3 Off 1.83 1.92 1.87 3 600 0.05 3 Off 1.3 1.27 1.34 4 200 0.05 3 On 1.24 1.22 1.27 5 600 0.15 0.6 Off 1.23 1.22 1.2 6 200 0.15 0.6 On 1.25 1.42 1.31 7 600 0.05 0.6 On 0.71 0.77 0.75 8 200 0.05 0.6 Off 1.14 1.17 1.19
Development of Mathematical Model
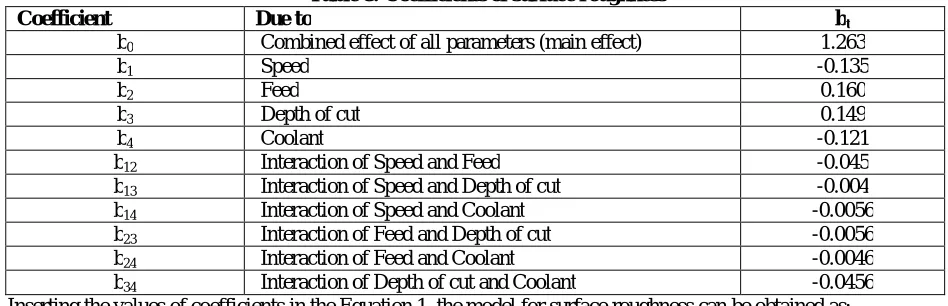
Coefficients of models were calculated using Equation 2 and presented in Table 8
Table 8: Coefficients of surface roughness
Coefficient Due to bt
b0 Combined effect of all parameters (main effect) 1.263
b1 Speed -0.135
b2 Feed 0.160
b3 Depth of cut 0.149
b4 Coolant -0.121
b12 Interaction of Speed and Feed -0.045
b13 Interaction of Speed and Depth of cut -0.004
b14 Interaction of Speed and Coolant -0.0056
b23 Interaction of Feed and Depth of cut -0.0056
b24 Interaction of Feed and Coolant -0.0046
b34 Interaction of Depth of cut and Coolant -0.0456
Inserting the values of coefficients in the Equation 1, the model for surface roughness can be obtained as:
Ra=1.263-0.135S+0.160F+0.149D-0.121C-0.045SF-0.004SD-0.0056SC-0.0056FD-0.0046FC-0.0456DC
[Eqn. 7]
Variance of optimization (S2y) for surface roughness is obtained by putting the values of surface roughness from two set of reading in Equations 3. Table 11 shows the variance of optimization for surface roughness.
t’-Values for the coefficient of metal removal rate
Using the Equation 3.7,‘t’ – values were calculated . These values were compared with the‘t’ –values taken from standard table. The value of‘t’ from standard table at (8, 0.05) is 2.306, hence statistically in significant terms i.e. having values less than 2.306 were dropped.
Ra=1.26-0.13A+0.16B+0.14C-0.12D-0.04AB-0.04CD
Variance Of Adequacy (S2 ad) For Surface Roughness
ISSN(Online): 2319-8753 ISSN (Print): 2347-6710
I
nternational
J
ournal of
I
nnovative
R
esearch in
S
cience,
E
ngineering and
T
echnology
(A High Impact Factor & UGC Approved Journal)
Website: www.ijirset.com
Vol. 6, Issue 8, August 2017
Table 9 Variance of adequacy (S2 ad) for metal removal rate
Surface roughness (Microns) S2ad
Estimated Observed
ΔR2
values values ΔR
1.224 1.23 0.006 3.306E-05 1.922 1.87 -0.052 2.678E-03 1.329 1.34 0.011 1.156E-04 1.174 1.27 0.096 9.168E-03 1.169 1.2 0.031 9.456E-04 1.379 1.31 -0.069 4.796E-03 0.787 0.75 -0.037 1.351E-03
1.119 1.19 0.071 5.006E-03 0.008
Table 10: Analysis of Variance for surface roughness
Degree of free- Variance of Variance of ‘F’-ratio model ‘F’-ratio ta- Adequacy of model
dom Adequacy response (Fm) ble (Ft)
f N At 3,8,0.05
Whether Fm< Ft
3 8 0.008 0.0027 2.887 4.12 Yes
III. RESULT AND DISCUSSION
The proposed models for the prediction of surface roughness after dropping the statistically insignificant terms, in coded form as given
below:-Ra= 1.26 - 0.13A + 0.16B + 0.14C - 0.12D - 0.04AB - 0.04CD
The hypothesis adopted for identifying the parameters, which were mainly and predominantly responsible for the interaction effect in a confounded pattern was to first drop those interactions that were due to parameter having insignificant effects and if there were still two or more interactions left in the confounded pattern then the interaction due to parameter which the most predominant effect was selected. The mathematical models furnished above can be used to predict the surface roughness by substituting the values of respective factors in coded form.
Influence of Cutting Speed on Surface Roughness
ISSN(Online): 2319-8753 ISSN (Print): 2347-6710
I
nternational
J
ournal of
I
nnovative
R
esearch in
S
cience,
E
ngineering and
T
echnology
(A High Impact Factor & UGC Approved Journal)
Website: www.ijirset.com
Vol. 6, Issue 8, August 2017
Fig.3: Plot between cutting speed & surface roughness Fig.4: Plot between feed & surface roughness
Influence Of Feed on Surface Roughness
The relationship between the feed and surface roughness for the given model of surface roughness has been shown in Fig. 4It could be concluded from this figure that with increase in feed from 0.05 mm/tooth to 0.15 mm/tooth, there is increase in surface roughness from 1.10 microns to 1.42 microns. Because higher feed rate tool traverses the work piece too speedily resulting in deteriorated surface quality and also high feed increase the chatter, which leads to higher surface roughness. The cutting forces increase with the increase in the rate of feed, resulting in increased heat generation. Higher feed rate increases vibrations which is responsible for rough surface.
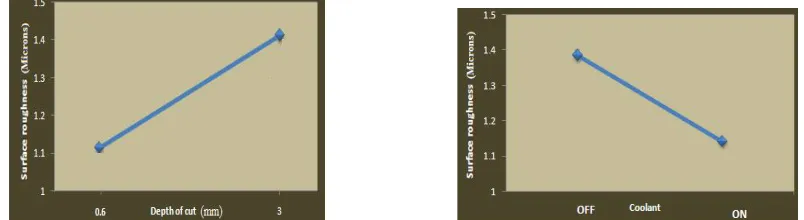
Influence Of Depth of cut on Surface Roughness
The relationship between the depth of cut and surface roughness for a given model of surface roughness has been shown in Fig. 5It could be concluded from this figure that with increase in depth of cut from 0.6 mm to 3mm, there is increase in surface roughness from 1.11 microns to 1.41 microns. The number of teeth engaged in the cut is directly proportional to the depth of cut; cutting friction is also increased because of more teeth cut grooves in to the work material this leads to increase in overall cutting forces. As the depth of cut increases the cutting forces also increase resulting in increased vibrations and chattering as a result increased surface roughness.
Fig.5: Plot between depth of cut & surface roughness Fig.6: Plot between coolant levels & surface Roughness
Influence Of Coolant on Surface Roughness
ISSN(Online): 2319-8753 ISSN (Print): 2347-6710
I
nternational
J
ournal of
I
nnovative
R
esearch in
S
cience,
E
ngineering and
T
echnology
(A High Impact Factor & UGC Approved Journal)
Website: www.ijirset.com
Vol. 6, Issue 8, August 2017
Interactive effect of cutting speed and feed on surface roughness
The influence of cutting speed and feed on the surface roughness is shown in Fig.6. The plot clearly explains that at constant speed, the surface roughness increases as the feed rate increases because higher feed rate tool traverses the work piece too speedily resulting in deteriorated surface quality and also high feed increase the chatter, which leads to higher surface roughness. Also, at constant feed rate, the surface roughness decreases as the cutting speed increases resulting in better surface quality. It is further observed that rate of increase in surface roughness is higher at low cutting speed. The response surface due to interaction of cutting speed and feed on surface roughness has been shown in Fig. 7
Fig.7: Interaction plot between cutting speed & feed for surface roughness Fig 8 interaction plot between surface roughness and coolant
Interactive effect of depth of cut and coolant on surface roughness
Interactive effect of depth of cut and coolant on the surface roughness is shown in Fig.8. The plot clearly explains that at constant depth of cut, the surface roughness is higher when the coolant is off as compared to when coolant is on. It is due to the fact that coolant decrease the friction between tool and work piece during cutting thus improve the surface finish. It is further observed that surface roughness is higher at higher value of depth of cut. It is clear from the figure that roughness obtained without the use of coolant is higher than using the coolant. The response surface due to interaction of cutting speed and feed and interaction of coolant and depth of cut on surface roughness has been shown in Fig 9 and fig. 10 respectively.
Fig.8: Response surface due to an interaction of cutting speed and feed Fig.10: RS due to an interaction of coolant condition and D.O.C
IV. CONCLUSION
Out of four variables, feed contribute the highest effect on surface roughness, followed by depth of cut, cutting speed and coolant. The established equations clearly show that surface roughness increased with increasing the feed and depth of cut but decreased with increasing the cutting speed under wet condition.
Surface roughness decrease with increase cutting speed. The surface roughness was minimum (1.12 mic.) at 600 rpm and maximum (1.39 mic.) at 200 rpm.
Surface roughness increase with increase feed. The surface roughness was maximum (1.42 mic.) at feed 0.15 mm/tooth and minimum (1.10 mic.) at feed 0.05 mm/tooth.
Surface roughness increase with increase depth of cut. The surface roughness was maximum (1.41 mic.) at depth of cut 3 mm. and minimum (1.11 mic.) at depth of cut 0.6 mm.
ISSN(Online): 2319-8753 ISSN (Print): 2347-6710
I
nternational
J
ournal of
I
nnovative
R
esearch in
S
cience,
E
ngineering and
T
echnology
(A High Impact Factor & UGC Approved Journal)
Website: www.ijirset.com
Vol. 6, Issue 8, August 2017
REFERENCES
[1] Kapil Kumar Chauhan & Dinesh Kumar Chauhan (2013) “Optimization of Machining Parameters of Titanium Alloy for Tool Life” in “Journal of Engi-neering, Computers & Applied Sciences (JEC&AS)” Volume 2, No.6, June 2013 (ISSN No: 2319‐5606).
[2] Baek, Dae Kyun & kim, Hee sool.(2001).Optimization of feedrate in a face mill-ing operation using a surface roughness model, In-ternational Journal of Machine Tools & Manufac-ture, Vol.41, pp.451-462.
[3] Benardos, P.G. & Vosniakos, G.C.(2002). Predic-tion of surface roughness in CNC face milling using neural networks and Taguchi’s design of experi-ments, Robotics and Computer Integrated Manufac-turing, Vol.18, pp.343-354.
[4] Dweiri, F. & Al-Jarrah, M.(2003).Fuzzy surface roughness modeling of CNC down milling of Alumic-79, Journal of Materials Processing
Tech-nology, Vol.133, pp.266-275.
[5] Lo, ship-peng. (2003). An adaptive-network based fuzzy inference system for prediction of workpiece surface roughness in end milling,
Journal of Mate-rials Processing Technology, Vol.142, pp.665-675.
[6] Wang, Ming-Yung & Chang, Hung-yen.(2004).Experimental study of surface roughness in slot end milling AL2014-T6, International Jour-nal of Machine Tools & Manufacture, Vol.44,pp.51-57.
[7] Brezocnik, M. & kovacic, M.(2004).Prediction of surface roughness with genetic programming, Jour-nal of Materials Processing Technology, Vol. 157-158, pp. 28-36.
[8] Oktem, Hasan. & Erzurumlu, Tun-cay.(2005).Prediction of minimum surface rough-ness in end milling mold parts using neural network and genetic algorithm, Materials and design, Vol. 27, pp. 735-744.
[9] Chang, Ching-Kao & Lu, H. S.(2005). Study on the prediction model of surface roughness for side mill-ing operations, Int J Adv Manuf Technol, Vol. 29, pp. 867-878
[10] Zhang, Julie Z. & Chen, Joseph C.(2006).Surface roughness optimization in an end-milling operation using the Taguchi design method,