Speckle Reduction and Structure Enhancement
by Multichannel Median Boosted
Anisotropic Diffusion
Zhi Yang
Department of Electrical & Computer Engineering, University of Connecticut, Storrs, CT 06269-2157, USA Email:[email protected]
Martin D. Fox
Department of Electrical & Computer Engineering, University of Connecticut, Storrs, CT 06269-2157, USA Email:[email protected]
Received 31 August 2003; Revised 22 January 2004
We propose a new approach to reduce speckle noise and enhance structures in speckle-corrupted images. It utilizes a median-anisotropic diffusion compound scheme. The median-filter-based reaction term acts as a guided energy source to boost the struc-tures in the image being processed. In addition, it regularizes the diffusion equation to ensure the existence and uniqueness of a solution. We also introduce a decimation and back reconstruction scheme to further enhance the processing result. Before the iteration of the diffusion process, the image is decimated and a subpixel shifted image set is formed. This allows a multichannel parallel diffusion iteration, and more importantly, the speckle noise is broken into impulsive or salt-pepper noise, which is easy to remove by median filtering. The advantage of the proposed technique is clear when it is compared to other diffusion algorithms and the well-known adaptive weighted median filtering (AWMF) scheme in both simulation and real medical ultrasound images.
Keywords and phrases:speckle noise, median filter, anisotropic diffusion, image decimation.
1. INTRODUCTION
In ultrasound, synthetic aperture radar (SAR), and coherent optical imaging, a major issue that is tackled is speckle. The presence of the speckle affects both human interpretation of the images and automated feature detection and extraction techniques. Much work has been done on speckle modeling and speckle reduction over the years. Most methods used in speckle reduction have focused on the use of the local mean, variance, median, and gradient.
Lee [1,2] and Frost et al. [3] separately proposed their speckle reduction filters, which were adaptive to the local mean and variance. When local data are relatively homoge-neous, a heavy filtering is applied because the local data only contain noise plus very slowly varying signal. On the other hand, when large variations exist in local data, a light filter-ing or no filterfilter-ing is applied because this scenario is inter-preted as an edge or other structural change. The problem with these filtering schemes is that they allow noisy edges to persist.
Loupas et al. [4] proposed an adaptive weighted median filter (AWMF) to reduce the speckle effect. Karaman et al. [5]
proposed a region growth method and used a median filter within the grown regions to suppress speckle. Both [4,5] ap-plied a fixed-size filter window. Since there exists a particular root (seeSection 2.2) for a given-size filter window [6,7], the noise reduction ability of these adaptive filters is limited.
Hao et al. [8] used a multiscale nonlinear thresholding method to suppress speckle. They applied Loupas’s AWMF to filter the image first, then put the filtered image and the difference image (obtained by subtracting the filtered im-age from the original imim-age) into two wavelet decomposi-tion channels. Each channel applied thresholding procedures for all decomposition scales. However, their method has only slightly better detail-preserving results and no significant im-provement in speckle reduction over AWMF. This is because they used a global constant threshold in each scale. This threshold could not separate the speckle noise and the sig-nal optimally.
noise assumption (if the noise is not white, a prewhiten-ing procedure is required) and used the local largest direc-tional mean values to form the processed image. The the-ory of this method is well founded, but the practical imple-mentation raises false alarms, such as false lines and edges. The processed result actually blurred the edges and pro-duced artificial maximums (which could be misinterpreted as structures). Based on Czerwinski’s scheme, Yang et al. [11] modified the directional line-matched masks to a set of directional line-cancellation masks to simulate the di-rectional derivative process. After searching the local min-imum directional derivative, they performed simple filter-ing (such as sample mean, median, etc.) along the direc-tion of minimum direcdirec-tional derivative. This scheme took the coherent features of the structure and the incoherent features of the noise into account. Since the statistical vari-ation along the direction is minimum, the processing re-sult achieved significant structure enhancement while reduc-ing the speckle. However, this method is weak in delineat-ing sharp corners and has somewhat high computational cost.
Abd-Elmoniem et al. [12] proposed an anisotropic dif-fusion approach to perform speckle reduction and coher-ence enhancement. They applied an anisotropic diffusiv-ity tensor into the diffusion equation to make the diffu-sion process more directionally selective. Although they gen-erally had good results, the approach used raised the fol-lowing questions. (1) It used isotropic Gaussian smooth-ing to regularize the ill-posed anisotropic diffusion equa-tion. Although this kind of regularization has been proved to be able to provide existence, regularization, and unique-ness of a solution [13], it is against the anisotropic fil-tering principle. (2) The diffusivity tensor provided by a Gaussian smoothed image may not be effective for spa-tially correlated and heavy-tail distributed speckle noise. (3) Each speckle usually occupies several pixels in size. Without special treatment, there are chances to enhance the speckles, which is not desirable. Yu and Acton [14] proved that Lee [1, 2] and Frost’s [3] filter schemes were closely related to diffusion processes, and adopted Lee’s adaptive filtering idea into their anisotropic diffusion algo-rithm. However, the local statistics are actually isotropic, thus this method could not achieve the desired anisotropic processing.
In this paper, we will present a new anisotropic diffusion technique for speckle reduction and structure enhancement, which overcomes many of the problems mentioned above. The proposed technique is a compound technique. It uti-lizes the advantages of median filtering, anisotropic diffu-sion, and image decimation and reconstruction. The com-bination accelerates the iteration process and enhances the calculation efficiency. We applied the new method on arti-ficial images, speckle-corrupted “peppers” image (this is a commonly used test image), and ultrasound medical images. The advantages of the proposed technique are clear when it is compared to other diffusion methods and the well-known AWMF method.
2. FOUNDATIONS FOR THE PROPOSED TECHNIQUE
2.1. Speckle model
The classical speckle model was proposed by Goodman [15,
16] for coherent optical imaging. According to this model, the signal in a detector element is a superposed result of a large number of incident subsignals. The magnitude of the signal usually follows a heavy-tailed distribution, typically Rayleigh. The speckles are spatially correlated. The correla-tion length is usually a few pixels (typically 3 to 5 pixels).
2.2. Median filter
The median filter is a well-known “edge preserving” non-linear filter. It removes the extreme data while producing a smoothed output. The median filter is not a lowpass filter in the Fourier spectrum sense. Assuming the input data is an identical and independently distributed (i.i.d.) sequence, and the distribution is symmetrical, the median filter gives a similar result to the linear filter. If the distribution is heavy tailed,the median filtered result will be superior to the linear filtered result [6].
After repeated filtering with a given size mask, the me-dian filtered result will reach a steady “state,” referred to as the “root” image [6,7]. Increasing the mask size will result in a smoother root image. On the other hand, once the root image has been reached with a larger size mask, decreasing the mask size will not change the root image. The root im-age should not be interpreted as noise free. It can contain larger scale noise. It is desirable to further filter the root im-age to provide additional cleaning, but it is not possible with a fixed-size median mask. It is not feasible to reach a new root image by increasing the mask size because valuable de-tails can be removed by this approach.
2.3. Anisotropic diffusion
Diffusion is a fundamental physical process. For isotropic diffusion, the process can be modeled as a Gaussian smooth-ing with continuously increased variance. For anisotropic diffusion, the smoothing process becomes more directionally selective. Letu(x,y,t) represent an image field with coordi-nates (x,y) at timetwhileDis the diffusion coefficient. The diffusion fluxϕis defined as
ϕ= −D∇u. (1)
With the matter continuity equation, we have
∂u
∂t = −∇ •ϕ. (2)
Putting (1) and (2) together, we get the diffusion equation
∂u
∂t = ∇ •(D∇u), (3)
process becomes anisotropic. If a source term f(x,y,t) is added to the right-hand side of (3), the diffusion equation
can be generalized to a nonhomogeneous partial differential equation
∂u
∂t = ∇ •(D∇u) +α f, (4)
whereαis a weighting coefficient.
To solve the above partial differential equation, the origi-nal imageu0is used as the initial condition and the Neumann
boundary condition is applied to the image borders:
u(x,y,t)t=0=u0,
∂nu=0.
(5)
The Neumann boundary condition avoids the energy loss in the image boundary during the diffusion process.
Perona and Malik (PM) [17] suggested two well-known diffusion coefficients: sion process will be encouraged when the magnitude of the local gradient is low, and restrained when the magnitude of the local gradient is high. The PM diffusion scheme is a non-linear isotropic diffusion method according to Weickert [18]. However, as shown inSection 3.3, with two-dimensional ex-plicit finite-difference implementation,Dis a function of the direction, thus the diffusion process becomes anisotropic.
The parameterk is a threshold that controls when the diffusion is a forward process (smoothing) and when it is a backward process (enhancing edges). Both (6) and (7) give perceptually similar results, but (6) emphasizes noise re-moval while (7) emphasizes high-contrast preservation.
Catte et al. [13] pointed out that the PM approach has several serious practical and theoretical difficulties even though this method has worked very well withad hoc treat-ments. These difficulties are centered around the existence, regularization, and uniqueness of a solution for (3) with diffusivity (6) or (7). Without special treatment, the PM method can misinterpret noises as edges and enhance them to create false edges.
Catte et al. changeds= |∇u|in the PM diffusivity func-tion to
s=∇Gσ∗u. (8)
HereGσ is a Gaussian smoothing kernel and “∗” is the con-volution operator. In this approach,|∇Gσ∗u|is used to bet-ter estimate the local gradient instead of the noise sensitive |∇u|. They proved that this modification provides a suf-ficient condition for solution existence, regularization, and uniqueness.
However, the use of space-invariant isotropic Gaussian smoothing is contradictive to the anisotropic filtering prin-ciple, and Gaussian filtering tends to push the image struc-tures away from their original locations. In the speckle re-duction case, the diffusivity function calculated from the Gaussian smoothed image creates additional problems since the speckle noise is spatially correlated and heavy-tail dis-tributed. For comparison purposes, the processing results with suchGaussian regularized anisotropic diffusion(GRAD) will be included inSection 4.
3. PROPOSED TECHNIQUE
3.1. Median boosted anisotropic diffusion technique
To perform anisotropic diffusion on speckle-corrupted im-ages, a natural choice is replacing Gaussian smoothing by median filtering. The median filter is a smoothing operator, which is superior to Gaussian smoothing in the heavy-tail distributed speckle noise situation. Catte’s proof concerning regularization (8) can still be applied to the median filtered case because the median filtered result is not worse than the Gaussian filtered result. Moreover, median filtering tends to preserve the image structure locations instead of dislocating them. As a result, the anisotropic diffusion process with me-dian regularization provides better and more precise results.
We also propose to use a median filtered source term f in the homogeneous diffusion equation to form an interac-tive process, which combines both median filtering and nat-ural diffusion. This technique is defined by the following re-lations:
a1 b1 a2 b2
Median & diMultichannelffusion
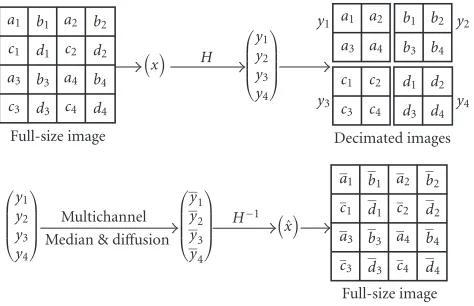
Figure1: Illustration of the image decimation, multichannel median-diffusion, and full-image reconstruction. The decimation rate here is √p=2.
3.2. Image decimation and multichannel processing
There are two apparent advantages to decimation of a speckle-corrupted image before further processing. First, decimation will break the speckles into quasi-impulsive or salt and pepper noise. The median filter has a well-known ability to deal with this type of noise. Second, decimation generates a set of subpixel shifted images. The size of these images is much smaller than the original image. The pro-cessing efficiency can be further improved bysquare of the decimation rateif parallel processing is applied.
The decimation process can produce aliasing in the dec-imated images, but the aliasing will not hurt the final recon-struction of the full-size image. Since we know exact sub-pixel shifts between the decimated images, the reconstruction process will be a well-posed super-resolution reconstruction process. The whole decimation and reconstruction processes can be formulated in the following manner:
y1=H1x,
wherexis the original image denoted as a vector with length N2, andy
1,y2,. . .,ypare the decimated images with diff er-ent subpixel shifts. Each yi is also denoted as a vector with lengthM2, andN = √p×M. Here,√pis the decimation
rate.H1,H2,. . .,Hpare the mapping matrices fromxto dif-ferentyi’s. They areM2×N2sparse matrices.
Figure 1illustrates the concept of the proposed decima-tion and multichannel processing technique. Assuming y1, y2,. . .,yp are the processed results of y1,y2,. . .,yp, there
are many ways to estimate the full-size image [19]. In our approach, we used a direct interpolation method. Since a speckle usually occupies several pixels, the recommended decimation rate should typically be 2 or 3. We chose 2 for all examples inSection 4. High decimation rate can cause dis-tortion or loss of image structures.
3.3. Explicit finite-difference approach
Following the PM explicit finite-difference approach, the proposed technique can be derived and numerically imple-mented using the following relations:
∂u
τis the time interval between the consecutive iterations andh is the spatial distance of two neighboring pixels.uni,jrefers to present pixel value at location (i,j) andun+1
south, east, and west, respectively. The diffusion coefficients DN,DS,DE,DWare calculated from formulas (10), (6) with entries listed in (16), but replace theu’s by the median filtered
f’s.
Parameterk in formula (6) is also calculated askN,kS, kE,kW: they are set to the standard deviations of the cor-responding difference value fields, represented by ∇Nuni,j, ∇Suni,j, ∇Euin,j, ∇Wuni,j. If a difference value at a particu-lar location is smaller than the corresponding standard de-viation, the difference value is considered to be induced by noise. If it is larger than the standard deviation, it is considered as an edge point or actual structural point, which should be preserved or enhanced during the pro-cess.
With the diffusion coefficientsDN,DS,DE,DW, the dif-fusion process encourages smoothing along the direction where the pixel values are less changed and restrains smooth-ing in the direction where the pixel values are dramatically changed. Due to the discrete finite-difference implementa-tion proposed above, the nonlinear diffusion process be-comes anisotropic.
To assure the stability of the above iterative equation, τ should satisfy 0 ≤ τ ≤h2/4. Here,τ is set to 1/4. As a
re-Whenβ = 0, the above equation becomes a homogeneous median-regularized anisotropic diffusion (MRAD); when β=1, the ongoing diffusion process is initialized to the me-dian filtered result of the current image state (un). Choosing βtoo big results in heavy median filtering, which can smooth out the fine structures, while choosingβtoo small, the pro-cess would not realize the benefits of the median filtering. We choseβ=0.2 in our experiments. One thing should be men-tioned here: theβ=1 case is similar to the median-diffusion method of Ling and Bovik [20] except they also used a me-dian filteredunto calculate the difference values in (19).
Next, we want to talk about the stopping criteria for the iterations. Practically, the number of iterations can be de-cided by the mean square difference between the result of the previous iteration and the current iteration. When the value is less than a preset stopping criterion, the program stops it-eration and produces a result. However, in the next section, the above stopping criterion was not used because to fairly compare different processing methods, one should use the same number of iterations in each case.
4. EXPERIMENTAL RESULTS
We generated an artificial image with the approximate spec-kle model
ω=ω0n, (20)
where ω0 is the noise-free image with gray level = 90 in
bright regions and gray level = 50 in dark regions andn is the noise-only image, which is constructed by a running average of an i.i.d. Rayleigh distributed noise image with a 5×5 Gaussian mask withσ =2. This simulates the corre-lation property of the speckle noise. ωis the observed sig-nal. The image size is 380×318.Figure 2shows the results of different filtering schemes on the artificial image. Specific information about the processing algorithms inFigure 2is given inTable 1. Since the processing time for the image dec-imation (0.02 second) and the full-size image reconstruction (0.01 second) is negligible compared to the one-channel dif-fusion time (1.342 seconds), we only give the one-channel processing time in Tables1,3,4,5. Here, we use the short no-tation MGAD to represent the median boosted (or guided) and median regularized anisotropic diffusion and DMAD to represent the decimated median boosted and median regu-larized anisotropic diffusion.
Visually, the result processed by the new method is much sharper in terms of edge preservation and smoother in terms of speckle noise reduction than the other two filtered re-sults. The execution time is also much shorter than the other two methods. For quantitative quality evaluation, we provide three metrics.
First, in terms of edge preserving or edge enhancement, we applied Pratt’s figure of merit (FOM) to give a quantita-tive evaluation [21]. The FOM is defined by
FOM= 1
where N and Nideal are the numbers of detected and ideal
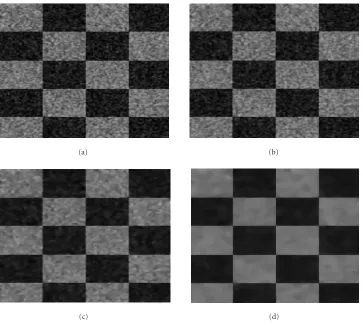
(a) (b)
(c) (d)
Figure2: (a) Artificial speckle image. (b) Processing result of the adaptive weighted median filter. (c) Processing result of the Gaussian regularized anisotropic diffusion. (d) Processing result of the decimated median boosted and median regularized anisotropic diffusion.
Table1: Specific information aboutFigure 2.
Figure 2b Figure 2c Figure 2d
Filter type AWMF GRAD DMAD
No. of iterations 1 15 15
Mask size 3×3 Gaussian 3×3
σ=1
Median 3×3
Execution time (s) 66.716 6.369 One channel
1.342
β — — 0.2
Second, the peak signal-to-noise ratio (PSNR) metric is also applied. PSNR evaluates the similarity between the pro-cessed imageyand the ideal imagexin terms of mean square error (MSE):
PSNR=10×log10
g2 max
x−y2 2
, (22)
wheregmax is the upper-bound gray level of the imagexor
Table2: Processing result assessment forFigure 2.
Metrics Filters
AWMF GRAD DMAD
FOM 0.3160 0.4806 0.8497
PSNR (dB) 21.8124 22.4398 22.9059
Q 0.1212 0.1266 0.1320
y(the images used throughout this paper are based on the scale of [0, 255], sogmaxis set to 255). • 2 is anl2-norm
operator. Higher PSNR means a better match between the ideal and processed images.
PSNR cannot distinguish the bias errors and random er-rors. In most cases, the bias errors are not as harmful as the random errors to the images, so we applied a third metric, the universal image quality index (Q), to evaluate the over-all processing quality. This idea was proposed by Wang and Bovik [22]. The formula of the universal image quality index is
Q=meanQ1Q2Q3
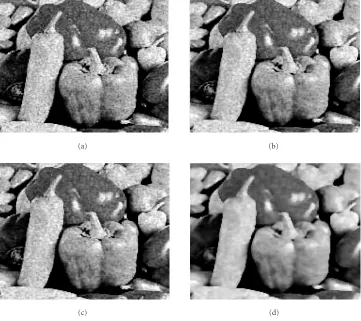
(a) (b)
(c) (d)
Figure3: (a) Speckle-corrupted peppers image. (b) Processing result of the adaptive weighted median filter. (c) Processing result of the Gaussian regularized anisotropic diffusion. (d) Processing result of the decimated median boosted and regularized anisotropic diffusion.
Table3: Specific information aboutFigure 3.
Figure 3b Figure 3c Figure 3d
Filter type AWMF GRAD DMAD
No. of iterations 1 4 4
Mask size 5×5 Gaussian 5×5
σ=2
Median 5×5
Execution time (s) 257.491 4.687 One channel
1.502
β — — 0.2
PSNR (dB) 16.9141 16.8820 17.3466
Q 0.4300 0.4299 0.4947
where
Q1=
σxy
σxσy, Q2= 2·xy
x2+y2, Q3=
2·σxσy σ2
x+σy2 . (24)
Q1 measures the local correlation (similarity) between
im-agesxandy,Q2measures the local processing bias, andQ3
measures the local contrast distortion. The average value of Q1Q2Q3over the whole image gives the universal image
qual-ity indexQ. The local measurement of each component ofQ is based on an 8×8 sliding window throughout the whole image. HigherQmeans a better match between the ideal and processed images.
Table 2 shows the evaluation results for the processed images inFigure 2. The FOM value indicates that the new method is better than other two methods in terms of edge preserving ability. PSNR andQvalues indicate that the new method gives a better processing result in terms of MSE and the overall processing quality.
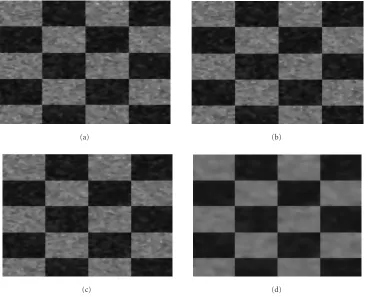
(a) (b)
(c) (d)
Figure4: (a) Processing result of the Gaussian regularized anisotropic diffusion. (b) Processing result of the median regularized anisotropic diffusion. (c) Processing result of the median guided and regularized anisotropic diffusion. (d) Processing result of the decimated median guided and regularized anisotropic diffusion.
Table4: Specific information aboutFigure 4.
Figure 4a Figure 4b Figure 4c Figure 4d
Filter type GRAD MRAD MGAD DMAD
No. of iterations 15 15 15 15
Mask size 3×3 3×3 3×3 3×3
Execution time (s) 6.299 7.180 7.451 One channel
1.332
FOM 0.4896 0.5099 0.5559 0.8428
FOM improvement — 4.13% 9.02% 51.61%
PSNR (dB) 22.4098 22.4409 22.5404 22.8881
PSNR improvement (dB) — 0.0311 0.0995 0.3477
Q 0.1267 0.1279 0.1290 0.1323
Qimprovement — 0.95% 0.86% 2.56%
We did not perform the FOM evaluation for the pep-pers image since we did not have the ideal edge data. From
Table 3, it is clear that the proposed method gives the best result, which is better than the AWMF by 0.4325 dB and the GRAD by 0.4646 dB in the PSNR and 15% in theQmetric.
(a) (b)
(c) (d)
Figure5: (a) Ultrasound medical image. (b) Processing result of the adaptive weighted median filter. (c) Processing result of the Gaussian regularized anisotropic diffusion. (d) Processing result of the decimated median guided and regularized anisotropic diffusion.
Table5: Specific information aboutFigure 5.
Figure 5b Figure 5c Figure 5d
Filter type AWMF GRAD DMAD
No. of iterations 1 6 6
Mask size 3×3 Gaussian 3×3
σ=1
Median 3×3
Execution time (s) 66.946 2.574 One channel
0.610
β — — 0.2
was used again to conduct the task because we have perfect knowledge about it. All the visual FOM, PSNR, andQ assess-ments can be performed.Figure 4shows the results from the GRAD (Figure 4a) and the anisotropic diffusions while pro-gressively adding the three components (Figure 4b—MRAD;
Figure 4c—MGAD; Figure 4d—DMAD). There is no
ob-servable difference between Figures4aand4b, but heavy iter-ative test has shown that the result from GRAD starts to blur much earlier than the MRAD. Figure 4cappears smoother than Figures 4a,4b.Figure 4dis the most enhanced result
compared to the other three results in terms of background smoothness and edge sharpness. Table 4 provides the de-tailed filtering information and the quantitative assessing re-sults. In terms of FOM criterion, the MRAD improves by about 4% over the GRAD, the MGAD improves by 9% over the MRAD, and the DMAD improves by almost 52% over the MGAD. In terms of PSNR criterion, the MRAD improves by 0.0311 dB over the GRAD, the MGAD improves by 0.0995 dB over the MRAD, and the DMAD improves by 0.3477 dB over the MGAD. In terms of Q criteria, the MRAD improves 0.95% over the GRAD, the MGAD improves 0.86% over the MRAD, and DMAD improves 2.56% over the MGAD. Al-though some improvements are small, they are consistent in all the experiments. From these numbers, we conclude that the decimation and parallel processing contribute the major gain. This test also verified that the median source term ac-celerated the convergence rate because with the same itera-tion numbers, the MGAD produced a better result than both GRAD and MRAD.
seen that the proposed technique delineates the structures of the image better and suppresses the speckle most effectively.
Table 5provides the detailed filtering information.
5. DISCUSSION AND CONCLUSIONS
In this paper, we have proposed some important innovations to enhance the anisotropic diffusion technique. First, median regularization overcomes the shortcomings of Gaussian reg-ularization. The modification provides optimal performance for the images corrupted by heavy-tail distributed speckle noise. Unlike the Gaussian regularization that tends to aver-age the errors to every pixel in the filter window, the median filter drops the extreme data and preserves the most reason-able. Median filtering also preserves the edge locations. These desirable properties provide better diffusion coefficient esti-mation than Gaussian regularization. Second, although the median regularization is introduced to anisotropic diffusion and makes the diffusion more directionally selective, the dif-fusion process is still an average filter fundamentally. Adding median boosting term allows the process to take full ad-vantage of the median filter. The interaction between the median boosting term and the anisotropic diffusion gener-ates more desirable results than the single anisotropic dif-fusion filtering or median filtering. Third, and most impor-tantly, the image decimation is used to break down speckle noise to quasi-impulse-type noise, which is easily removed by the median filter. Multichannel processing increases the processing speed greatly. Experimental results show that the new compound technique gives significant improvement in speckle reduction and image enhancement over previous techniques.
ACKNOWLEDGMENTS
The authors would like to thank the reviewers for their care-ful reading and constructive suggestions. The ultrasound medical image was collected under the funding support of NIH 9 R01 EB002136-2 and the study protocol was approved by the University of Connecticut Health (UConn) Center Institutional Review Board (IRB) Committee. Drs. Quing Zhu of ECE Department of UConn and Scott Kurtzman of UConn Health Center are thanked for providing the image.
REFERENCES
[1] J. S. Lee, “Digital image enhancement and noise filtering by use of local statistics,” IEEE Trans. on Pattern Analysis and Machine Intelligence, vol. 2, no. 2, pp. 165–168, 1980. [2] J. S. Lee, “Refined filtering of image noise using local
statis-tics,”Computer Vision, Graphics, and Image Processing, vol. 15, no. 2, pp. 380–389, 1981.
[3] V. S. Frost, J. A. Stiles, K. S. Shanmugan, and J. C. Holtzman, “A model for radar images and its application to adaptive dig-ital filtering of multiplicative noise,” IEEE Trans. on Pattern Analysis and Machine Intelligence, vol. 4, no. 2, pp. 157–166, 1982.
[4] T. Loupas, W. N. McDicken, and P. L. Allan, “An adaptive weighted median filter for speckle suppression in medical
ul-trasound images,” IEEE Trans. Circuits and Systems, vol. 36, no. 1, pp. 129–135, 1989.
[5] M. Karaman, M. A. Kutay, and G. Bozdagi, “An adaptive speckle suppression filter for medical ultrasonic imaging,”
IEEE Trans. on Medical Imaging, vol. 14, no. 2, pp. 283–292, 1995.
[6] N. C. Gallagher and G. L. Wise, “Median filters: a tutorial,” in
Proc. IEEE Int. Symp. Circuits and Systems (ISCAS 88), vol. 88, pp. 1737–1744, Espoo, Finland, June 1988.
[7] N. C. Gallagher and G. L. Wise, “A theoretical analysis of the properties of median filters,” IEEE Trans. Acoustics, Speech, and Signal Processing, vol. 29, no. 6, pp. 1136–1141, 1981. [8] X. Hao, S. Gao, and X. Gao, “A novel multiscale
nonlin-ear thresholding method for ultrasonic speckle suppressing,”
IEEE Trans. on Medical Imaging, vol. 18, no. 9, pp. 787–794, 1999.
[9] R. N. Czerwinski, D. L. Jones, and W. D. O’Brien Jr., “Line and boundary detection in speckle images,”IEEE Trans. Image Processing, vol. 7, no. 12, pp. 1700–1714, 1998.
[10] R. N. Czerwinski, D. L. Jones, and W. D. O’Brien Jr., “Detec-tion of lines and boundaries in speckle images—applica“Detec-tion to medical ultrasound,”IEEE Trans. on Medical Imaging, vol. 18, no. 2, pp. 126–136, 1999.
[11] Z. Yang, C. Li, J. Macione, and M. D. Fox, “Ultrasound B-scan image speckle noise reduction and boundary enhancement,” inProc. 7th World Multi-Conference on Systemics, Cybernetics and Informatics, vol. 4, pp. 258–263, Orlando, Fla, USA, July 2003.
[12] K. Z. Abd-Elmoniem, A. M. Youssef, and Y. M. Kadah, “Real-time speckle reduction and coherence enhancement in ultra-sound imaging via nonlinear anisotropic diffusion,” IEEE Trans. on Biomedical Engineering, vol. 49, no. 9, pp. 997–1014, 2002.
[13] F. Catte, P.-L. Lions, J.-M. Morel, and T. Coll, “Image selec-tive smoothing and edge detection by nonlinear diffusion,”
SIAM Journal on Numerical Analysis, vol. 29, no. 1, pp. 182– 193, 1992.
[14] Y. Yu and S. T. Acton, “Speckle reducing anisotropic diff u-sion,”IEEE Trans. Image Processing, vol. 11, no. 11, pp. 1260– 1270, 2002.
[15] J. W. Goodman, “Some fundamental properties of laser speckle,”Journal of the Optical Society of America, vol. 66, no. 11, pp. 1145–1150, 1976.
[16] J. W. Goodman, “Statistical properties of laser speckle pat-terns,” inLaser Speckle and Related Phenomena, Topics in Applied Physics, pp. 9–75, Springer-Verlag, Berlin, Germany, 1984.
[17] P. Perona and J. Malik, “Scale-space and edge detection using anisotropic diffusion,” IEEE Trans. on Pattern Analysis and Machine Intelligence, vol. 12, no. 7, pp. 629–639, 1990. [18] J. Weickert, “A review of nonlinear diffusion filtering,” in
Scale-Space Theory in Computer Vision, vol. 1252 ofLecture Notes in Computer Science, pp. 3–28, Springer-Verlag, Berlin, Germany, July 1997.
[19] S. C. Park, M. K. Park, and M. G. Kang, “Super-resolution image reconstruction: a technical overview,”IEEE Signal Pro-cessing Magazine, vol. 20, no. 3, pp. 21–36, 2003.
[20] H. Ling and A. C. Bovik, “Smoothing low-SNR molecular im-ages via anisotropic median-diffusion,” IEEE Trans. on Medi-cal Imaging, vol. 21, no. 4, pp. 377–384, 2002.
[21] W. K. Pratt, Digital Image Processing, Wiley, New York, NY, USA, 1978.
[22] Z. Wang and A. C. Bovik, “A universal image quality index,”
Zhi Yang received his B.S. degree from the Applied Physics Department, Northern Jiaotong University, Beijing, China, in 1990, and M.S. degree in electrical engineering from the China Academy of Railway Sci-ences (CARS), Beijing, China, in 1996. Af-ter graduation, he worked in CARS as a Research Engineer. He is currently a Ph.D. candidate in the Electrical & Computer En-gineering Department, University of
Con-necticut. His research interests are in the areas of signal/image processing, medical imaging, and microprocessor-based embedded system.
Martin D. Fox received his B.E.E. de-gree from Cornell University in 1969, the Ph.D. degree from Duke University in 1972, and the M.D. degree from the School of Medicine, University of Miami, in 1983. His 1978 paper, “Multiple crossed beam ultra-sound Doppler,” received the Best Paper Award of the IEEE Transactions on Sonics and Ultrasonics for that year. He has pub-lished extensively in the areas of medical