itable water (IPW) from GPS signal delays since 1994. Using rapid orbit information, these data have the accuracy required for use in a numerical weather prediction model through data assimilation. Parallel cycles with and with-out GPS-IPW data have been running at FSL since November 1997 using the 60-km Rapid Update Cycle (RUC). Verification of the analysis and the 3, 6, and 12-h forecasts against rawinsondes has been ongoing throughout the experiment. Results from these statistics show a consistent improvement in short-range forecasts of relative humidity when the GPS data are included. Precipitation verification has also been calculated for this experiment, and results show that GPS data also improve these forecasts. Recently, the average number of available GPS observations jumped from 18 to 56, and results for November-December 1999 show that the previous slight positive signal is now amplified to a stronger positive impact on the short-range moisture forecasts.
1.
Introduction
Due to insufficient observations, definition of atmospheric moisture fields (water vapor and cloud) remains a difficult problem whose solution is essential for improvement of weather forecasts. In the past few years, a largely unan-ticipated technique to estimate atmospheric integrated (total column) precipitable water (IPW) from Global Positioning System (GPS) signal delays has emerged (Duanet al., 1996). The magnitude of the signal delays caused by the neutral (i.e., nonpropagating) atmosphere depends on the refractive index associated with temperature, pressure, and water vapor. The “wet” component of the signal delay can be estimated using well-demonstrated techniques (Beviset al., 1994) with an error of about 5% under all weather conditions (Wolfe and Gutman, 2000). FSL is now producing IPW estimates from a demonstration network of about 56 sites. This number is expected to grow to about 200 over the next 3–5 years, mostly by incorporating GPS receivers deployed by other U.S. fed-eral agencies for purposes unrelated to meteorology, such as improved positioning and navigation for enhanced land and marine transportation safety.
These GPS-IPW observations provide high-frequency, ac-curate observations unaffected by weather conditions, as tests by FSL and others have shown. Satellite-based water va-por estimates are also available, but have limitations. Those based on measurements of upwelling infrared radiation are reliable only in cloud-free areas. Those based on upwelling microwave radiation (available only over oceans) are valid in cloudy regions, but are less accurate than the IR-based esti-mates. The GPS-based IPW measurements are most valuable
∗Affiliated with the Cooperative Institute for Research in the Atmosphere
(CIRA).
Copy right cThe Society of Geomagnetism and Earth, Planetary and Space Sciences (SGEPSS); The Seismological Society of Japan; The Volcanological Society of Japan; The Geodetic Society of Japan; The Japanese Society for Planetary Sciences.
when satellites cannot obtain good measurements, mainly in cloudy regions where, from a forecasting perspective, the need for accurate measurements is high.
Using the original 60-km version of the Rapid Update Cy-cle (RUC, Benjamin et al., 1994), a data sensitivity study has been performed to examine the accuracy of IPW infor-mation and the impact of GPS-IPW observations on short-range forecasts of moisture and precipitation. The RUC is an operational atmospheric prediction system, whose main components are a numerical forecast model and an analysis system to initialize that model. The RUC provides frequent short-range forecasts for forecast users in the United States. The version of the RUC used in this study produced new analyses and forecasts every 3 h, always using the previous 3-h forecast as a background, and is described further in Sec-tions 4 and 5. In order to gain a fair assessment of the impact of new observation systems, it is critical to determine the in-cremental value of the new system in the presence of other, already available observations. Since RUC already assimi-lated GOES (Geostationary Orbital Earth Satellite) precip-itable water data, rawinsonde, and hourly surface moisture data, it is well-suited for such an investigation.
2.
Current and Future GPS-IPW Networks
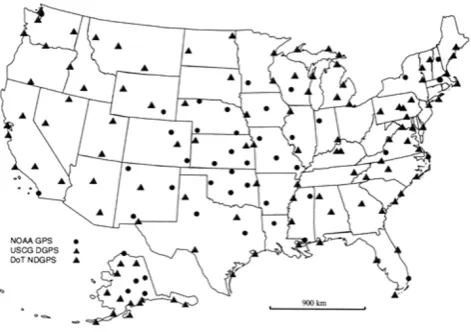
As of December 1999, data from 56 GPS-IPW systems are being acquired and processed by NOAA/FSL. These sites, located in the contiguous United States and Alaska (Fig. 1), consist of systems operated by NOAA and its affili-ates, the U.S. Coast Guard (USCG), and the U.S. Department of Transportation (DOT) Highway and Railway Administra-tions. The use of GPS deployed by other U.S. federal agen-cies for atmospheric remote sensing results from a fortuitous overlap of requirements with the positioning and navigational applications of GPS by the USCG and U.S. DOT. Of special importance are the systems operated and maintained by the USCG along the U. S. coast of the Gulf of Mexico, since theyFig. 1. The NOAA cooperative GPS network as of October 1999.
Fig. 2. The anticipated NOAA cooperative GPS network in 2003–2005.
provide additional water vapor observations near a relatively data-poor region.
The potential for expansion of the demonstration network in the next 3–5 years is illustrated in Fig. 2. Further expansion of the network from a demonstration system to an operational upper-air observing system is possible through the use of existing and planned installations belonging to NOAA and additional federal agencies, such as the National Weather Service and the Federal Aviation Administration.
3.
The Accuracy Requirement for GPS
Precip-itable Water
Despite there being no real-time moisture observations available in cloudy conditions other than 12-h rawinsondes (RAOBs) and surface observations, the skill of short-range precipitable water forecasts over the United States is reason-ably good, especially away from coastal areas. A previous study (Benjaminet al., 1998b) using rapid orbit GPS IPW observations (Wolfeet al., 1998) and 3-h analyses from the 40-km RUC (Benjaminet al., 1998a) not assimilating those observations showed that the standard deviation difference was below 3 mm for all but coastal stations. Therefore, for GPS-IPW observations to enhance current information
Fig. 3. Scatterplot of RAOB IPW vs. GPS IPW for 1996–1999.
away from U.S. coasts, GPS-IPW should have an accuracy of<2 mm and closer to 1 mm, if possible. A rapid orbit is defined as an improved GPS satellite orbit that is available 12–15 hours after the end of the day. Improved (with respect to the accuracy of“broadcast”) orbits are required to reduce the errors in GPS-IPW measurements to acceptable limits.
Fortunately, such accuracy is possible by using 1) rapid orbits to calculate the GPS signal delay caused by the tro-posphere and 2) accurate surface pressure and temperature measurements to parse this delay into its dry and wet compo-nents. The dry delay is estimated using accurate collocated surface pressure measurements that are mapped into signal delay using the method described by Saastamoinen (1972). The wet delay is determined by subtracting the dry delay from the zenith-scaled tropospheric delay and mapping the resulting“zenith wet delay”into IPW using a mapping func-tion that is nearly proporfunc-tional to mean moisture-weighted temperature (Tm) that is currently estimated using an
em-pirical formula (Bevis, 1994). In the future, more accurate estimates of Tmwill come from the operational NCEP RUC
model. Figure 3 shows a scatterplot of RAOB-IPW vs. GPS-IPW for 1996–1999. The GPS-IPW observing system was located at the Lamont, OK NOAA Profiler site, 9 km north of the Atmospheric Radiation Measurement (ARM) Cloud and Radiation Testbed (CART) central facility where 3600 balloon launches took place over this period. The standard deviation between these two observation systems was about 2.1 mm, with a mean difference of 0.08 mm and a correla-tion of 0.9854, which includes measurement error for both systems as well as small-scale variability.
4.
Assimilation of Integrated Precipitable Water
Data
dard deviation to the background error standard deviation of 0.1 for GPS-IPW (nonreal-time) and larger value for GOES IPW. The two passes use approximate e-folding correlation distances of 140 km and 67 km, respectively, to allow both medium- andfine-scale structure.
4) At each horizontal grid point distribute the IPW incre-ment calculated in step 3 vertically according to the back-ground forecast profile of water vapor. Specifically, the ab-solute moisture at each level above a given horizontal grid location will be either increased or decreased by the same percentage, thus preserving the shape of the moisture
pro-file.
5) If, after step 4, supersaturation occurs at any individ-ual levels, adjust vertical distribution in the column so that a correct increase of PW is still achieved but without supersat-uration.
6) Continue with the rest of the analysis, including that of single-level moisture observations. Thus, the nonintegrated moisture observations are given the“final say”in the mois-ture analysis.
This analysis procedure follows the general proposal of Gal-Chenet al.(1986), also used by Kuoet al.(1993), for assimilating vertically integrated quantities, that the back-ground vertical structure be retained in that assimilation. In some studies concerning the assimilation of satellite-derived IPW data (Aune, 1994; Ledvina and Pfaendtner, 1995), the model background is adjusted to an analysis of the IPW ob-servations. However, the adjustment proposed above is to an analysis of the IPW residuals to give a more accurate moisture analysis between IPW observations. Filibertiet al.(1994) showed successful experiments for assimilating SSM/I IPW values with an analysis technique equivalent to that proposed here using the French PERIDOT forecast model.
5.
Results from GPS-IPW Data Sensitivity
Exper-iment
To assess the impact of GPS-IPW observations, parallel cycles of the RUC assimilation system with and without GPS-IPW have been running at FSL since November 1997. The assimilation system is the original 60-km RUC, with 25 vertical hybrid isentropic-sigma levels, and assimilation of observations every 3 h using the previous 3-h forecast as background. The system ingests all available observations: RAOBs, wind profilers, ACARS (commercial aircraft) winds and temperatures, surface observations, and GOES precip-itable water. Boundary conditions, from the Nested Grid
Fig. 4. RH differencefield (%), GPS-no GPS, for 850 hPa at 0000 UTC 17 April 1998. The maximum increase in RH due to the inclusion of GPS data is marked by+14% and the maximum decrease by−23%. Plot interval is 2%.
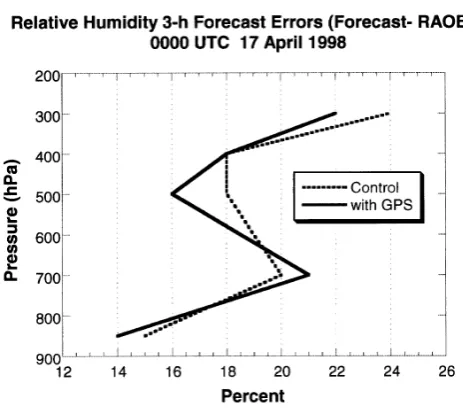
Fig. 5. RMS error verification statistics for RH over the verification area for 0000 UTC 17 April 1998. The solid line is the verification for the 3-h forecast from the GPS run compared to RAOBs. The dashed line is the verification for the control run 3-h forecast.
Model, are also the same, except that the runs include or ex-clude GPS-IPW from the NOAA network. The cycles are run in a 24-h delay, so as to ingest the most accurate GPS-IPW calculated with rapid orbit information. Twice-daily
Fig. 6. Plot of GPS-IPW data (cm) at De Queen, AR (DQUA); Haskell, OK (HKLO); Palestine, TX (PATT); Purcell, OK (PRCO); and Vici, OK (VCIO) for 16 April 1998. The locations of these stations can be seen in Fig. 1.
and size of this verification box had to be large enough to ob-tain an adequate number of verifying observations, but not so large that the mesoscale signal of the GPS information was lost in the areal average. An example of the mesoscale changes in definition of the moisturefield from assimilation of GPS-IPW is presented in Fig. 4, a differencefield between the GPS and no GPS control runs in the verification area for a 3-h forecast of 850 hPa relative humidity (RH) valid at 0000 UTC 17 April 1998. Most of the area has little change, but in eastern Texas the GPS data are moistening the RH ahead of a strong cold front by as much as 14% RH, and drying estimated RH behind the front by 23% RH. A plot of the RH verification numbers for this forecast averaged over the entire area (Fig. 5) shows that the overall impact of the GPS (solid line) was to improve the forecast by 1% RH at 850 hPa (the level in Fig. 4) and up to 2% RH at 500 hPa, although the 700 hPa forecast verified slightly worse with GPS. The mesoscale signal of the GPS, which was over 23% RH, has been dampened by the larger area of similar forecasts to the more modest numbers seen in the verification.
GPS data also have high temporal resolution, with obser-vations available every half-hour. The data going into the 3 h assimilation cycle from 5 of the sites for this case study are shown in Fig. 6. The sharp decline in IPW at these sites between 1200 UTC 16 April 1998 (dashed line) and 0000 UTC 17 April due to the cold front (right of the dashed line) occurred between RAOB times.
The RH forecasts are verified on the mandatory pressure levels (850, 700, 500, 400, 300 hPa); verification above 300 hPa is not performed due to known problems with the RAOB RH observations at upper levels. The number of GPS obser-vations in the verification area averaged 15, and the number of RAOB observations in the area averaged 18. The long-term average standard deviation difference between the RAOB and 3-h forecast RH for March 1998–September 1999 can be seen in Fig. 7. (Again, the solid line is the GPS run, and
Fig. 7. Same as Fig. 5, but for March 1998–September 1999. These results are for an average of 15 RAOBs over 857 verification times, around 12,855 data points.
the dashed line is the control run.) This average contains 857 verification times, mostly from quiet weather regimes where the two runs verified similarly. Even so, the runs with GPS show a slight, but consistent improvement, despite the sparse observations over a large area.
Fig. 8. Individual results for each verification time, 15 November–15 December 1999. Columns above the zero line denote positive impact from GPS data, and below show negative impact. The number of GPS sites for each time was around 50.
cycles verified the same (20 out of 40, or 50%), but when the scores differ, the results are now almost always improved in the runs with GPS data, with 17 of 20 runs improved, in several cases by more than 1% RH, and just three negative cases, none worse than 1% RH.
Long-term precipitation verification has also been a part of the sensitivity study. Equitable threat score (ETS), bias, probability of detection (POD), and false alarm ratio (FAR) have all been calculated for 24-h precipitation for which RUC forecasts are produced by summing eight 3-h fore-casts (accentuating possible effects on short-range forefore-casts). A detailed description of these parameters can be found in Doswellet al.(1990). The verifying observations were the 24-h totals from a national rain gauge network. Since the GPS data should have more impact during a weather event in the verification area, Table 1 shows verification for days with over 500 non-zero precipitation observations in the area from January–September 1999. Further, mean scores were calculated for each threshold only over the days there were at least some RUC 24-h forecasts exceeding those thresh-olds. The runs with GPS data have overall better ETS than the control runs, with comparable but slightly higher biases.
The RUC model used in these tests has some bias toward too little warm-season precipitation; GPS data often moistened the initial fields, increasing the precipitation coverage and amounts. In many instances this improved the forecasts, as can be seen by the improved bias scores. POD is also en-hanced by the inclusion of GPS data, but does suffer from a higher FAR (not shown).
6.
Summary
data will likely be evident in reconducting this experiment using further expansions in the network with more stations and greater horizontal coverage.
Acknowledgments. We thank John Brown and Nita Fullerton, as well as two anonymous reviewers, for their careful reviews of this paper.
References
Aune, R. A., Improved precipitation predictions using total precipitable water from VAS, 10th Conf. on Num. Wea. Pred., AMS, Portland, 192– 194, 1994.
Benjamin, S. G., K. J. Brundage, and L. L. Morone, The Rapid Update Cycle. Part I: Analysis/model description, Technical Procedures Bulletin No. 416, NOAA/NWS, 16 pp., 1994 [National Weather Service, Office of Meteorology, 1325 East-West Highway, Silver Spring, MD 20910]. Benjamin, S. G., J. M. Brown, K. J. Brundage, B. E. Schwartz, T. G.
Smirnova, T. L. Smith, L. L. Morone, and G. J. DiMego, The opera-tional RUC-2, 16th Conf. on Wea. Anal. and Forecasting, AMS, Phoenix, 249–252, 1998a.
Benjamin, S. G., T. L. Smith, B. E. Schwartz, S. I. Gutman, and D. Kim, Precipitation forecast sensitivity to GPS precipitable water observations combined with GOES using RUC-2, 12th Conf. on Num. Wea. Pred., AMS, Phoenix, 73–76, 1998b.
Bevis, M., S. Businger, S. Chiswell, T. A. Herring, R. A. Anthes, C. Rocken, and R. H. Ware, GPS meteorology: Mapping zenith wet delays onto precipitable water,J. Appl. Meteor.,33, 379–386, 1994.
Doswell, C. A., R. Davies-Jones, and D. L. Keller, On summary measures of skill in rare event forecasting based on contingency tables,Wea. Fore-casting,5, 576–585, 1990.
Duan, J., M. Bevis, P. Feng, Y. Bock, S. R. Chiswell, S. Businger, C. Rocken, F. Soldheim, R. H. Ware, T. A. Hering, and R. W. King, GPS meteorology: Direct estimation of the absolute value of precipitable water,J. Appl. Meteor.,35, 830–838, 1996.
Filiberti, M. A., L. Eymard, and B. Urban, Assimilation of satellite precip-itable water in a meteorological forecast model,Mon. Wea. Rev.,122, 486–506, 1994.
Gal-Chen, T., B. D. Schmidt, and L. W. Uccellini, Simulation experiments for testing the assimilation of geostationary satellite temperature retrievals into a numerical prediction model,Mon. Wea. Rev.,114, 1213–1230, 1986.
Kuo, Y.-H., Y.-R. Guo, and E. R. Westwater, Assimilation of precipitable water measurements into a mesoscale numerical model,Mon. Wea. Rev., 121, 1215–1238, 1993.
Ledvina, D. V. and J. Pfaendtner, Inclusion of Special Sensor Microwave/ Imager (SSM/I) total precipitable water estimates into the GEOS-1 data assimilation system,Mon. Wea. Rev.,123, 3003–3015, 1995.
Saastamoinen, J., Introduction to practical computation of astronomical re-fraction,Bull. Geod.,106, 383–397, 1972.
Wolfe, D. E. and S. I. Gutman, Development of the NOAA/ERL Ground-Based GPS Water Vapor Demonstration Network: Design and Initial Results,J. Atmos. Ocean. Technol., 2000 (in press).
Wolfe, D. E., S. I. Gutman, R. B. Chadwick, P. Fang, and Y. Bock, Develop-ment of an operational surface-based GPS water vapor observing system for NOAA: Network design and project status, 2nd Symp. on Int. Obs. Sys., AMS, Phoenix, J86–J91, 1998.