Placement of DG Units in Distribution
Networks by using Bifurcation Analysis
M.Nageswara Rao
Assistant Professor, Dept. of EEE, University College of Engineering (A), JNTUK, Kakinada, Andhra Pradesh, India
ABSTRACT: In this paper the proposed method employs the bifurcation analysis for placement of DG units in distributed networks. This method was based on the analysis of power flow continuation and determination of most sensitive buses to voltage collapse. After that, the DG units with certain capacity were installed in these buses following an objective function and iterative algorithm. In this algorithm continuous power flow (CPF) method was used for determination of the voltage collapse point or maximum loading. This method was implemented on a typical IEEE 34 bus test system to yield efficiency in improvement of voltage profile and reduction of power losses. It also permits an increase in power transfer capacity, maximum loading and voltage stability margin. The proposed CPF method was implemented using MATLAB.
KEYWORDS: Distribution Generation, bifurcation analysis, continuous power flow method, maximum loading.
I.INTRODUCTION
The newly introduced distributed or decentralized generation units connected to local distribution systems are, in general, not dispatchable by a central operator, but they can have a significant impact on the power flow, voltage profile, stability, continuity, and quality of power supply for customers and electricity suppliers. The exact output power of some distributed generations (DGs) such as photovoltaic energy converters and wind turbines depends on the weather and cannot be anticipated accurately. Due to the locally available resources and the small scale, DG units are mostly connected at the distribution level. When the penetration of DG is high, the generated power of DG units not only alters the power flow in the distribution system, but also in the transmission system. As a consequence, the connection of DG to the network may influence the stability of the power system, i.e., angle, frequency, and voltage stability [1]. It might also have an impact on the protection selectivity, and the frequency and voltage control of the system. The optimal and fast placement and assignment of DG units are one of the major challenges in the system design field and various methods were used for locating. Lagrange method, two degrees gradient method, and sensitivity analysis method have been used for placement [2-3].
Power system restructuring, technology progress, and tight constraints over the construction of new bulk substation and transmission lines have created increased interest in distributed generation as an alternative for supplying electric power to customers. DGs are smaller plant connected to the distribution systems. Distributed generation sources can be strategically allocated in distribution systems for reducing power losses, network reinforcement, improving system efficiency and reliability. Determining proper capacity and location of DG sources in distribution systems is important for obtaining their maximum potential benefits.
II. IMPACT OF DG TECHNOLOGIES ON VOLTAGE STABILITY
(A) Synchronous Generator
Conventional synchronous generators are capable of both generating and absorbing reactive power. Therefore, the use of DGs utilizing overexcited synchronous generators will allow on-site production of reactive power. The local generation of reactive power reduces its import from the feeder, thus reduces the associated losses, and improves the voltage profile[3,6]. As a result, the voltage security is also improved. P-V curves have been traditionally used as graphical tools for studying voltage stability in electric power systems. Fig.1 conceptually shows the impact of a synchronous generator on voltage stability of a hypothetical node. As can be seen in the figure, the installation of a DG unit P MW moves the operation point from point A to point B on the associated P-V curve, which results in an increase of the node voltage by the amount VDG-V0 and enhancement in voltage security: the stability margin increases
from m0 to mDG. The overall impact of a DG unit on voltage stability is positive. This is due to the improved voltage
profiles as well as decreased reactive power losses, as the following equation suggests:
Q =( ) ( ) X (1)
WhereP , Q , PDG, and QDG are the active and reactive power of the load and DG, respectively, and X is the
aggregate reactance of the line connecting the load to the feeding substation.
Fig.1. P-V curve enlargement of voltage stability margin
Note that for simplicity, the resistance of the line is neglected. Clearly, as the active power injected by distributed generator increases, the reactive power loss decreases. Thus, it has a positive impact on the voltage stability.
(B)Asynchronous Generators
converter interfaced generators gradually grows, reducing the likelihood of encountering voltage stability related problems [3,6].
(C) Line Commutated and Self-Commutated Converters
It is well known fact that conventional line commutated converters always consume reactive power. The amount of the consumed reactive power can be as high as 30% of the rated power of the converter. To compensate the Q demand, capacitor banks are normally installed on the ac side of the converter. This makes a line commutated converter qualitatively equivalent to a directly connected induction generator. Therefore, under certain circumstances, the presence of such a converter can negatively affect voltage stability. Moreover, the capacities of DG are often quite small, which makes the utilization of advanced power electronics devices economically beneficial. Therefore, it can be anticipated with certain degree of confidence that in the near future most of the power electronics converters will be self-commutated. The utilization of self commutated converters for interfacing DG units with network allows fast and precise control of the output voltage magnitude and angle. Therefore, reactive power can be either generated or absorbed, depending on the control mode. Since normally the power factor of such a converter is close to unity, no reactive power is injected in the network.
III. CONTINUATION POWER FLOW METHOD
The CPF method is a numerical method that is used to trace the trajectory of a power system from a stable equilibrium point up to a bifurcation point [4-5]. Such a method employs the following model:
g(y, ) = 0 (2)
Where y represents the state variables and is a system parameter used to drive the system from one equilibrium point to another. Because a set of power-flow equations suffices for such a model, it has been employed for voltage collapse studies, which can be considered as the system load/generation increase factor.
The CPF method is well covered elsewhere in the literature. The continuations methods rely on the choice of a continuation parameter (initially the degree of system loading) and on a twostep predictor-corrector iterative process. The predictor step, used to indicate a direction to move. The tangent vector may be used for this purpose. It is given by
Tp = J
P
Q (3)
Where J is the power-flow Jacobian matrix (see Appendix A) and P and Q are the net active and reactive powers connected to each bus. The entries of Tp are in terms of angle changes ∆ɵ and ∆V, scaled by 1 / ∆. Thus, the predictor
step size is given by
1 / ║Tp║ (4)
Where ║.║ stands for tangent vector norm. Thus, the steeper the curve, the smaller will be the predictor step. It makes the method take bigger steps when the system is away from the bifurcation point, and smaller steps as the bifurcation is approached. The actual operating point is obtained by the help of the corrector stage, which is obtained from inclusion of an extra equation. This equation comes from the fact that the predictor and corrector vectors are orthogonal. If the predictor step is given as an initial guess for a power-flow program at the corrector point, the algorithm converges rapidly to a feasible operating point. Using the CPF, it is possible to solve the problem. So that attain to the maximum loading point due to voltage collapse. More important, however, that it is possible to determine the Jacobian matrix at this operating point. The Jacobian matrix will be most useful tool for purposes of selecting the locations where additions and changes of the system from the perspective of market power should take place. The CPF method implemented in a predictor step is realized by the computation of the tangent vector and a corrector step that can be obtained either by means of a local parameterization or a perpendicular intersection.
(A) Predictor Step
At a generic equilibrium point, we have the following relation:
Then
= 0 = g + (6)
And the tangent vector can be approximated by
Tp = ≈ ∆
∆ (7)
From the above equations,
Tp = - g (8)
Fig.2. Predictor Step
At this point, a step size control k has to be chosen for determining the increment ∆y and ∆ , along with a normalization to avoid large step when ║Tp║ is large
∆ =
║ ║ (9)
∆y =
║ ║ (10)
Where k = ±1, and its sign determines the increase or the decrease of . Fig. 2 presents a pictorial representation of the predictor step.
(B) Corrector Step
In the corrector step, a set of n + 1 equations is solved.
g(y,) = 0 (11) (y,) = 0 (12) Where the solution of must be in the bifurcation manifold and is an additional equation to guarantee a non singular set at the bifurcation point. For the choice of, there are two options: the perpendicular intersection and the local parameterization. In the case of perpendicular intersection, whose pictorial representation is illustrated in Fig.3, the expression of becomes
(y,) = ∆∆y
−( + ∆y )
−( + ∆ ) = 0 (13)
Fig.3 Corrector Step
(y,) = y −(y + ∆y ) (14) (y,) = −( + ∆ ) (15) The choice of the variable to be fixed depends on the bifurcation manifold of g.
V. PLACEMENT ALGORITHM
For placement of DG units, it is necessary to define objective function to solving this problem. According to structure of proposed placement algorithm the objective function should be selected for reducing of power losses, increasing of power transfer capacity and maximum loading, or increasing of voltage stability margin in the system [10]. So, for this purpose, the precise active power losses reduction as an objective function has been selected. In this method the place of installation DG units in the distribution network was implemented based on execution of an iteration algorithm. This algorithm is based on determination of buses that are the most sensitive to voltage collapse. For this purpose, we used continuation power-flow program. By execution of this program most sensitive bus to voltage collapse or maximum loading were determined. After determination of sensitive bus, one DG unit or even compensator with certain capacity can be installed on that bus [11-12]. After installation of the DG unit, the power-flow program was executed and then the objective function calculated. If the estimation of objective function was inappropriate, then this algorithm would iterate. Namely with execution of the CPF in the system where the DG unit was installed, most sensitive bus to voltage collapse or maximum loading was determined again. This algorithm will be continued until the objective function is estimated. If the objective function is estimated, this iterative algorithm will stop. The flow chart of the proposed placement algorithm may be given as shown in fig.4.
IV. EFFECT OF PLACEMENT OF DG UNITS
Power Losses: For calculation of accurate active power losses reduction (PLR) by DG units, we have the following relation
PLR = . 100% (16) Power Transfer Capacity: The power transfer capacity of transmission network by using of DG units can be defined as follows:
PTC = . 100% (17) Where
P = P + P (18)
P = P − P (19)
P = P − P (20) and
P is total active power of the slack bus
P is total active power of the slack bus with DG units
P is total active power losses of the distribution lines
P is total active power losses with DG units
P is total active power of the loads
P is total active power of the generation units
P is total active power of the generation units with DG units.
Voltage Stability Margin: The voltage stability margin (VSM) has the following relation VSM =
.100% (21)
Where is the base loading parameter for low limit operating voltage and is the maximum loading of the system. The overall impact of DG units on voltage stability is positive. This is due to the active power injected by distributed generators. So, the improved voltage profiles as well as decreased reactive power losses.
V. EFFECTS OF REACTIVE POWER AND POWER FACTOR ON PV-CURVES
The extended analysis of the loading parameter is as follows. For different substitutions of DG units, preferably reactive DG units the corresponding PV-curves are obtained. PV-curves are also affected by power factor. The dependency of PV-curves on the aforementioned parameters can be obtained from the following equations.
The dependency of PV-curves on reactive power is related with the equation
(V2+Q)2+P2= V2 (22)
The dependency of PV-curves on power factor is related with the equation
V4+ V2(2PTanφ-1)+ P2Sec2φ=0 (23)
Where P,Q,V and φ are the real power, reactive power, voltage and power factor angle respectively.
VI. RESULT AND DISCUSSION
IEEE 33-bus test radial distribution system with a total load of 3.7 MW and 2.3 MVAr [7]. Based on the proposed methodology, an analytical software tool has been developed in MATLAB environment to run the load flow, calculate power losses, and identify the optimal size and location of single and multiple DG units.
(B) Assumptions
The assumptions for this paper are as follows:
Fig. 5 IEEE 34-Bus radial distribution network
(A) VOLTAGE PROFILE
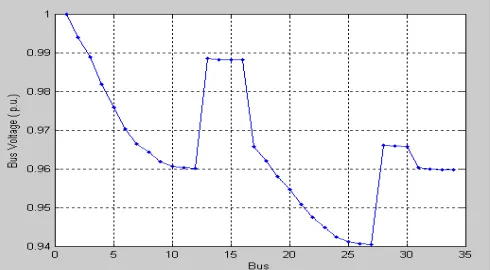
The radial distribution load flow program is executed on the considered 34-bus test system and the voltage profiles for corresponding placement of DG units are plotted. The graphs are plotted for each iteration i.e., for every placement of DG unit.
Fig.6 Base case voltage profile (without DG unit) Fig.7 Voltage profile with one DG unit
Fig.8 Voltage profile with two DG units Fig.9 Voltage profile with three DG units
(B) POWER FACTOR
The placement of DG unit will cause considerable change in power factor. The power factor at each bus is improved and the corresponding values of power factor for different placements of DG units are shown below.
Fig.10 Base case Power factor profile (Without DG units) Fig.11Power factor Profile with one DG unit
Fig.12 Power factor Profile with two DG units Fig.13 Power factor Profile with three DG units From fig.10 shows power factor profile without DG, power factor profile with one DG, two DG and three DG as shown in fig.11, fig.12 and fig.13.
(C) LOADING PARAMETER DEPENDENCY
On reactive DG unit
Fig.14 PV-curve for Q=0 Fig.15 PV-curve for Q=0.05 p.u
Fig.16 PV-curve for Q=0.1 p.u Fig.17 PV-curve for Q=0.2 p.u
On Power Factor
Fig.18 PV-Curve with base case Fig.19 PV-Curve For pf angle=30 deg
Fig.20 PV-Curve For pf angle=20 deg Fig.21 PV-Curve For pf angle=10 deg
Table.1 Comparison of electrical parameters
Test System Number of DG Units Bus_DG Unit DG Capacity (MW) Power Loss (kW)
PLR (%) PTC (%) λMax
(p.u)
VSM (%)
Normal State
0 - 0 221.20 - - 1.04 42.30
Iteration-1 1 26 0.2 113.03 48.9 4.45 1.1 45.45 Iteration-2 2 26-33 0.3 87.82 60.3 5.49 1.2 50.00 Iteration-3 3 26-33-17 0.4 66.20 70.07 6.38 1.36 55.88
From Table.1 represents the effect of execution of this method on power losses, power transfer capacity, maximum loading and voltage stability margin. By execution of this method, the total active power losses were reduced to 66.20 kW i.e reduced by 70.07% and power transfer capacity was increased to 6.38%. However, maximum loading and voltage stability margin of the system were increased about 1.36 and 55.88%, respectively. Note that in this case, DG units have the same capacity and ability to produce 0.2 MW active and 0.01 MW reactive powers. It can be seen that after three iterations of placement algorithm, voltage profile for all buses is close to one. Hence the optimal placement of DG units is of greater concern in distributed generation.
VI.CONCLUSION
In this paper, a method for placement of DG units in distribution network was presented. The results of execution of this method on a typical 34-bus test system clarified the robustness of this method in optimal and fast placement of DG units. The results showed efficiency of this method for improvement of voltage profile, reduction of power losses and also an increase in power transfer capacity, maximum loading and voltage stability margin. The power factor analysis was also carried out and results proved that power factor was improved with the installation of DG units in the network. The dependency of PV curves on DG capacity and power factor was determined and the corresponding plots are obtained which illustrated the positive effect of DG units on the system with regard to stability, loss minimization and enhancement in the loading capability of the line.
REFERENCES
[1] N. S. RAU and Y. H. WAN, Optimum location of resources in distributed planning,‖ Power System, IEEE Trans., vol. 9, pp. 2014–2020, November 1994.
[3] P. H. S. W. L. K. M. Reza, J. G. Slootweg and L. vander, Investigating impacts of distributed generation on transmission system stability, Power System, IEEE PowerTech., June 2003.
[4] V. Ajjarapu and C. Christy, The continuation power flow: A tool for steady state voltage stability analysis, IEEE Trans. Power Syst., vol. 7, pp. 416–423, February 1992.
[5] K. S. S. H. D. Chiang, A. Flueck and N. Balu, Cpflow: A practical tool for tracing power system steady-state stationary behavior due to load and generation variations,‖ IEEE Trans. Circuits Syst., vol. 10, pp. 623–634, May 1995.
[6] S. A. N. Hasan Hedayati and A. Akbarimajd, -A method for placement of dg units in distribution networks,‖ IEEE Trans. on Power Delivery, vol. 23, July 2008.
[7] M. A. Kashem, V. Ganapathy, G. B. Jasmon, and M. I. Buhari, “A novel method for loss minimization in distribution networks,” in Proc. IEEE Int. Conf. Elect.Utility Deregulation Restruct. Power Technol., ,pp. 251–256, 2000.
[8] C.A. Cãnizares, “Applications of optimization to voltage collapse analysis,” in Proc. IEEE Power Eng. Soc. Summer Meeting, San Diego,
CA, Jul.1998.
[9] I.A. Hiskens and Y.V. Makarov, “Calculation of power system critical loading conditions,” in Proc.Electrical Engineering Congr., Sydney, Australia, pp.185–189, Nov.1994.
[10] C.A. Cãnizares and S. Hranilovic, “Transcritical and HOPF bifurcations in ac/dc systems,” in Proc. Bulk Power Syst. Voltage Phenomena Voltage Stability Security, , pp.105114, Aug.1994.
[11] Hasan Hedayati, S. A. Nabaviniaki, and Adel Akbarimajd, “A Method for Placement of DG Units in Distribution Networks” IEEE Trans. Power Del. vol.23, no.3, pp.1620–1628, July.2008.