Automated Screening System for Acute
Leukemia Detection and Type Classification
Anu Jacob1, Flower Abraham Mundackal2
PG Student [SP], Dept. of ECE, College of Engineering Poonjar, Kottayam, Kerala, India1
Assistant Professor, Dept. of ECE, College of Engineering Poonjar, Kottayam, Kerala, India2
ABSTRACT: Leukemia or white blood cancer is considered as one of the major cause to human death. It is malignant if untreated. The need for automation of leukemia detection arises since the current methods involve manual examination of blood smear which is time consuming and its accuracy depends on operator’s ability and fatigue level. In this paper, an efficient technique that automatically detects leukemic cells and its type in blood microscopic image is implemented. Therefore, good clinical decision support tool for acute leukemia type classification has always become necessity. The system uses 110 microscopic blood images and the proposed frame work managed to obtain 96.67% accuracy for the localization of the leukemic cells for the first classifier.
KEYWORDS: Acute Leukemia, Classification, Feature Extraction, Segmentation.
I.INTRODUCTION
White blood cells (WBCs) play a major role in the diagnosis of different diseases; as a result, extracting information about them is valuable for hematologists [1]. The term leukemia comes from the Greek word ‘leukos’ meaning white and aim meaning blood. Diagnosing leukemia is based on the fact that white cell count in peripheral blood is increased with immature blast cells [28]. Therefore, hematologists examine blood smear under microscope for proper identification and classification of blast cells [29]. The presence of the excess number of blast cells in peripheral blood is a important symptom of leukemia. Leukemia is mainly classified as: Acute leukemia which progresses quickly and chronic leukemia which progresses slowly [11]. The four main sub-types of leukemia are Acute Myelogenous Leukemia, Acute Lymphoblastic Leukemia, Chronic Myeloid Leukemia, and Chronic Lymphocytic Leukemia [1]. The disease is confirmed when the marrow contains more than 30% blasts.
Acute leukemia is a fast-growing blood cancer. It is malignant if left untreated, due to its rapid spread into the blood and other main organs [2]. Early diagnosis is fundamental for the recovery of patients, particularly in the case of children. Thus, despite of advanced techniques such as cytometer, immunophenotyping, molecular probing etc, microscopic observation of blood slides still used as the standard leukemia diagnosis technique [1]. This analysis is time consuming and it presents not a standardized accuracy since it depends on operator’s capabilities and tiredness. Diagnostic misunderstanding is also posed due to imitation of similar signs by other diseases. Also, blood microscopic images can be more easily transmitted to clinical centres than liquid blood samples. So there is a need for a cost effective and robust automated classifier system for leukemia screening which can greatly improve the output without being in influenced by operator tiredness.
II.LITERATURE SURVEY
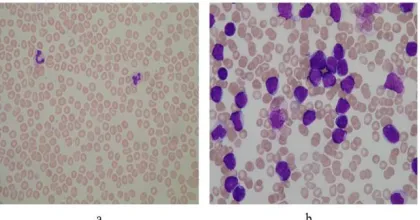
Fig. 1 Image from Database. (a) Healthy Cells, (b)Cancerous Cells.
Moreover, it is difficult to obtain a consistent result from visual inspection. Visual inspection also can only give qualitative results for further research. Studies show that most of the recent techniques use all information about blood, for example number of red blood cells, hemoglobin level, hematocrit level, mean volume corpuscle and many more as the parameter for identifying diseases such as thalassaemia, cancer etc. In order to know all information about blood, costly testing and equipments of labs are required. Automatic image processing system is urgently needed and can overcome related constraints in visual inspection.
Many attempts have been made in the past to construct systems that aid in acute leukemia segmentation and classification [1]–[10]. Many segmentation algorithms were presented in literature, including [2], [3], and [4], where Otsu segmentation and automated histogram thresholding were employed to segment WBCs from the blood smear image. The work in [33] employed contour signature to identify the irregularities in the nucleus boundary. The work in [8] employed selective filtering to segment leukocytes from the other blood components. The work in [34] employed hue, saturation, and value (where hue represents color, saturation indicates the range of gray in the color space, and value is the brightness of the color and varies with color saturation), color space, and expectation–maximization algorithm (which consists of two steps, i.e., expectation and maximization steps) to identify the cytoplasm and nucleus of the WBCs. A watershed segmentation algorithm to segment nucleus from the surrounding cytoplasm of cervical cancer images was proposed by Nallaperumal and Krishnaveni [8].
A main disadvantage observed in all these systems is that these classify only sub-images with single nucleus. The goal of this work is to implement a fully automated classifier system for Acute Leukemia. Most of the existing systems, work on sub-images where only one nucleus per image is considered and hence the features are being extracted only for those sub-images instead of whole images. Our aim is to overcome this and also increase the overall accuracy of the classifier system. The proposed system attempts to acts as an efficient ancillary to the physicians in decision-making.
III.METHODOLOGY
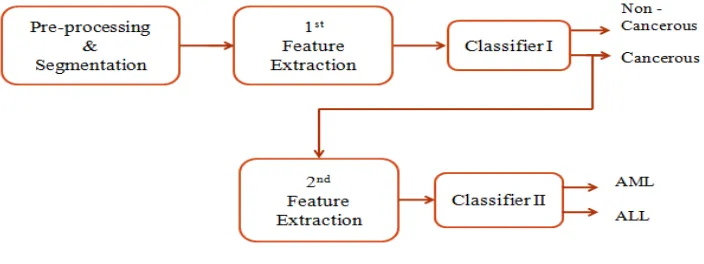
Fig. 2 System Overview
Image Acquisition
For AML, the online image bank of American Society of Hematology (ASH) is accessed [15]. The ASH image bank is a web based online image library that a wide range of hematology varieties. For ALL the ALL_IDIB1 [32] image database is accessed. The database for ALL comprised 110 images (55 from AML patients and 55 from non-AML patients) and that for AML comprised of 40 images. The resolution used for classification was 250 X 250 pixels.
Pre processing
The images are usually in RGB color space which is generated by digital microscopes, which is difficult to segment. In practice, the blood cells and image background differs greatly with respect to color and intensity. This can be caused by different reasons such as camera settings, varying illumination, and aging stain. In order to make the cell segmentation robust with respect to these abnormalities, an adaptive strategy is used: the RGB input image is converted into the CIELAB or, more correctly, the CIELab color space points.
Nuclei Segmentation
Image segmentation can be defined as the process of partitioning a digital image into multiple segments. Otherwise it is the process of assigning a label to every pixel in an image such that pixels with the same label share certain properties. Many algorithms for segmentation have been developed for gray-level images [20]. Segmentation in this system is performed for extracting the nuclei of the input microscopic images using color-based clustering. Cluster analysis is the formal inspection of methods and algorithms for clustering according to measured aspects. Cluster analysis does not use category labels that tag objects with class labels. k-means, which is one of the most popular exclusive of learning algorithms and also a simple clustering algorithm, was first published in 1955. K-means algorithm is still widely used. It is composed of following steps:
1. Place K points randomly (initial cluster centers).
2. Assign each pixel in image to cluster that minimizes the distance between pixel and cluster center. 3. Recalculate the cluster center, when all objects have been assigned,
4. Repeat Steps 2 and 3 until the cluster centers no longer move
.
In this paper, clusters are picked corresponding to nucleus with high saturation, background having high luminance and low saturation, and other cells. Here, every pixel is assigned to one of these classes using the properties of the cluster centre
.
Feature Extraction
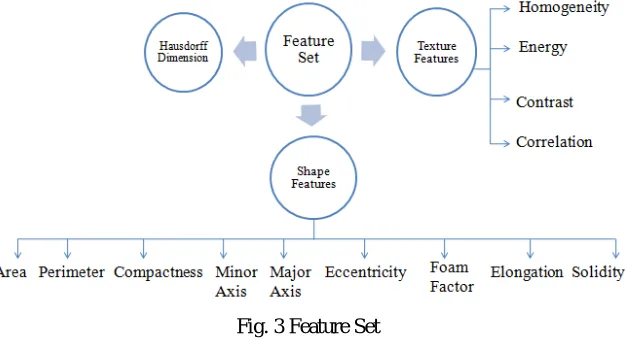
these features on whole images. Those features were considered to lift the classifier performance. Fig. 3 gives the set of features chosen to classify the image database.
Fig. 3 Feature Set
Hausdorff Dimension
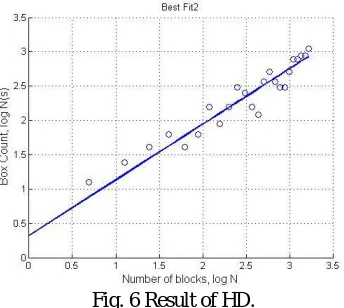
Fractals have been used in medicine and science in the past for different quantitative measurements [13]. The fractal dimension D is a statistical quantity that gives an idea of how completely a fractal appears to fill space. There are several specific definitions of fractal dimension. The most relevant theoretical fractal dimensions are the Rnyi dimension, the Hausdorff Dimension (HD), and the packing dimension. Practically, the box-counting dimension is generally used, partly due to their ease of operation.
In a box counting algorithm, the number of boxes covering the point set is a power-law function of the box size [31]. Fractal dimension is estimated as the exponent of such power law. All fractal dimensions are real numbers that characterize the fractalness ie., texture/roughness of the objects. Myeloblast can be characterized using perimeter roughness of the nucleus. HD is considered as an important feature in this work. The procedure for measuring HD using the box counting method is elaborated below as an algorithm:
1. Binary image is obtained from the gray-level image of the blood sample; 2. Edge detection technique is employed to trace out the nucleus boundaries; 3. Edges are superimposed by a grid of squares;
4. The HD may then be defined as follows:
log( )
log( ( ))
R
HD
R s
where R is the number of squares in the superimposed grid, and R(s) is the number of occupied squares or boxes (box count). Higher HD signifies higher degree of roughness.
Local Binary Pattern
The concept of local binary pattern (LBP) [17],[18] was introduced for texture classification. In the LBP method, where each pixel is restored by a binary pattern that is derived from the pixels neighbourhood. If the center point P is larger than the current neighbourhood sample point I, the result is a binary zero; otherwise, the result is a binary one (see Figure 4).
For the database of images used in this work, an (8, 1) circular neighborhood was used. The segmented images were obtained using k-means clustering, and then the LBP operator was applied on them before calculating the HD. Two sets of values were calculated: first, HD of the 110 images without applying LBP, and second, HD of the images after applying LBP. When considering these two data sets, it was observed that the LBP operator enhanced the overall performance by a very high margin.
Shape Features
According to hematologists, the shape of the nucleus is an important feature for discrimination of myeloblasts [3],[4]. Region- and boundary-based shape features are extracted for shape analysis of the nucleus. All the features are extracted from the binary-equivalent image of the nucleus where the nucleus region is represented by the nonzero pixels [6].
GLCM Features
Texture can be defined as the function of spatial variation in the pixel intensities. The GLCM [27] and associated texture feature calculations are image analysis techniques. Gray-level pixel distribution can be described by second-order statistics such as the probability of two pixels having particular gray levels at particular spatial relationships.
SVM Classifier
The selection of a classification technique for classification is a challenging problem. It is because an appropriate choice given the available data can significantly help improving the accuracy in credit scoring practice. There is a variety of statistical techniques, which aim at performing binary classification tasks. In this work support vector machine (SVM) is used for constructing a decision surface in the feature space that separates the two categories, i.e., cancerous and noncancerous, and maximizes the margin of separation between two classes of points. SVM is a promising nonlinear nonparametric classification technique, which already showed good results in the medical diagnostics, optical character recognition, and other fields [22],[24]. Moreover, the SVM is a powerful algorithm with strong theoretical foundations based on the Vapnik Chervonenkis theory and with strong regularization properties. Much of the initial success of SVMs was attributed to the so-called kernel trick wherein training data are implicitly mapped to a high-dimensional feature space, and a margin maximizing linear classifier is learned in this mapped space [24]. An SVM is primarily a class classifier. It can be either linear or nonlinear. In this work, a linear SVM two-class two-classifier is used; because it is not computationally expensive, it does not employ the kernel trick explicitly, and it achieves, in general, a good performance [22].
IV. RESULT AND DISCUSSION
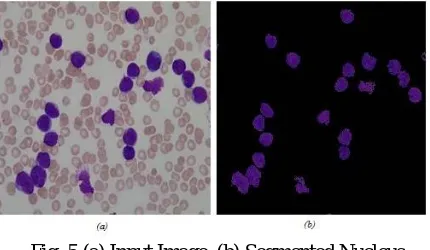
Microscopic blood image of size 250Χ250 is considered for evaluation. The input image is processed sequentially and the nuclei is segmented from the input image after applying K-means clustering algorithm which is shown in fig 5.
Fig. 5 (a) Input Image, (b) Segmented Nucleus
Fig. 6 Result of HD.
In order to ensure the effectiveness of the system, certain measures were employed based on which decisions were made. Precision, Specificity, Sensitivity and F-Measure are all decided in relation to the possible outcomes of the classifier system. The experimental values obtained for the above measures are summarized in Table 1.
Table. 1 Performance Evaluation Statistics
Parameter Formulae
Sensitivity 0.956
Specificity 0.978
Precision 0.977
F-Measure 0.966
Feature extraction with and without the LBP operator shows very interesting results. However the performance of HD, after using LBP increased the classifier performance by 11.9%. By employing LBP, the edges of the nuclei were extracted in a very clear cut manner. This effective edge detection enhanced the HD, as the box count for AML was much more than the box count for non-AML images. To ensure the effect of HD in the feature set, the classifier was run with HD as the only feature. This was done twice, once with applying LBP operator and once without LBP operator.
All the parameters for evaluation were extracted for both sets. It was observed that, when LBP was not employed, the HD performance was only around 84.44%, whereas when LBP was employed, the percentage increased to 94.44%. This clearly shows the influence of the LBP operator on the system. This result is illustrated in fig 7. Moreover the system achieves an overall accuracy of 96.67% and thereby providing an effective and reliable source of classification of acute leukemia.
V. CONCLUSION
In this experiment, GLCM and fractal features are extracted from image database to discriminate between normal and abnormal cell images while 5 geometrical features from only the abnormal cell images are extracted in order to discriminate between AML and ALL leukemia type.The main advantage of this work over existing schemes is that, the developed system effectively classifies the complete blood smear images of AML containing multiple nuclei, while existing systems mostly consider only those images which have one cell under the field of view. The presented system performs automated processing, including color correlation, segmentation of the nucleated cells, and effective classification. A feature set using the shape, color, and texture parameters of a cell is designed to obtain all the information required to perform efficient classification. Future work will focus on collection of more samples to yield better performance and building an overall system for cancer classification.
REFERENCES
[1] S. Agaian, “Automated Screening System for Acute Myelogenous Leukemia Detection in Blood Microscopic Images,” IEEE System Journal.
[2] F. Scotti, “Automatic morphological analysis for acute leukemia identification in peripheral blood microscope images,” inProc. CIMSA, 2005,pp. 96101. [3] G. Ongun,et.al, “Feature extraction and classification of blood cells for an automated differential blood count system,” in Proc. IJCNN, 2001, vol. 4,pp.
24612466.
[4] S. Mohapatra and D. Patra, “Automated leukemia detection using Hausdorff dimension in blood microscopic images,” in Proc. Int. Conf. Emerg.Trends Robot Commun. Technol., 2010, pp. 6468.
[5] F. Scotti, “Robust segmentation and measurement techniques of white cells in blood microscope images,” in Proc. IEEE Conf. Instrum. Meas.Technol., 2006, pp. 4348.
[6] S. Mohapatra,et.al, “Fuzzy based blood image segmentation for automated leukemia detection,” in Proc.ICDeCom, 2011, pp. 15.
[7] S. Mohapatra, D. Patra, and S. Satpathi, “Image analysis of blood microscopic images for acute leukemia detection,” in Proc. IECR, 2010, pp. 215219. [8] S. Mohapatra, D. Patra, and S. Satpathi, “Automated cell nucleus segmentation and acute leukemia detection in blood microscopic images,” in Proc.
ICSMB, 2010, pp. 4954.
[9] Sensitivity and Specificity. [Online]. Available:http://en.wikipedia.org/wiki/Sensitivity and specificity.
[10] V. Piuri and F. Scotti, “Morphological classification of blood leucocytes by microscope images,” in Proc. CIMSA, 2004, pp. 103108. [11] MedlinePlus: Leukemia.National Institutes of Health. [Online]. Available: http://www.nlm.nih.gov/medlineplus/ency/article/001299.htm
[12] S. Serbouti, A. Duhamel, H. Harms, U. Gunzer, J. Mary, and R. Beuscart, “Image segmentation and classification methods to detect leukemias,” in Proc. Int. Conf. IEEE Eng. Med. Biol. Soc., 1991, pp. 260261.
[13] T. Milne, “Measuring the fractal geometry of landscapes,” Appl. Math. Comput., vol. 27, no. 1, pp. 6779, Jul. 1988.
[14] K. Panetta, S. Agaian, S. Nercessian, and A. Almunstashri, “Shapedependent canny edge detector,”Opt. Eng., vol. 50, no. 8, pp. 087008-1 087008-12, Aug. 2011.
[15] ASH Image Bank: American Society of Hematology. [Online]. Available: http://imagebank.hematology.org/Default.aspx.
[16] E. Wharton, K. Panetta, and S. Agaian, “Logarithmic edge detection with applications,”J. Comput., vol. 3, no. 9, pp. 1119, Sep. 2008.
[17] D. Ilea and P. Whelan, “Image segmentation based on the integration of colour-texture descriptorsA review,” Pattern Recognit., vol. 44, no. 10/11, pp. 24792501, Oct./Nov. 2011.
[18] H. Inaba, M. Greaves, and C. Mullighan, “Acute lymphoblastic leukaemia,” Lancet, vol. 381, no. 9881, pp. 19431955, Jun. 2013.
[19] O. Lahdenoja, “Local binary pattern feature vector extraction with CNN,” in Proc. 9th Int. Workshop Cellular Neural Netw. Appl., 2005, pp. 202205. [20] Acute Myeloid Leukemia, National Cancer Institute, Bethesda, MD, USA, 2006.
[21] F. Sadeghian, Z. Seman, A. Ramli, B. Kahar, and M. Saripan, “A framework for white blood cell segmentation in microscopic blood images using digital image processing,” Biol. Procedures Online, vol. 11, no. 1, pp. 196206, Jun. 2009.
[22] A. Agarwal, O. Chapelle, M. Dudik, and J. Langford, A reliable effective terascale linear learning system, arXiv:1110.4198, 2011, preprint, Cornell University Library.
[23] R. D. Labati, V. Piuri, and F. Scotti, “ALL-IDB: The acute lymphoblastic leukemia image database for image processing,” in Proc. IEEE ICIP, Brussels, Belgium, Sep. 1114, 2 011, pp. 20452048.
[24] C. Reta, L. Altamirano, J. A. Gonzalez, R. Diaz, and J. S. Guichard, “Segmentation of bone marrow cell images for morphological classification of acute leukemia,” in Proc. 23rd FLAIRS, 2010, pp. 8691.
[25] J. Hu, J. Deng, and M. Sui, “Color space conversion model from CMYK to LAB based on prism,” in Proc. IEEE GRC, 2009, pp. 235238. [26] A. Jain, Data clustering: 50 years beyond K-means, Pattern Recognit. Lett.,vol. 31, no. 8, pp. 651666, Jun. 2010.
[27] S. Agaian and A. Almuntashri, “A new edge detection algorithm in image processing based on LIP-ratio approach,” in Proc. SPIE, Feb. 8, 2010, vol. 7532, pp. 753204-1753204-12.
[28] C. Haworth, A. Hepplestone, P. Jones, R. Campbell, D. Evans, and M. Palmer, “Routine bone marrow examination in the management of acute lymphoblastic leukaemia of childhood,” J. Clin. Pathol., vol. 34, no. 5, pp. 483485, May 1981.
[29] Hunter Labs. Hunter lab color scale, Hunter Associates Lab., Reston, VA, USA, Insight on Color 8 9 (August 115, 1996). [Online]. Available: http://www.hunterlab.com/appnotes/an0896a.pdf
[30] A. Nasir, M. Mashor, and H. Rosline, “Unsupervised colour segmentation of white blood cell for Acute leukaemia images,” in Proc. IEEE IST, 2011, pp. 142145.
[31] Monica Madhukar, Sos Agaian, and Anthony T.Chronopoulos, “Deterministic Model for Acute Myelogenous Leukemia Classification” 2012 IEEE International Conference on Systems, Man, and Cybernetics.
[32] R.D.Labati, V.Piuri, and F.Scotti, “ALL-IDB: The Acute Lymphoblastic Leukemia Image Database for Image Processing,” 18th IEEE International Conference on Image Processing, pp. 2045 – 2048, 2011.
[33] [5] S. Mohapatra, “Image Analysis of Blood Microscopic Images for Acute Leukemia Detection” in Proc. IECR, 2010,
pp. 215–219.