10.15662/ijareeie.2014.0310038
Graph Theoretic Approach to Solve
Measurement Placement Problem for Power
System State Estimation
Rakesh J Motiyani
1, Ajitsinh R Chudasama
2Associate Professor, Dept. of EE, S N P I T & R C, Bardoli, Surat, Gujarat, India1
Director, Neotech Technical Campus, Virod, Vadodara, Gujarat, India2
ABSTRACT:The meter placement problem involves selection of meters, number, type and place. This paper describes graph theoretic approach to solve the measurement placement problem for power system state estimation. The measurement configuration is designed for IEEE 14 bus system. Utilizing the proposed measurement system configuration the network observability is tested for P-δ and Q-V models by triangular factorization of the gain matrix. The designed metering scheme assures network observability and accomplishes better accuracy and bad data processing requirements for state estimator. The developed method can be used as measurement systems planning tool for power system state estimators.
KEYWORDS: Bad data detection, Meter placement, Network observability, Remote terminal unit, State estimation.
I.INTRODUCTION
Within the energy management system, state estimation is a key function for building network real time model that is static mathematical representation of current condition of an interconnected power system [7]. State estimation is a standard practice at power system control centres, responsible for providing reliable real-time database for analysis, control and optimization functions. The state of electrical power system is defined by the vector of voltage magnitude and angle at all network buses. The static state estimator is the data processing algorithm for converting redundant and not so reliable meter readings and other available information about the network connectivity in to an estimate of the static state vector [1].
The real-time modeling of a power network usually follows following procedure involving [7]:
Data gathering
Network topology processing
Observability analysis
State estimation (SE)
Processing of bad data and
Identification of network model
measurement. If the power system network is observable, state estimation may proceed. Otherwise, additional measurements are required to be added. Hence, an observability test should be executed prior to performing the state estimation. The network observability can be tested for P-δ and Q-V models by triangular factorization of the gain matrix. The obsevability algorithm checks that the information available in the form of measurements is sufficient to fulfil the computational needs of state estimator or not [16].
Power system state estimators requires a set of redundant measurements, which are appropriately chosen according to the type, number and location of the measurement points in the supervised electric network [6]. The main objective in designing metering scheme is to satisfy the requirements like Cost, Accuracy, Reliability, and Bad Data Processing for power system state estimator [5]. In late 90’s, researchers started giving importance to the development of cost effective and reliable metering scheme which can yield accurate state estimation. The measurement data are usually power flows, power injections and bus voltages [12]. In 1996, a meter placement method developed by Mesut E Baran et al. The main objective of authors in designing a metering scheme was to satisfy cost, accuracy, reliability and bad data processing requirements. The developed method was utilized for designing the measurement system configuration on IEEE 14 bus system [5].
The measurement placement method using Simulated Annealing aims at attending to the requirements such as observability and reliability- taking in to account the associated monetary costs was developed by Alessandra B Antonio et al. in 2001. The developed method was utilized for designing the measurement system configuration on IEEE 30 bus system [6]. In 2006, the optimal meter placement method using hybrid Genetic Algorithm and Simulated Annealing (GA/SA) for solving optimal measurement placement was developed by Thawatch Kerdchuen et al. [33]. The metering configuration for 10-bus and IEEE 14 bus system was presented and P-δ observable concept was used to check the network observability.
The state estimation is a mathematical procedure by which the state of electric power system is extracted from a set of measurement. In standard SE, in order to relate measurements and non linear equations, the following model is used:
x
e
h
z
Where, z is the (m×1) measurement vector, h(x) is the (m ×1) vector of non linear functions, x is the (2n ×1) state vector, e is the (m×1) measurement error vector, n is the total number of buses in the power system network and m is the total number of measurements.The state estimator is a mathematical algorithm formulated to minimize the error between a real time measurement and a calculated value of the measurement. The minimization criterion often selected is the weighted sum of error squares of all the measurements. The estimator favors accurate measurements over the less accurate ones by weighing the errors with the measurement standard deviation (σj) [12].
21 min
m j j j σ e x JThe condition for optimality is obtained at a point when the gradient of J(x) is zero. From weighted least square method, the iterative equation can be obtained as follows:
Where,
Ns m m m Ns Ns x x h x x h x x h x x h x x h x x h x x h x x h x x h x x h H 2 1 2 2 2 1 2 1 2 1 1 1Where, Ns = 2n-1
Δx
x
x
k1
k
k T T
x
h
z
R
H
H
R
H
10.15662/ijareeie.2014.0310038
H
R
H
G
T 1
For the n bus system, considering one of the bus as a reference, n-1 angles and n voltage magnitudes are to be calculated. The state estimation Jacobian (H) always has 2n-1 columns and large number of rows based on number of measurements
made. The gain matrix is defined as
While the power system not only has SCADA, but also has Phasor Measurement Units (PMUs) placement, the sub problem is formed by PMU placement and SCADA measurements [32]. The state variables measured by PMU are assumed true value and the known state variables are x1. The unknown state variables are required to be
estimated by reduced power system state estimation model.
II.PROPOSED METHOD OF MEASUREMENT PLACEMENT
The meter placement problem involves selection of meters (number, type and place) [5], [6]. The main objective in designing a metering scheme is to satisfy the following requirements.
1. Cost: The total investment cost for the metering scheme should be kept to minimum. This involves the cost of meters, Remote Terminal Units (RTUs) and communication system.
2. Accuracy: The Measurements obtained through metering scheme should yield the state variables with desired accuracy.
3. Reliability: Power system network should be observable and there should be enough redundancy so that state estimation can be carried out even after loss of measurements or meter failure.
4. Bad data processing: Measurement system should allow state estimator to detect and eliminate bad data from the available set of measurement.
Proposed measurement placement method is based on network graph theory. The metering scheme assures that each branch of power system network is incidental by power injection or flow measurements at either ends or a flow measurement and an injection measurement at one of its terminal node. Selection of meter locations also assures least requisite of RTUs. For observability, the presence or absence of the flow is of importance and not the numerical value of the flow. If a branch that neither has a flow measurement on it nor an injection measurement at one of its terminal nodes, that branch does not come into the matrix H and thus it does not play any role either in observability analysis or in state estimation.
The proposed method gives the greatest priority to power injection measurement at the buses of maximum adjacency to reduce the meter requirements for network observability. The redundancy can be considered as a function of the accuracy requirement in the state estimation. Always measuring quantities should be more than the necessary minimum number to make provision for eliminating erroneous quantities from the measurement set to ensure accurate state of the power system. Hence, at the second stage, branches consisting power injection measurement at one of it terminal node are identified and power flows are measured through such branches to increase redundancy. Further, to enhance redundancy, voltages at all additional RTU locations are measured.
The meter placement method proceeds as follows:
Read bus data, initialize measurement set of interest by injection measurements at all the zero injection buses in the power system network.
2 2
2
1
1 1
1
2 1
m
σ σ
σ
R W
is incident to j bus and aij =0, if otherwise. Modify adjacency matrix by making all aii =0, as these elements of
matrix represent the bus itself.
Compute total ones of each row of modified adjacency matrix. Identify buses of maximum (p) and minimum (q) adjacency. Place RTU and measure power injections at the buses of adjacency p, p-1, p-2 ……., till p, p-1, p-2 ……., = q+2.
Identify branches contain no power injection measurement at one of its end, place RTU and measure injection at any end. Add power injection measurements at the buses of q+1 adjacency and voltage measurements at all RTU locations till redundancy becomes ≥ 1.
Update line data file by removing all the lines comprising of injection measurements at both ends. Measure power flows through the remnant lines such that minimum requisite of additional RTUs. Measure voltages at additional RTU locations.
III.MEASUREMENT CONFIGURATION ON IEEE14 BUS SYSTEM
Adjacency matrix for IEEE 14 bus system is shown below.
1 2 3 4 5 6 7 8 9 10 11 12 13 14 Ones
1 1 1 2
2 1 1 1 1 4
3 1 1 2
4 1 1 1 1 1 5
5 1 1 1 1 4
6 1 1 1 1 4
A= 7 1 1 1 3
8 1 1
9 1 1 1 1 4
10 1 1 2
11 1 1 2
12 1 1 2
13 1 1 1 3
14 1 1 2
At the first stage, interesting measuring quantities are; Power injections at buses 2, 4, 5, 6, 7, 9, 10, 12, 13, 14 Voltage magnitudes at buses 2, 4, 5, 6, 9, 10, 12, 13, 14 RTUs locations 2, 4, 5, 6, 9, 10, 12, 13, 14
Updated line data file after removing all the lines comprises injection measurements at both ends is shown below.
Bus nl
Bus nr
R p.u.
X p.u.
1/2 B p.u.
1 2 0.01938 0.05917 0.0264
1 5 0.05403 0.22304 0.0246
2 3 0.04699 0.19797 0.0219
10.15662/ijareeie.2014.0310038
6 11 0.09498 0.1989 0
7 8 0 0.17615 0
10 11 0.08205 0.19207 0
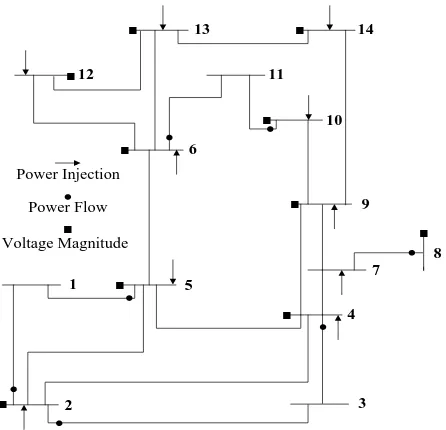
■ Existing RTU Locations ■ Additional RTU
At the second stage following measurements are added in the metering scheme:
Power flows on branch (2→1), (5→1), (2→3), (4→3), (6→11), (8→7), (10→11) Voltage Magnitude at bus number 8.
Fig 1 shows the proposed measurement configurations on IEEE 14 bus system. Out of 122 possible measurements metering scheme utilizes 44 measurements & redundancy becomes 1.63.
2
1 5
4
3 7
8 9
6
10 11 12
13 14
Power Injection Power Flow
■
■ ■
■
■ ■
■ ■
■
■
Voltage Magnitude ■
Fig. 1 Meter placement on IEEE 14 bus system using proposed method
The metering scheme consists: 10 RTUs, 10 power injections, 10 voltage magnitudes and 7 power flows.
IV. TEST RESULTS AND COMPARISON
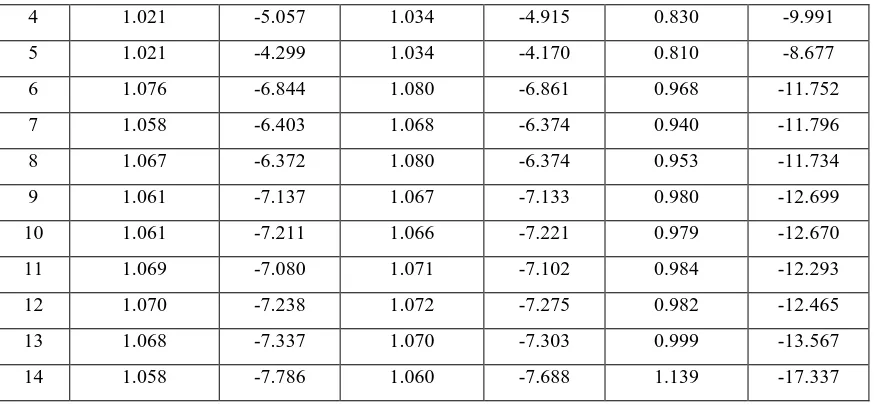
Estimated state obtained by utilizing the proposed metering scheme, hybrid GA/SA and the metering scheme of Mesut E Baran et al. is shown in the table 1 below.
Bus No.
--- Estimated State ---
Proposed Metering Scheme Mesut E Baran et al. Hybrid GA/SA
Voltage Magnitude |V|
pu
Bus Angle δ (Degree)
Voltage Magnitude |V|
pu
Bus Angle δ (Degree)
Voltage Magnitude |V|
pu
Bus Angle δ (Degree)
1 1.040 0.000 1.060 0.000 0.754 0.000
2 1.028 -2.368 1.045 -2.286 0.713 -4.182
5 1.021 -4.299 1.034 -4.170 0.810 -8.677
6 1.076 -6.844 1.080 -6.861 0.968 -11.752
7 1.058 -6.403 1.068 -6.374 0.940 -11.796
8 1.067 -6.372 1.080 -6.374 0.953 -11.734
9 1.061 -7.137 1.067 -7.133 0.980 -12.699
10 1.061 -7.211 1.066 -7.221 0.979 -12.670
11 1.069 -7.080 1.071 -7.102 0.984 -12.293
12 1.070 -7.238 1.072 -7.275 0.982 -12.465
13 1.068 -7.337 1.070 -7.303 0.999 -13.567
14 1.058 -7.786 1.060 -7.688 1.139 -17.337
Table: 1 Estimated State Using Different Measurement System Configuration: IEEE14 Bus System
Fig 2 shows errors in estimated voltage magnitudes computed with the use of different measurement system configurations.
-0.2 -0.1 0 0.1 0.2 0.3 0.4
1 2 3 4 5 6 7 8 9 10 11 12 13 14
Bus Number
Vo
lt
ag
e
Er
ro
r
(p
u)
Proposed Method Mesut E Baran et al. Hybrid GA/SA
Fig. 2 Voltage Magnitude Errors: IEEE14 Bus System
Fig 3 shows errors in estimated bus angles computed with the use of different measurement system configurations.
-1 1 3 5 7 9
1 2 3 4 5 6 7 8 9 10 11 12 13 14
Bus Number
B
us
A
ng
le
E
rr
or
(D
eg
re
e)
Proposed Method Mesut E Baran et al. Hybrid GA/SA
10.15662/ijareeie.2014.0310038
V.CONCLUSION
Using the simulations developed herein, the state variables are estimated with the use of proposed measurement system configuration. Estimated state variables are compared with estimations obtained through the metering schemes of Mesut E Baran et al. and Hybrid GA/SA.
The proposed measurement system configuration accomplishes better bad data processing and observability requirements for state estimator compared with the metering scheme obtained through the hybrid GA/SA. Also, the proposed measurement configurations yields much accurate state of power system than the metering schemes of Mesut E Baran et al. and hybrid GA/SA. Moreover, the proposed method acquires cost effective measurement system configurations compared with Mesut E Baran et al. When SCADA measurements are combined with PMU, the direct measurement of state variables with enough accuracy will be available through PMU data. On the modified power system network excluding PMU buses, the proposed measurement placement method can be utilized to configure SCADA measurements and state variables can be estimated using reduced state estimation model. The developed method of measurement placement can also be implemented in the existing state estimators as an off- line measurement systems planning tool.
REFERENCES
[1] Fred C. Schweppe and J. Wildes , “Power System Static State Estimation part І: Exact Model”, IEEE Transaction on Power Apparatus and System, Vol. 89, pp. 120-125, 1970.
[2] E. Handschin, F.C Schweppe, J. Kohlas, A. Fiechter , “Bad Data Analysis for Power System State Estimation”, IEEE Transaction on Power Apparatus and System, Vol. PAS-94, pp. 329-337, 1975.
[3] W. Hubbi and Y. Wang, “Effects of the Weighting Matrix on Power System State Estimation”, Electric Power Systems Research, Vol. 22, pp. 35-39, 1991.
[4] A. Monticelli, Felix F.Wu, “Network Observability: Theory”, IEEE Transaction on Power Apparatus and System, Vol. 104, pp. 1035-41, 1985.
[5] Mesut E. Baran, Jinxiang Zhu, Hongbo Zhu, Kenneth E. Garren, “A Meter Placement Method for State Estimation”, IEEE Transaction Power Systems, Vol. 10, pp. 1704-1710, 1995.
[6] Alessandra, B. A., Jose, R. A. and Milton, B. D., “Meter Placement for Power System State Estimation Using Simulated Annealing”, IEEE Porto Power Tech Conference., Porto, Portugal, 2001.
[7] A. Monticelli, “Electrical Power System State Estimation”, Proceeding of IEEE, Vol. 88, pp. 262-282, 2000.
[8] C. Madtharad, S. Premrudeepreechacharn, N. R. Watson and D. Saenrak, “Measurement Placement Method for Power System State Estimation: Part I”. IEEE Power Engineering Society General Meeting Conference, pp. 1629-1632, 2003.
[9] M. Yehia, R. Jabr, I. El-Bitar, R. Waked, “A PC Based State Estimator Interfaced with a Remote Terminal Unit Placement Algorithm”, IEEE Transaction on Power Systems, Vol. 16, pp. 210-215, 2001.
[10] G. N. Korres, “A Partitioned State Estimator for External Network Modeling”, IEEE Transaction on Power Systems, Vol. 17, pp. 834-842, 2002.
[11] C. Rakpenthai, S. Premrudeepreechacharn, S. Uatrongjit and N. R. Watson, “Measurement Placement for Power System State Estimation by Decomposition Technique”, IEEE 11th International Conference on Harmonic and Quality of Power, pp. 414-417, 2004.
[12] A. Shafiu, N. Jenkins and G. Strbac, “Measurement Location for State Estimation of Distribution Generation Network with Generation”, IEEE Proceeding Vol. 152, pp. 240-246, 2005.
[13] Carlo Muscas, Fabrizio Pilo, “Optimal Placement of Measurement Devices in Electric Distribution Systems”, IMTC 2006 – Instrumentation and Measurement Technology Conference Sorrento, Italy, pp.1873-78, 2006.
[14] Amany El-Zonkoly, “Optimal Meter Placement Using Genetic Algorithm to Maintain Network Observability”, Expert Systems with Applications, Vol. 31, pp. 193-198, 2006.
[15] Hongga Zhao, “A New State Estimation Model of Utilizing PMU Measurements”, IEEE International Conference on Power System Technology, pp. 1-5, 2006
[16] Sandhya Sankar, Noel N. Schulz, “Intelligent Placement of Meters/Sensors for Shipboard Power System Analysis”, IEEE proceeding, 2007. [17] Gamm A. Z, Grishin Y. A, Kolosok I. N, Glazunova A. M and Korkina E. S., “New EPS State Estimation Algorithms Based on the Technique
of Test Equations and PMU Measurements”, IEEE Power Tech Conference, Lausanne, Switzerland, July 1-5, pp.1670-75, 2007.
[18] Chakrabarti S, Kyriakides E, Tianshu B, Deyu C. and Vladimir T., “Measurements Get Together”, IEEE Power & Energy Magazine, Vol. 7 pp. 41-49, 2009.
[19] Kenarangui R. and Tabatabayee N. M., “Online Electric Power Systems State Estimation Using Kalman Filtering”, Journal of Engineering Islamic Republic of Iran, Vol. 8, pp. 233-235, 1995
[20] M.K Celik and W-H. E Liu, “An Incremental Measurement Placement Algorithm for State Estimation”, IEEE Transaction on Power Systems, Vol. 10 pp 1698-1703, 1995.
[21] T.L Baldwin, L. Mili, M.B. Boisen, and R. Adapa, “Power System Observability with Minimal Phasor Measurement Placement”, IEEE Transaction on Power Systems, Vol. 8, pp 707-715, 1993.
[22] R.O.J. Burnett, M.M. Butts, and P.S. Sterlina, “Power System Applications foe Phasor Measurement Units”, IEEE Transaction on Computer Application in Power, Vol. 7, pp. 8-13, 1994.
[25] S. Maheshwarapu, “An Effective Root Based Algorithm for Power System Topological Observability”, IEEE Region 10th International
Conference on Global Connectivity in Energy, Computer, Communication and Control, TENCON, Vol. 2, pp: 596-600, 1998.
[26] A. Abur, F.H. Magnano, “Optimal Meter Placement for Maintaining Observability during Single Branch Outages”, IEEE Transactions on Power Systems, Vol. 14, pp. 1273-1278, 1999.
[27] F.H. Magnago, A. Abur, “A Unified Approach to Robust Meter Placement against Loss of Measurements and Branch Outages”, IEEE Transactions on Power System, Vol. 15, pp. 945-949, 2000.
[28] A. Abur, F. H. Magnago, “Optimal Meter Placement against Contingencies”, IEEE Power Engineering Society Summer Meeting, Vol. 1, pp. 424-428, 2001.
[29] H. Mori, Y. Sone, “Tabu Search Based Meter Placement for Topological Observability in Power System State Estimation”, IEEE Transmission and Distribution Conference, Vol. 1, pp. 172-177, 1999.
[30] H. Mori, M. A. Saito, “Hybrid Approach of Parallel Tabu Search and Ordinal Optimization to Meter Placement for Improving Topological Observability”, International Conference on Power System Technology, Vol. 1, pp. 963-968, 2004.
[31] A. Abur, A. G. Exposito, “Power System State Estimation, Theory and Implementation”, New York: Marcel Dekker, pp. 59-98, 2004. [32] Fang C, Xueshan H, Zhiyuan P and Li H, “State Estimation Model and Algorithm Including PMU”, IEEE Electric Utility Deregulation and
Restructuring and Power Technologies Conference, Nanging, China, pp. 1097-1102, 2008.
[33] Thawatch Kerdchuen, Weerakorn Ongsakul, “Optimal Measurement Placement for Power System State Estimation Using Hybrid Genetic Algorithm and Simulated Annealing”, International Conference on Power System Technology, pp. 1-5, 2006.
[34] G. N. Korres, P. J. Katsikas, K. A.Clements and Paul W. Davis, “Numerical Observability Analysis Based on Network Graph Theory”, IEEE Transaction on Power Systems, Vol. 18, pp. 1035-1045, 2003.