Energy saving in some office buildings in equatorial area
of cameroon.
Modeste Kameni Nematchoua1 *, René Tchinda2, Gh.R. Roshan3, Paola Ricciardi4
1
Environmental Energy Technologies Laboratory, University of Yaounde I, Cameroon b 2
LISIE, University Institute of Technology Fotso Victor, University of Dschang, Cameroon 3
Department of Geography, Golestan University, Gorgan, Iran , 4
Department of Civil Engineering and Architecture - University of Pavia, Via Ferrata 1, 27100 Pavia, Italy, phone
Abstract
The warming of the earth requires a demand in energy for cooling in the buildings. In this paper, demand of energy (heating/ cooling) during two seasons in the buildings is discussed in yaounde , Cameroon. A passive method to assess the energy consumed in various types of building have been used. Objective answers of occupants concerning the energy consumption have been gotten thanks to a questionnaire. Obtained results show that the old buildings are moderate and comfortable during the two seasons than new buildings. Charcoal is more used in Old building and Electricity in new building. For the temperatures varied from 22.1 to 29.8°C , the average of cooling energy obtained is 0.89kwh/m2 per year in building studied.
1. Introduction
Passive methods are an interesting design parameter that let to improve indoor ambiences by means of an adequate understanding of building physic processes. In particular, great developments were done in last years to define building thermal processes but its hygroscopic effects have not been defined clearly. In this sense, different international research projects of the International Energy Agency have tried to define these effects and to develop building design guides based on this concept[1-3] .The most important objective of a building is to provide its inhabitants with a comfortable indoor climate in the respect of energy efficiency[4] .Energy efficiency of public buildings becomes a key factor affecting the economic and environmental development in entire world. The access to shapes of modern energy brings advantages for the human well-being and the economic development. The indoor air almost contains more concentration of steam than the outdoor air which can immigrate on wall with the risk of the condensation and damages on the wall [5-7].This effect greatly contributes to the energy consumption in buildings. Energy consumption increased as the population growth[8] . There are more and more various buildings model in big towns in Sub Saharan Africa. In these buildings, we noticed increasing energy consumption with a high peak registered at intense working hours both in household and place of work. This energy
consumption can be due the time and the type of the architecture[8]. Energy peak consumption has rarely been taken into account in field studies [9]. Permeable coverings have been demonstrated to be an effective solution as a passive control method for indoor air conditions, consequently, are an energy saving technique [10] . Many works have been carried out concerning the saving energy consumption in the offices and habitats. Shuqin Chen et al.[11] have showed that the number of air conditioners and their usage contribute little to energy use due to the cool climate . Geoffrey and Kelvin[12] have studied domestic energy structure in China. Yoshino et al.[13] have simulated energy consumption in residential use by software. Lam et al.[14] have found that the air conditioners, lighting and refrigerators are three main consumers of electricity use. Jiang and Yang[15], have showed that in 2004 in China, building energy consumption alone constituted 20.7% national energy consumption and this will be increased to 33% by 2010. Farshid et al. [16] proved that among all the sectors, buildings have the greatest quota, which is about 40% of all the energy consumption in Iran. In fact, residential and non-residential buildings in Iran consumed total energy equal to 581.2TWh,in 2004. Argyro[17],.found that the increase of energy consumption was associated with the increase of health symptoms in the buildings studied. Yulan Yang et al. [18], have showed , a method of identifying and weighting indicators for assessing the energy efficiency of
residential buildings in China. In Cameroon , for now , no work has been again made to value energy consumption in these types of buildings. . The methodology used in this research is described in detail in the survey of Orosa[10] .
2. Materials and methods 2.1. Buildings description
In present research work 15 office buildings were sampled and classified in accordance with its building construction materials. In this sense, two main groups of buildings were obtained and called new and old buildings, as we can see in table 1. These new and old buildings are recognized due to
the employ parpen or earth brick layers in walls, respectively.
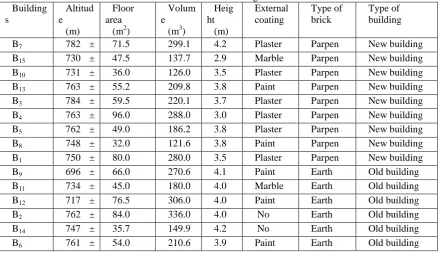
Within these two main groups we can find subgroups in accordance with the type of external coating employed, as we can see in figure 1. For example, external coating can be plaster, marble or paint. Due to it is not clear yet which of these materials are the main responsible of indoor ambience conditions, different test of indoor ambiences must be done to determine the main parameters that influence indoor ambiences and its consequences in thermal comfort, perception of
indoor air quality and energy consumption. Figure 1. Example of Old building.
Table 1. Some characteristic of offices studied in the buildings. Building
s
Altitud e
(m)
Floor area
(m2)
Volum e
(m3)
Heig ht
(m)
External coating
Type of brick
Type of building
B7 782 ± 71.5 299.1 4.2 Plaster Parpen New building
B15 730 ± 47.5 137.7 2.9 Marble Parpen New building
B10 731 ± 36.0 126.0 3.5 Plaster Parpen New building
B13 763 ± 55.2 209.8 3.8 Paint Parpen New building
B3 784 ± 59.5 220.1 3.7 Plaster Parpen New building
B4 763 ±
4
96.0 288.0 3.0 Plaster Parpen New building
B5 762 ±
8
49.0 186.2 3.8 Plaster Parpen New building
B8 748 ± 32.0 121.6 3.8 Paint Parpen New building
B1 750 ±
8
80.0 280.0 3.5 Plaster Parpen New building
B9 696 ± 66.0 270.6 4.1 Paint Earth Old building
B11 734 ± 45.0 180.0 4.0 Marble Earth Old building
B12 717 ±
3
76.5 306.0 4.0 Paint Earth Old building
B2 762 ± 84.0 336.0 4.0 No
l
Earth Old building
B14 747 ±
4
35.7 149.9 4.2 No
l
Earth Old building
B6 761 ±
3
54.0 210.6 3.9 Paint Earth Old building
2.2. Sampling period
In present research work, a sampling process with frequencies of 10–20 minutes was carried out during the working hours from 08:00 to 17:00, and during the unoccupied period from 17:30 to 22:00, in each season.
Despite the fact that most of times it is indoor air temperature the main variable that defines an indoor ambience, in present research work indoor relative humidity was sampled and analyzed in depth due to it is expected to be the more differentiate variable. It is due to there is not a clear thermal insulation difference between new and old buildings but it is expected a different hygroscopic wall behaviour.
2.3. Energy consumption
To quantify the real energy consumption in air conditioning during the dry and rainy seasons in the different building, a methodology
of [19] was used. This method is based on Eq. (1), which expresses the energy consumption required to maintain indoor environment within comfort conditions. This equation depends on the ventilation mass flow rate, the increment or decrease of indoor air enthalpy required in terms of the desired indoor conditions, as shown in Eq. (2), and the period of time during which this difference exists.
(1)
Where: Δh=hindoor -hdesired (2)
hindoor is the indoor enthalpy and hdesired is the desired indoor enthalpy.
The comfort temperature is defined according to the formula established in [19], depending on the outdoor climate. The formula below, allowing calculating the comfort temperature was tested and
validated by many researchers in the Sub Saharan area to establish the range comfort of their various place of study. Ideal conditions required to cold and eat buildings can then be defined according to equation:
Tc=0.534.To+11.9 (3)
Where Tc is the indoor comfort temperature and To is the monthly mean outdoor temperature at the appropriate period of the year. This data (To) can be obtained from climatic conditions.
To analyze effects of structure of buildings on peaks of energy consumption, the average and hours difference of the partial steam pressure for each type of building were calculated.
2.4. Groups of buildings
An initial analysis of One Way ANOVA showed, taking relative humidity as main control variable, two main groups of indoor ambiences for a significance level of 0.05 in agreement of wall construction materials expected effect, as we can see in table 2. From this table we can conclude that indoor ambiences in new buildings showed the same behavior and that this is clearly different to the old ones for a significance level of 0.05. On the other hand, the old buildings were not too much far away from the significance limit fixed for this study. In consequence, these old buildings showed certain tendencies to similar ambiences and being clearly different to the new ones. Despite this, old buildings are not a statistical group.
Table 2. Buildings with the same relative humidity behaviour.
Building Group of new buildings Group of old buildings B7
B10 64.8684
B3 65.4737
B5 66.5000
B8 67.9474
B1 68.3632
B4 68.9421
B13 68.9474
B15
B6 72.7053
B2 72.7368
B14 73.4421
B12 73.7368
B9 73.9263
B11 74.4947
Significance level 0.050 0.975
2.5. Real sampled data
To analyze the effect of wall construction materials over indoor ambiences the instantaneous comparison of indoor and outdoor partial vapor pressure difference for different wall construction materials was done, as we can see in figures 2 to 3. The reason why partial vapor pressure difference was considered as the comparative parameter is due to it was the better variable in previous research works in other climatic regions that considers dry bulb temperature and relative humidity.
3. Results and Analyze 3.1. Indoor air
3.1.1. Partial vapor pressure difference in buildings
From an average study we can conclude that indoor air relative humidity is 5% higher in old buildings than in new ones during the dry season. At the same time, the average indoor air temperature in the new buildings is 1 ºC higher than in the old one. From this relationship, in accordance with Simonson studies [14-17], we can say that this is an isenthalpic process of the same indoor ambience. If we analyze the thermal comfort consequences of these variations we can say that, as a consequence of this higher relative humidity, a higher acceptability of indoor ambiences of the old buildings was obtained during the dry season and the worst acceptability was obtained during the rainy season
.
Figure 2. Partial vapor pressure difference in new buildings with plaster and marble coatings.
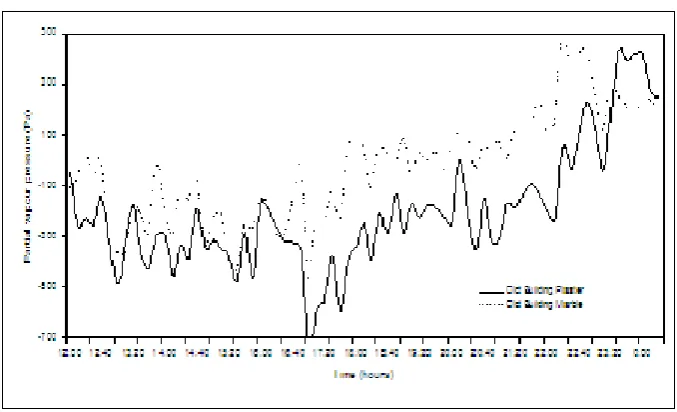
Figure 3. Partial vapor pressure difference in old buildings with plaster and marble coatings .
Once the average behavior was defined, it is the time to define if this effects and statistical results are related with external coatings (marble or plaster for example) or with wall construction materials (earth or parpen) and its hourly evolutions. We can see that during the early working hours of the day the effectiveness of a building wall construction materials over indoor air relative humidity are clear. Thus, we can see that the more impermeable external coating implies a higher indoor air relative humidity during the dry season and, consequently, a better indoor air perception.
This is the case of the old buildings using marble as external coating (B11). During the rainy season, this same building experiences a higher relative humidity and reaches the worst indoor air acceptability of all the buildings (–0.2).
At the same time, in new buildings (B15), this kind of external coating implies, during the dry
season, an increment of indoor air relative humidity and indoor air acceptability when they are compared with other external coatings like paint and, in particular, with plaster (B7 and B10). Consequently, the worst percentage of dissatisfied persons is during the rainy season (70%), in a similar way as it happens with the building B11 (60%) under these same conditions, as a clear example of benefits of marble used as external coating in this climatic region. Finally, there does not seem to be too much of a difference in indoor ambience behaviour between plaster and paint coatings.
3.1.2. Objective evaluation on indoor thermal environment
In the figures 4 and 5, we have the objective evaluation on indoor thermal environment in rainy
and dry seasons. In rainy season , the Daytime(figure4a),12.5% of occupants have voted environment “ hot” , in the New building. No one have voted the same in the Old building. On the other hand, 34.5% have voted “ a little hot” in New building , alone 1.1% of occupants have voted the same in old building. 60.8% of inhabitants have voted environment “ moderate “ in old building , versus 28.1% in new building.17% of occupants have voted “ a little cool “ in New building versus 22.5% in Old building. Finally, 15.5% and 8.2% of inhabitants have voted “ very cool”, respectively in Old and New building. The same season, to Night (figure 4b), for the temperature varied between 17.5°C and 25.8°C(SD=0.88), 29.5 and 3.5% of occupants have voted environment : “ a little hot” and “ hot” in New building. No one have voted the same thermal sensation in Old building. 58.5% of inhabitants have voted for them environment “ moderate “ in Old building versus 44% in New building. Finally, 24% and 10% of residents have voted “Very cool” in Old and New buildings. In Dry season, during the Daytime , for the outdoor
temperature varied from 21.5°C to 35.1°C(SD=1.4) and outdoor relative humidity ranged from 45.6 to 79%(SD=2.1),(see figure 5a), 70.5% of residents have voted environment “ hot “ in New building, only 3.6% of inhabitants have voted the same in Old building.25.5% and 33.4% of occupants have voted “ a little hot “ in New and Old building. 55.5% and 7.5% have voted respectively for them environment : “ moderate “ and “ a little cool “ , in old building, alone 4% of occupants have voted “ moderate “ , in New building. Finally no one have voted “ a little cool” and “very cool” , in New building. In the same season, during tonight (figure 5b), for the temperature ranged from 19.5°C to 27.8°C(SD=0.97), 53.5, 15.5% and 3.2% of residents have voted respectively for them environment “ a little hot”, “moderate” and “ a little cool” , in new building. In the old building, 51.5% and 26.5% of residents have voted “ a little cool” and “ moderate “ . No one have voted “ hot” and “Very cool” , respectively in Old and New building.
Figure4a. Evaluation on indoor thermal environment in rainy season(Daytime).
Figure4b. Evaluation on indoor thermal environment in rainy season(Night).
0 10 20 30 40 50 60 70
hot a little hot moderate a little cool very cool
Per
cen
ta
ge o
f v
ot
es
Daytime
New Building
0 10 20 30 40 50 60 70
hot a little hot moderate a little cool very cool
Per
cen
ta
ge o
f v
ot
es
Night
New Building
Figure5a. Evaluation on indoor thermal environment in Dry season(Daytime).
Figure5b. Evaluation on indoor thermal environment in Dry season(Night).
3.2 . The possession and utilization of main energy consuming appliances
The distribution of subjective responses in relation to energy expenditure in the classes is given in Figure 6. From this figure, 2.2% of occupants have voted “ Very satisfied “ in Old building, no one has voted the same in the New building.In natural ventilation, 50.8% of occupants in Old building have voted “ satisfied “ for their habitat versus 1.1% in New building. For these who have voted “dissatisfied “, 29.5% were in Old building and 64.5% in New building.Finally, 17.5% of habitants have voted “ Very dissatisfied” , in old building, alone 13.5% of occupants have voted the same in New building. Figure7, gives
the distribution of subjective response on different types of energy consumed in the buildings. It was observed that 70% and 1.5% of inhabitants have voted “Coal “ like Energy consumption in Old and New building. 44.5% of occupant have voted “Electricity “ in New building, only 12.5% of occupants have voted the same in Old building.2.5% and 23.5% of inhabitants have voted “Natural gas” respectively in Old and New building.On the other hand , 18.5% of occupants have voted “Renewable Energy “ in New building. In the Old building, alone 0.5% of inhabitants have voted the same. Figure 8 gives Energy-saving actions in the buildings. 45% of occupants have voted “ Use space heating/cooling appliances as 0
10 20 30 40 50 60 70 80
hot a little hot moderate a little cool very cool
Per
cen
ta
ge o
f v
ot
es
Daytime
New Building
0 10 20 30 40 50 60
hot a little hot moderate a little cool very cool
Per
cen
ta
ge o
f v
ot
es
Night
New Building
little as possible” I the New building. No one has voted the same in the old building. 55% and 11%
have voted “ Use Energy efficiency appliance” in Old and New building.
Figure6. The objective estimation about energy expenditure in Old and New building.
Figure7. Distribution of subjective response on different types of energy consumed in the Old and New building.
Figure8. Energy-saving actions in the Old and New building.
3.3. Energy consumption analyses
0 10 20 30 40 50 60 70
Per
cen
ta
ge o
f v
ot
es
Energy expenditure
Old Building
0 10 20 30 40 50 60 70 80
Coal Petroleum
products Natural gas Electricity RenewableEnergy
Per
cen
ta
ge o
f v
ot
es
Energy consumed
Old Building
0 10 20 30 40 50 60
Per
cen
ta
ge o
f v
ot
es
Energy saving
Old Building
Figures 9&10 give energy consumption per year for cooling in dry season and for heating in rainy season in the different buildings studied .In dry season, for the temperatures varied from 22.1 to 29.8°C (SD=1.89), with an average of 25.98°C, the average of cooling energy obtained is 0.89kwh/m2 per year in building (SD=0.92). Cooling energy demand varied according to type of building .An average of 0.57kw/m2 per year is obtained in old buildings and 1.21kwh/m2 in new buildings, this show that the cooling energy demand is than two time more increase in new buildings than in old buildings . New building physically well built is
less comfortable than old buildings . In rainy season, for the temperature varied from 18.2 to 25.9°C(SD=0.87) , with an average of 21.81°C(see fig.10), the average of heating energy obtained is 0.77kwh/m2 per year in building at (SD=0.54). An analyze of these results show that the cooling energy demand is more high in the buildings that heating energy demand . This forte cooling energy demand in building can explain action of climate change on indoor air quality with the warming of earth[20-22] .
Figure9. Average indoor air temperature and energy consumption for cooling indoor air up to an enthalpy of 71.5 kJ/kg during occupation periods, for the buildings under analysis (fromB1 to B15).
Figure 10. Average indoor air temperature and energy consumption for heating indoor air up to an enthalpy of -68.5 kJ/kg during occupation periods, for the buildings under analysis (fromB1 to B15).
4. Discussion
Partial vapor pressure explain the real action of indoor climate on the Energy consumption in buildings. The Partial vapor pressure difference obtained varied from -700 to 500pa, in the different standards of building.These results are agreement with the values found by Orosa [24]. Overview in
rainy season,59.8% of inhabitants have voted environment “moderate “ in Old building versus 36% in new building.And the other hand,8% have voted “ hot” in new building , but no one in old building.20% and 6% of the occupants have voted “Very cool”, respectively in Old and new buildings during the same season. Whereas in dry season, the
indoor climate conditions are very disagreeable. 41%, 27% and 1.8% of residents have voted respectively “ moderate”, “a little hot” and “hot “ in Old building. In new building, 10%, 40% and 50% of inhabitants have voted the same during the same season. 29.8% of occupants have voted a little cool in old building , versus 1.5% in new building. An analyzed of these results shows that the old building are moderate and comfortable during the two seasons than new buildings. These old buildings have often the same characteristics than the traditional building. Consequently, these results are in agreement with those found recently by kameni et al.[25] and Dili et al.[26]. Coal is more used in Old building and Electricity in new building. In spite of it , 30% of occupants were dissatisfied about energy expenditure in old building, versus 67% in new building. There are signs who suggest that climate change has affected of natural systems and human. Warming of the climate system is unequivocal. Energy consumption varied according to season and structure of building, hygroscopic materials are able to reduce indoor humidity and, consequently, reduce indoor enthalpy. Decreasing the enthalpy of indoor air, decreases the energy required to cool the building and also improves indoor air quality[32] .These different values of energy found are in agreement with the results in[27-30], these cooling and heating energy demands are slow and very slow when we must compare results with other countries. For example, in Spain, mean energy consumption in offices with different internal coverings varied from 0.25 to 2.4kwh/m2[32] , in USA the average energy used in office buildings is 293 kWh/m2 per year [31]. A law has been enacted by the Cameroonian government on the preliminary study of climate prior to implantation of the buildings. Yet this law lack to be applied by building's designers .The government policy concerning the utilization of renewable energies is not very well definite. It was showed that the energy consumption increased progressively in these buildings this phenomenon was associated with the increase of health symptoms for these buildings.
5. Conclusions
In this work, it was showed a clear difference between new and old buildings with plaster coatings during the occupation period. In particular, it was obtained a better indoor ambience during occupation in the old buildings. At the same time, when the marble and plaster coating in this old buildings was analyzed a clear difference in indoor ambience behaviour was obtained during the office opening. The old building are moderate and comfortable during the two seasons than the new building. Charcoal is more used in the old
building nevertheless Electricity is used in new building to solve the problem of heating and cooling. Globally, cooling and heating energy demand is very weak in the building in Cameroon, compared to building in spain and USA. The increasing trend of temperature would have the potential to augment cooling energy demand . A study covering all regions of Cameroon will be able to orient the population about the heating country and the increasing cooling energy demand in buildings.
5. References
[1] Orosa, J.A., Oliveira, A.C., Ramos, N.M.M. Experimental quantification of the operative time of a passive HVAC system using porous covering materials. Journal of Porous Media. 13, 7, pp. 637-643, 2010.
[2] Orosa, J.A., Oliveira, A.C. Sick Building Syndrome in Libraries and other Public Buildings. Chapter: Passive methods as a solution for the sick building syndrome in public buildings. Springer. 2011.
[3] Orosa, J.A., Oliveira, A.C. A field study on building inertia and its effects on indoor thermal environment. Renewable Energy. Volume 37, Issue 1, 2012, 89–96.
[4] Orosa, J.A. and A. C. Oliveira. Passive methods as a solution for improving indoor environments. Springer, 2011. DOI 10.1007/978-3-642-17919-8.
[5] JF. Karlsson, B. Moshfegh, A comprehensive investigation of a low-energy building in Sweden. Renewable Energy 2007;32:1830– 41.
[6] S. Hameury, Moisture buffering capacity of heavy timber structures directly exposed to an indoor climate: a numerical study. Building and Environment 2005;10:1400–12.
[7] CJ. Simonson, MH. Salonvaara ,Mass transfer between indoor air and porous building materials. Part I: experimental facility and material property data. International Journal of Heat and Mass Transfer 2007;50:4527–39.
[8] M. Kameni , R. Tchinda , N. Donatien B. Mempouo, Jose A. Orosa. Assessment of The Energy Consumption With Passive Climate Control Methods in Cameroon Buildings,.ijetae,733-742, Vol. 4, 2014.
[9] H.B. Rijal, P. Tuohy, M.A. Humphreys, J.F. Nicol, A. Samuel, J. Clarke, Using results from field surveys to predict the effect of open windows on thermal comfort and energy use in buildings, Energy and Buildings 39 (2007) 823–836.
[10] JoséA.Orosa ArmandoC.Oliveira, Reducing energy peak consumption with passive climate control methods, EnergyandBuildings43(2011)2282–2288.
[11] Shuqin Chen, Hiroshi Yoshin, Nianping Li. Statist
ical analyses on summe r energ y consump tion characte ristics of residential buildings in some cities of China . Energy and Buildings 42 (2010) 136–146.
[12] K.F.T. Geoffrey, K.W.Y. Kelvin, A study of domestic energy usage patter ns in Hong Kong, Energy 28 (2003) 1671–1682.
[13] H. Yoshino, Y. Yoshino , Q.Y. Zhang, et al., Indoor thermal environment and energy saving for urban residential buildings in China, Energy and Building 38 (2006) 1308–1319.
[14] J.C. Lam, An analysis of residential sector energy use in Hong Kong, Energy 21 (1) (1996) 1–8.
[15] Ji ang, Y., Yang, X., 20 06. Ch ina building e nerg y consump tion situation a nd the pr ob lems existing in the energy conserv atio n wor ks. China Co nstruction 2, 12–17.
Johnson, D.E., 1998. Applied Multivariate Methods for Data Analysts. Duxbury, Belmont, Calif.
[16] Farshid Bagheri, Vahab Mokarizadeh , Mohsen Jabbar. Developing energy performance label for office buildings in Iran. Energy and Buildings 61 (2013) – 124
[17] Argyre L.,Marial L. Symptoms experienced, environmental factors and energy consumption in office buildings.Energy and building,24(1996)237-243.
[18] Yulan Yang, Baizhan Li, Runming Yao. A
method of identifying and weighting indicators of energy effi ciency assessment in Chinese residenti al buildings.Energy policy 38(2010)7687-7697.
A tttttArgyro Lagoudi a, Maria Loizidou b, Mat Santamouris a, Demosthenes Asimakopoulos rgyro [19] F. Olalekan, O.F. Osanyintola, C.J. Simonson, Moisture buffering capacity on hygroscopic building materials: experimental facilities and energy impact, Energy and Buildings 38 (2006) 1270–1282.
[20] Simonson C. J., Salonvaara M., Ojanen T. Improving Indoor Climate and Comfort with Wooden Structures. Technical research centre of Finland. Espoo 2001.
[21] Simonson CJ, Salonvaara M, Ojalen T. The effect of structures on indoor humidity—possibility to improve comfort and perceived air quality. Indoor Air 2002;12:243–51.
[22] Simonson CJ, Salonvaara MH. Mass transfer between indoor air and porous building materials. Part I: experimental facility and material property data. International Journal of Heat and Mass Transfer 2007;50:4527–39.
[23] Simonson CJ, Ojanen T. Moisture performance of building envelops with no plastic vapour retarder in cold climates. Proceedings of Healthy Buildings 2000;3.
L[24] José A. Orosa , Armando Oliveira.Reducing energy peak consumption with passive climate control methods. Energy and Buildings 43 (2011) 2282–2288
[25] Modeste Kameni Nematchoua, René Tchinda , José A. Orosa. Thermal comfort and energy consumption in modern versus traditional buildings in Cameroon: A questionnaire-based statistical study. Applied Energy 114 (2014) 687–699.
[26] A.S. Dili , M.A. Nasee, T . Zacharia Varghese. Thermal comfort study of Kerala traditional residential buildings based on questionnaire survey among occupants of traditional and modern buildings. Energy and Buildings 42 (2010) 2139–2150.
[27] H. Hens, Indoor climate in student rooms: measured values. IEA-EXCO Energy Conservation in Buildings and Community Systems Annex 41 ‘‘moist eng’’ Glas- gow meeting, 2004.
[28] Environmental Information System of Galicia 2007 (SIAM), SIAM. http:// www.Siam-cma.org/.
[29] L. Yang, J.C. Lam, C.L. Tsang, Energy performance of buildings envelopes in
different climate zone in China, Applied Energy 85 (2008) 800–817.
[30] M.H. Salonvaara, C.J. Simonson, Mass transfer between indoor air and a porous building envelope: part II validation and numerical studies, in: Proceedings of Healthy Buildings, 2003.
[31] L. Pe ´ rez-Lombard, J. Ortiz, C. Pout, A review on building energy consumption information, Energy and Buildings 40 (2008) 394–398.
[32] Orosa, J.A., Oliveira, A.C.Energy saving with passive climate control methods in Spanish office buildings,Energy and Buildings 41 (2009) 823–828.
, Maria Loizidou b, Mat Santamouris a, Demosthenes Asimakopoulos