Tomato Disease Detection using Image
Processing
Sagar Karmarkar
1, Gauri Jadhav
2, Mayuri Parkhe
3, Aditya Kadam
4, Himali Patel
5UG Student, Dept. of EXTC, Vivekanand Education Society’s Institute of Technology, Mumbai, Maharashtra, India1
UG Student, Dept. of EXTC, Vivekanand Education Society’s Institute of Technology, Mumbai, Maharashtra, India2
UG Student, Dept. of EXTC, Vivekanand Education Society’s Institute of Technology, Mumbai, Maharashtra, India3
UG Student, Dept. of EXTC, Vivekanand Education Society’s Institute of Technology, Mumbai, Maharashtra, India4
Asst. Professor, Dept. of EXTC, Vivekanand Education Society’s Institute of Technology, Mumbai, Maharashtra, India5
ABSTRACT: Accurate detection and identification of fruit diseases is important in controlling and preventing diseases for sustainable agriculture as well as for security of food. This paper discusses disease detection and classification of tomato fruit. Images will be captured and transferred to the laptop where image processing algorithms will be applied. Image processing based on python is used. The experimental result demonstrates that the proposed approach can closely detect tomato fruit diseases (i.e. Bacterial and fungi affected fruits) in Indian agriculture and classify the diseases with efficient speed.
KEYWORDS: Image processing, Raspberry pi 3B, Pi camera module, K-means clustering, HSV transformation, Jupyter notebook.
I. INTRODUCTION
Over 45% of the Indian population is involved in farming and thus agriculture forms the backbone of the Indian economy. Varieties of fruits, vegetables are exported out of the country and it is necessary to produce high quality products. Hence it is necessary to produce high quality products with an optimum yield. Tomato is an important crop in the Indian agriculture. In India, Orissa, Andhra Pradesh, Karnataka, Maharashtra, Bihar, West Bengal, Uttar Pradesh, Haryana, Punjab and Gujarat are the leading tomato cultivating states [1]. Tomato is almost a necessity in the Indian households. It is used for ketchups, puree, soups, etc and is primary in the Indian cuisine. Vitamin A and vitamin C are obtained from the tomato. However, the tomato plant suffers from many diseases, which may be air-borne or seed-borne. They are affected by fungus, bacteria and viruses. Thus, it is necessary that these diseases get detected at the right time so as to protect the precious crop and prevent the reduction in the yield. Large number of workers reported tomato diseases caused by fungus, bacteria and viruses [2].
Bacterial diseases: bacterial spot (Xanthomonas campestris pv. vesicatoria), bacterial canker (Clavibactermichiganensis sub sp. michiganensis),stem necrosis (P. marginalis, P. viridiflava) and bacterial speck (Pseudomonas syringaepv. tomato) [2].
Fungal diseases: Early blight (Alternaria solani), late blight (Phytophthora infestans), southern stem blight (Sclerotium rolfsii), septoria leaf spot (Septoria lycopersici),etc [2]
Viral diseases: Tomato mosaic (TMV), alfalfa mosaic (AMV), tomato leaf curl (TLCV), tomato spotted wilt (TSWV or Tospovirus), tomato bunch top virus (TBTV) [2].
II.SYMPTOMS
with a rough scabby surface [3]. The young tissues are more receptive to lesions than the old tissues. Symptoms on immature fruit are lesions, which begin as small, raised, black specks encircled by a water-soaked border, enlarging to become brown, slightly sunken, scabby spots, sometimes surrounded by a halo. This disease causes a reasonable reduction in the number, weight and quality of the fruits.
Fig1 Bacterial Spot
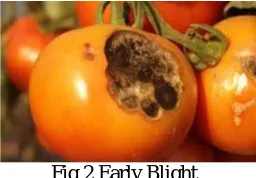
Early blight is caused by Alternaria Solani Fungi which infects the tomato (also infects potato, eggplant, capsicum) during any growth stage of the fruit. The fungi generally attack the fruit at the stem end that produce leathery black spots with raised concentric ridges. Warm, wet weather further speeds up the process of infection and causes the infected fruit to drop off from the plant. [4].
Fig 2 Early Blight
Farmer’s depend only on naked eye observation for detection of diseases. They also may be unaware of non-native diseases. It requires timely checking on the tomatoes and requires experts for detecting the diseases. It may also thus be time consuming as well as expensive. Thus, a conventional algorithm is developed for detection of the important crop.
III.PROPOSED METHODOLOGY
The detection of diseases is done through image processing techniques. The images of the plant are captured by a digital camera which is interfaced with the raspberry pi board. Various image processing techniques are applied on the acquired image to obtain the features for further analysis. This method of image processing involves a series of steps. They are:
Fig 3 Methodology Flowchart
Image
Acquisition Image Cropping
Image Segmentation
Conversion to HSV
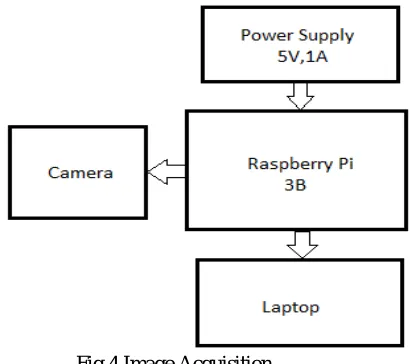
A. IMAGE ACQUISITION:
A Raspberry PI camera of 5MP is used to capture the images of the tomato fruit. The IP camera is interfaced to Raspberry Pi 3B model. The image gets displayed on the server side, which is a laptop in this case, where pre-processing techniques shall now be applied.
Fig 4 Image Acquisition
The Raspberry Pi 3 B module can be powered using a 5V, 1A USB supply and is connected to the laptop using Ethernet cable.
B. IMAGE CROPPING:
It is performed basically to clip the image.Theamount of cropping can be decided using human visual skills to distinguish between the fruit and eliminate the background leaves, stems, etc. as far as possible from the image. The python command used here is image.crop(left, upper, right, lower).The values are manually put in the command. Lesser the value, lesser cropping occurs in that direction. Similarly, greater the value more cropping takes place in that particular direction.Sofor an image captured such that more background is included in it, the co-ordinate values will be larger to get only the tomato fruit and the infected region.
C. IMAGE SEGMENTATION:
Clustering segregates a dataset into a specified number of groups. It is a one of the widely used methods.Inthis, data collection gets divided into a k group of data.K-means algorithm consists oftwo separate phases.Firstly, thek centroid is calculated after which it groups each element to the cluster that has closest centroid from the respective elements.Every cluster partition is given by[5]: Consider an image with resolution (x × y) and it is to be clustered into ‘k’ number of clusters. Let p(x,y) be the input pixels to be clustered and ck be the cluster center. The flow of k-means is as follows:
Set the number of clusters ‘k’ and the center.
For every pixel calculate Euclidean distance(d), between center and each pixel of an image using the formula
d= || p (x, y) – ck ||
Approximate all the pixels to the nearest center based on ‘d’.
Repeat the process to satisfy tolerance value
Reshape cluster pixels into image
Clustering is basically a significant unsupervised categorizing technique that is used to recognize some innate pattern present in an object’s set.
D. CONVERSION TO HSV:
Color models like CMY, CMYK, and RGB are preferable to stipulate the color coordinates for printing. But they are not useful to represent a typical human explanation of color. Instead, the human perception of color is best defined in terms of HSV where H represents hue, S represents saturation, and V represents value. The type of color or name of color is described by Hue, Saturation gives the measure of purity of color or gives an indication of the amount of white color mixed with it and Value gives the measure of brightness or light intensity of object.
E. THRESHOLDING:
After segmentation, the healthy green pixels get masked using Otsu thresholding followed by image negation in the next step. The threshold gets automatically calculated and all pixels below the threshold are turned white and the ones above threshold are turned black. The image thus gets binarized. Only the infected parts are now visible in the form of black spots and the healthy part of the tomato turns white.
F. IMAGE NEGATION:
The thresholded image gets negated that is the white pixels turn black and vice-versa.Thus, a mask is formed such that the spots or the infected part turns white and the healthy tomato part is made zero
G. MASK ORIGINAL IMAGE WITH BINARY MASK:
The original image gets masked with the binary mask which obtains the only the infected cluster of the image. Then features are extracted from this image using GLCM technique.
IV.TECHNOLOGIES USED
A. OPEN CV:
Open Source Computer Vision Library is acomputer vision and machine learning software library. It consists of C++, Python, Java and MATLAB interfaces and supports Windows, Linux, Android and Mac OS. Open CV is inclined mostly towards real-time vision applications.
B. JUPYTER NOTEBOOK:
V.RESULTS
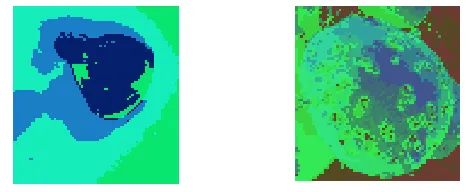
In Fig 5 and Fig 6, the original image which is represented using many colors. E.g. An RGB image of size 256x256 will have 256x256x3 colors where 3 is the R, G,B component of each pixel.
The K mean clustered image is an image that represents the original image using only the pre-dominant colors of the original image. Thus, the image is represented using less colors. The value of K used here is 7 i.e. the image shall be segmented into 7 clusters. K-means tries to group the coherent groups in an image locally. It provides spatial information as well.
Fig 9 HSV Image of Early blight Fig10 HSV image of Bacterial Spot
In Fig 11 and Fig 12, hue is the pre-dominant color of the image.
In Fig 15 and Fig 16, value functions along with saturationdescribes the brightness or intensity of the color.
In Fig 17 and Fig 18, this is the output obtained after Otsu thresholding. The image is converted into binary.
VI.CONCLUSION
Thus, Man power gets reduced and timely detection of the disease shall result in high productivity. The proposed system is efficient since all the other pixels are removed and only the infected pixels are present. Thus, this speeds up the process and results in a fast detection of the disease.
VII.FUTURE SCOPE
A. FEATURE EXTRACTION:
GLCM technique is used to extract features of the image.GLCM is the 2D matrix that gives joint probabilities between pair of pixels (first pixel with a gray level I and the other with gray level j, separated by a distance d
in a given direction θ. Thus, GLCM is included in the second order statistical texture analysis.
The GLCM technique has two parts [6]:
1) Formation of gray level co-occurrence matrix
2) Extraction of GLCM descriptors against the co-occurrence matrix.
Fig 21 GLCM generation of co-occurrence matrix
Every image will have a unique co-occurrence matrix. Using this matrix, the GLCM descriptors can be calculated for every image. Some of them are as follows:
1) Energy:
It gives information about the uniformity of texture of an image. Higher the uniformity, higher will be the energy value. It is calculated using:
2) Entropy:
It indicates the degree to which there is randomness in an image. When the value of all elements of Cij is the same, Entropy will reach the maximum value. An image with inhomogeneous scenes will have low entropy whereas as an image with homogeneous scenes will have a high entropy value. It is formulated using:
3) Contrast / Second Order Element Difference Moment:
B. CLASSIFICATION:
The features extracted images is fed to SVM classifier. SVM is a statistical learning-based solver. Statistics is a mathematics of uncertainty. Its purpose is to gain knowledge and make decisions from a set of data[7].
REFERENCES
[1]http://shodhganga.inflibnet.ac.in/bitstream/10603/79514/10/10_chapter1.pdf
[2]Pawar B.T., “Report of Bacterial Diseases of Tomato from Marathwada Region of Maharashtra, India”, ISCA,Vol. 3(ISC-2013), 302-304 (2014)
[3] http://203.64.245.61/web_crops/tomato/bacterial_spot.pdf [4]http://extension.umn.edu/diseases/early-blight-tomato
[5] NameirakpamDhanachandra, KhumanthemManglem and YambemJinaChanu, “Image Segmentation using K-means Clustering Algorithm and Subtractive Clustering Algorithm”, Eleventh International Multi-Conference on Information Processing-2015 (IMCIP-2015)
[6] RetnoKusumaningrum and AniatiMurniArymurthy, “Color and Texture Feature for Remote Sensing – Image Retrieval System: A Comparative Study”,IJCSI, Vol, 8, Issue 5, September 2011