Water Quality Measurement System with
Wireless Sensor Networking
Rashmi Deshmukh1, Vijay Kale2
M. Phil Student, K.T.H.M College, Nashik, Maharashatra, India1
Vice Principal, K.T.H.M. College, Nashik, Maharashtra, India2
ABSTRACT:Water is one of the most Important Compound to the Ecosystem. Good Quality of water Described by its Physical, Chemical and Biological Characteristics. Increased in the Human Population, Industrialization, Use of Fertilizers in Agriculture and Man-made activity the Natural Aquatic Resources are causing Heavy and varied Pollution in aquatic Environment Leading to water Quality and Depletion of aquatic Biota. It is therefore Necessary that the Quality of Drinking water should be checked at regular time interval because due to use of Contaminated Drinking water, Human Population Suffers From a variety of Water Borne Diseases. Quality of water can be decided using different parameters like pH,Turbidity, Total Dissolved Solid and many more.Considering such theory, author(s) present an application of wireless network. Application required sensor module for sensing a required data, wireless module for data transmission through radio channel and a gateway module as monitoring center. This system proposes a Sensor-Based Water Pollution Detection, which will detect the pollutant present in the water. The sensor pH, turbidity and TDS will be kept at any water surface and the data captured by the sensor will be given to Arduino board, then the data are transmitted wirelessly using Zigbee module after calculating the inference from the sensed data. The uniqueness of authors proposed paper is to obtain the water monitoring system with high pervasiveness, high mobility at low powered.
KEYWORDS:Green globalization, temperature,pH, turbidity, wireless network, Zigbee module, Wireless transmission etc.
I.INTRODUCTION
It consists of wireless network withArduino board and sensors. This system has two sensor pH &Turbidity. To prevent the water pollution, first we have to detect the pollutant.Traditional methods that are not only costly but also lack capability for real-time data capture, analyses and fast dissemination of information. This system will detect the some water quality parameter which will help to detect how much water is pollutant.It's very important to conduct research on water sensor networks because they can benefit many areas of science and industry such as water quality monitoring, ocean graphic data collection, disaster detection and prevention.The traditional method of water quality testing is to collect the samples manually and then send them to laboratory for analysis. However, it has been unable to meet the demands of water quality monitoring today. The quality of water usually described according to its physical, chemical and biological characteristics. This paper presents work on pH & Turbidity sensors with Arduino board and zigbee which is wireless. Both sensors which will detect the water pollutant and the data will convert from analog to digital by Arduino board and transmit throw the zigbee transmitter will show on LCD as well as on central monitor. This data will receive on other zigbee module which is receiver and will display on central monitor and LCD.
II.COMUNICATION
receiver to transmitter mode is done automatically. There are many works on the application of WSN for monitoring system. One classic example of using ZigBee is in security systems. A security system might have several sensors, including motion detectors, security cameras and glass-break sensors. These devices are required to communicate with the central security center by either wires or a wireless network. ZigBee-based security systems are simple to install, requiring no wired connection, and easy to upgrade. Although ZigBee has a low data rate, it has still the capability to transfer images wirelessly with reasonable quality.
III.SYSTEM SETUP
The setup requires sensor module for sensing a required data, wireless module for data transmission through radio channel and a gateway module which is Arduino development board as monitoring centre. This paper proposes a Sensor-Based Water Pollution Detection, which will detect the pollutant present in the water. The sensor turbidity pH will be kept at any water surface and the data captured by the sensor will be given to Arduino board, then the data are transmitted wirelessly using Zigbee module after calculating the inference from the sensed data.
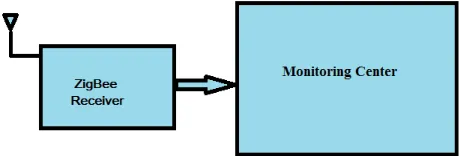
A.BLOCK DIAGRAM:
Fig 1: Block diagram of “Water Quality Measurement System with Wireless Sensor Networking” (Transmitting section)
B.CIRCUIT DIAGRAM: Power supply:
TRANSMITTER:
IV.SENSORS WITH WORKING PRINCIPALS
1. SEN189 Turbidity Sensor
The SEN189 measures the turbidity (amount of suspended particles) of the water. This is an optical sensor for turbid water density or an extraneous matter concentration using the refraction of wavelength between photo transistor and diode. By using an optical transistor and optical diodes, an optical sensor measures the amount of light coming from the source of the light to the light receiver, in order to calculate water turbidity.
Theory of Operation
The sensor operates on the principle that when light is passed through a sample of water, the amount of light transmitted through the sample is dependent on the amount of soil in the water. As the soil or dissolved water impurities level increases, the amount of transmitted light decreases the turbidity sensor measures the amount of transmitted light to determine the turbidity of the water.Turbidity is a measure of the amount of suspended particles in the water. Algae, suspended sediment, and organic matter particles can cloud the water making it more turbid Suspended particles diffuse sunlight and absorb heat. This can increase temperature and reduce light available for algal photosynthesis. If the turbidity is caused by suspended sediment, it can be an indicator of erosion, either natural or man-made.
2. pH (PE-03 electrode)
pH is a measure of how acidic or basic (alkaline) the water isIt is defined as the negative log of the hydrogen ion concentration. The pH scale is logarithmic and goes from 0 to 14. For each whole number increase (i.e. 1 to 2) the hydrogen ion concentration decreases tenfold and the water becomes less acidic. As the pH decreases, water becomes more acidic. As water becomes more basic, the pH increases.This pH electrode measures the concentration of hydrogen ions in the water. A pH sensor measures how acidic or basic the water is. pH range is from 0 (very acidic) to 14 (very basic), with 7 being neutral. Most water pH range is from 5.5 to 8.5. Changes in pH can affect how chemicals dissolve in the water.
Theory of Operation
PHis measure as acidity or alkalinity of a solution, the PH scale range from 0 to 14.The PH indicates the concentration of hydrogen [H] + ions present in certain solution.it can be accurately be qualified by sensor that can measure the potential difference between two electrodes: a reference electrode (sliver/silver chloride) and a glass electrode that is sensitive to hydrogen ions. This is what forms the probe. We have also to use electronic circuit to condition the signal appropriately and we can use this sensor with microcontroller such as Arduino.
pH probe measure the pH by measuring the voltage or potential difference of solution in which it is dipped. The two electrode used in a pH meter are
1. Glass electrode –Which have silver alloy electrical wire submerged in a neutral solution of potassium chloride all contained inside a thin bulb made from a special glass containing salts of metals such as sodium and calcium.
V. RESULT AND DISCUSSION
Turbidity: Fig 3, it shows the graph of NTU Vs. voltage of testing water.
Fig.3 NTU (Nephelometric turbidity unit) Vs. voltage
Table 1 showing the drinking and fully turbid water digital counts with its standard Measurements.
Turbidity Count Standard
Drinking water [clean water]
963 <3 NTU
Fully turbid water 204 <250 NTU
Then for clean water, = [ −325]x -1 =[321-325] x -1 =[-4] x -1 =4 NTU For turbid water
= [ −325]x -1 =[68-325] x -1 =[-256] x -1 =256 NTU
pH
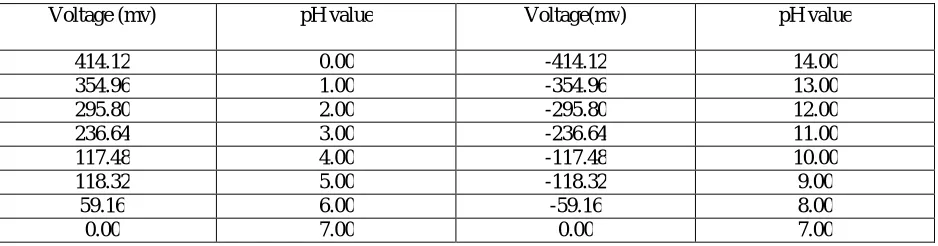
Calibration of pH electrode
The output of pH electrode is in millivolt and the pH value of the relationship shown in table 2.
Voltage (mv) pH value Voltage(mv) pH value
414.12 0.00 -414.12 14.00
354.96 1.00 -354.96 13.00
295.80 2.00 -295.80 12.00
236.64 3.00 -236.64 11.00
0 pH-acid which is 414 mv 7 pH-neutral which is 0 volt 14 pH-basic which is -414 mv (5pH-8pH is normal drinking water)
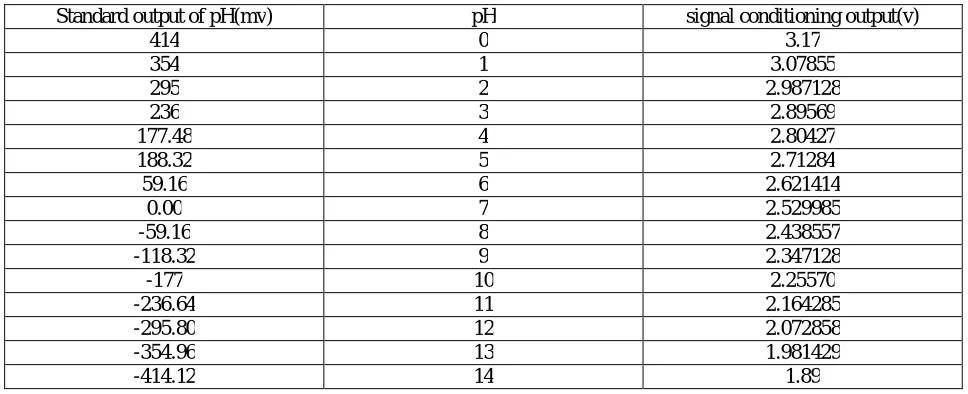
Table 3 is showing the standard and signal conditioning output of pH electrode of its 14 stages
Standard output of pH(mv) pH signal conditioning output(v)
414 0 3.17
354 1 3.07855
295 2 2.987128
236 3 2.89569
177.48 4 2.80427
188.32 5 2.71284
59.16 6 2.621414
0.00 7 2.529985
-59.16 8 2.438557
-118.32 9 2.347128
-177 10 2.25570
-236.64 11 2.164285
-295.80 12 2.072858
-354.96 13 1.981429
-414.12 14 1.89
pH calculation:-
pH value varies from 0 to 14 For example,
Initial value: Final value pH-14[1.89] : pH – 0[ 3.17 V]
0-14 there is 14 stages So,
1.89-3.17 volt= . . = . =0.09142857 Therefore,
For pH value 14: 1.89 volt
Here, 1.89<sensor value >3.17 volt = [ . . ] = [ . . . ] = [ . . ]
= 1.0057.
VI.CONCLUSION
The main purpose that is being addressed in this project is about developing an efficient wireless sensor network (WSN) based water quality monitoring system that examines ‘water quality’, an important factor as far as, irrigation, domestic purposes, industries, etc. are concerned.Overall, the proposed implementation of high power Zigbee based WSN for water quality monitoring system offering low power consumption.Another important fact of this system is the easy installation of the system where the base station can be placed at the local residence close to the target area and the monitoring task can be done by any person with minimal training at the beginning of the system installation.
REFERENCES
[1] Helena G. Ramos, P. GirZo, O.Postolache, M. Pereira,“Distributed Water Quality Measurement System Based on SDI- 12”, IEEE AFRICON 2004. [2] Marco Zennaro, Athanasios Floros, Gokhan Dogan,Tao Sun, Zhichao Cao Chen Huang, Manzoor Bahader, “On the design of a Water Quality Wireless Sensor Network (WQWSN):an Application to Water Quality Monitoring in Malawi” International Conference on Parallel Processing Workshops, IEEE 2009. [3] Mo Deqing, Zhao Ying, Chen Shangsong, “Automatic Measurement and Reporting System of Water Quality Based on GSM.” International Conference on Intelligent System Design and Engineering Application, IEEE 2012.
[4] M. Lopez, J.M. Gomez, J. Sabater, A. Herms, “IEEE 802.15.4 based wireless monitoring of pH and temperature in a fish farm”, 15th IEEE Mediterranean Electrotechnical Conference, Valletta, IEEE pp 575 – 580, 2010.
[5] Wang xiaoyi, Dai jun, Liu zaiwen, Zhao xiaoping, Dong suoqi, Zhao zhiyao, “The Lake Water Bloom Intelligent Prediction Method And Water Quality Remote Monitoring System.”, Sixth International Conference on Natural Computation (ICNC 2010), IEEE 2010.
[6] Dong He1,Li-Xin Zhang, “The Water Quality Monitoring System Based on WSN”, IEEE 2012.
[7] Catalin Damian, Cristian Fosalau,Jose Miguel Dias Pereira,Octavian, Postolache,Pedro Silva Girao,” Sensor Network for Water Quality Assesment”, International Conference and Exposition on Electrical and PowerEngineering (EPE 2012), 25-27 October, Iasi, Romania,2012.
[8] Theofanis P. Lambrou, Christos C. Anastasiou, Christos G. Panayiotou, and Marios M. Polycarpou, “A Lowcost Sensor Network For Real-time Monitoring And Contamination Detection In Drinking Water Distribution Systems”IEEE Sensors Journal, vol. 14, NO. 8, August, 2014.
[9] Jin-Shyan Lee, Yu-Wei Su, and Chung-Chou Shen, “A Comparative Study of Wireless Protocols: Bluetooth, UWB, ZigBee, and Wi-Fi”, Industrial Electronics Society, 2007. IECON 2007. 33rd Annual Conference of the IEEE, 5-8 Nov. 2007, Page 46 – 51.
[10] Anita Bhatnagar, Pooja Devi, “Water quality guidelines for the management of pond fish culture”, INTERNATIONAL JOURNAL OF ENVIRONMENTAL SCIENCES Volume 3, No 6, June, 2013.
[11] Matt Rechardson and Shawn Wallance, Getting Started With RaspberryPi,ed.1,O’Reilly Media, Inc., December 2012.
[12] Martin Hebel ,George Bricker and Daniel Harris ,”Getting Started With XBee RF Modules” Ed. 1st Kazem Sohraby, Daniel Minoli and Taieb Znati,
“Wireless Sensor Networks, Technology, Protocols, and Applications” John Wiley & Sons, Inc. , 2007He1,Li-Xin Zhang, “The Water Quality Monitoring System Based on WSN”, IEEE 2012.
[13] Catalin Damian, Cristian Fosalau,Jose Miguel Dias Pereira,Octavian, Postolache,Pedro Silva Girao,” SensorNetwork for Water Quality Assesment”,
International Conference and Exposition on Electrical and PowerEngineering (EPE 2012), 25-27 October, Iasi, Romania,2012.
[14] Theofanis P. Lambrou, Christos C. Anastasiou, Christos G. Panayiotou, and Marios M. Polycarpou, “A LowcostSensor Network For Real-time
Monitoring And Contamination Detection In Drinking Water DistributionSystems”IEEE Sensors Journal, vol. 14, NO. 8, August, 2014.
[15] Jin-Shyan Lee, Yu-Wei Su, and Chung-Chou Shen, “A Comparative Study of Wireless Protocols: Bluetooth,UWB, ZigBee, and Wi-Fi”, Industrial Electronics Society, 2007. IECON 2007. 33rd Annual Conference of theIEEE, 5-8 Nov. 2007, Page 46 – 51.
[16] Anita Bhatnagar, Pooja Devi, “Water quality guidelines for the management of pond fish culture”,INTERNATIONAL JOURNAL OF ENVIRONMENTAL SCIENCES Volume 3, No 6, June, 2013.
[17] Matt Rechardson and Shawn Wallance, Getting Started With RaspberryPi,ed.1,O’Reilly Media, Inc.,December 2012. [12] Martin Hebel ,George Bricker and Daniel Harris ,”Getting Started With XBee RF Modules” Ed. 1st
BIOGRAPHY
Rashmi KishorDeshmukh,