International Journal of Research (IJR)
e-ISSN: 2348-6848, p- ISSN: 2348-795X Volume 2, Issue 06, June 2015Available at http://internationaljournalofresearch.org
Machining Parameters Optimization for Turning
Cylindrical Bar Stock Using Feature Based Genetic
Algorithm (GA)
Abhishek Agrawal
1& Dr. S.N. Verma
21Ph.D Scholar, Dept. of Mech. Engg, University Institute of Technology-RGPV Bhopal, India 2Professor, Dept. of Mech. Engg, University Institute of Technology-RGPV Bhopal, India
[email protected] (only corresponding author)
Abstract
The economics of machining have been of interest to many researchers. Many researchers have dealt with the optimization of machining parameters for turning operations with constant diameters only. All CNC machines produce finished components from bar stock. Finished profiles consist of straight turning, facing, taper and circular machining. This research concentrates on optimising the machining parameters for turning cylindrical stock into continuous finished profiles. Arriving at a finished profile from a cylindrical stock is done in two stages, rough machining and finish machining. Rough machining consists of multiple passes and finish machining consists of single-pass contouring after the stock is removed in rough machining. The machining parameters in multi pass turning are depth of cut, cutting speed and feed. The machining performance is measured by the production cost. In this paper the optimal machining parameters for continuous profile machining are determined with respect to the minimum production cost, subject to a set of practical constraints. The constraints considered in this problem are cutting force, power constraint and tool tip temperature. Due to high complexity of this machining optimisation problem, a Feature Based Design (FD) & genetic algorithm (GA) are applied to resolve the problem. The results obtained from FD and GA is compared.
Keywords: Continuous finished profile; Genetic algorithm; Optimisation; Feature Based Design; Machining parameter
1.INTRODUCTION
Optimisation of operating parameters is an important step in machining, particularly for operating CNC machine tools. Many researchers
have investigated machining optimization
problems. In earlier work, Gilbert [1] used an analytical procedure for determining cutting speed that minimizes the machine cost for a single-pass turning operation. Further analysis of single and multi-pass turning has been done [2,3] using practical constraints. Iwata et al. [4] have presented a dynamic programming model for the simultaneous determination of optimal value of cutting speed, feed and depth of cut, for an individual pass, along with optimum number of passes.
Subsequently, Agapiou [5,6] used a dynamic programming model similar to that of Iwta [4] for determining the optimum value of an objective function (weighted sum of production cost and time) and Ruy Mesquita [7] used the Hook–Jeeves search method for finding the optimum operating parameters.Shin and Joo [8] have presented a model for multipass turning. In the above research, only the straight turning process, i.e. cutting a component in the longitudinal direction to produce a constant part diameter, was discussed. The finished component from CNC, in an FMS environment contains a continuous profile. The continuous profile consists of straight turning, facing, taper turning, convex and concave circular arcs. Chen et al. [9] have developed an optimisation model for machining a continuous profile from bar stock using a simulated annealing approach.
International Journal of Research (IJR)
e-ISSN: 2348-6848, p- ISSN: 2348-795X Volume 2, Issue 06, June 2015Available at http://internationaljournalofresearch.org
the objective of minimum production cost. They have considered two pass turning examples only.
Subsequently, Yellowley and Gun [11] have shown that for both turning and milling operations the optimal subdivision of depth of cut may be determined without knowledge of the relevant tool life Eq.. Calculation of machining parameters in turning operation using machining theory was carried out by Meng et al. [12]. The objective criterion used in this work is minimum cost. Prased et al. [13] have used a combination of geometric and linear programming techniques for solving the multipass turning optimisation problem as part of a PC-based generative CAPP system.
The simulated annealing approach along with the Hook– Jeeves pattern search method was applied by Chen [14] for multipass turning operations, and Onwubolu et al. [15] have used a genetic algorithm for optimising multipass
turning operations. Multipass turning
optimisation with optimal subdivision of depth of cut was developed by Gupta et al. [16]. A direct search procedure was used by Arsecularatne et al. [17]. To determine the optimum cutting parameters. The operations considered in this work were right- and left-hand turning, boring, facing and threading.
Savaranan et al. [18] have used a GA, SA, Nelder–Mead simplex and a Boundary search procedure for optimising a CNC turning process, but the work was limited to straight turning only. Contour profile was not considered in this work.
Most of the researchers in the area of machining have used various techniques for finding the optimal machining parameters for single- and multipass turning operations. Continuous profiling, which consists of turning, facing and circular turning was not considered by most of the researchers.
In addition, most of the researchers have used traditional optimisation techniques for solving machining problems. The traditional methods of optimisation and search do not really fare well over a broad spectrum of problem domains. Traditional techniques are not efficient when the practical search space is too large. These algorithms are not robust. Numerous constraints and the number of passes make the machining optimisation problem complicated. Traditional techniques such as geometric
programming, dynamic programming, and branch and bound techniques find it hard to solve these problems, and they are inclined to obtain a local optimal solution.
Considering the drawbacks of traditional optimisation techniques, this paper attempts to determine the optimal machining parameters for machining of a continuous finished profile from bar stock using non-traditional optimisation techniques.
2. PROBLEM FORMULATION
In CNC machine tools, the finished component is obtained by a number of rough passes and finish passes. The roughing operation is carried out to machine the part to a size that is slightly larger than the desired size, in preparation for the finishing cut [9]. The finishing cut is called single-pass contour machining, and is machined along the profile contour. Most of the CNC machine tools have canned cycles such as turning and facing cycles. In this paper, a turning centre with Sinumeric control system is used. Two roughing stages and a finished stage are considered to machine the component from the bar stock. The first roughing stage consists of (n_1) passes where n is the total number of roughing passes, and the last pass of roughing removes the material along the profile contour. In the finish stage material (amount of finish allowance) is removed along the contour of the profile. The production cost criteria are used in this work for finding the performance of the machining operations under practical constraints.
2.1 Machining Model
Earlier developed machining models cannot be used for profile machining problems. The length of cutting path is calculated for each pass in the roughing and finishing stages. Then the cutting time for each pass is calculated [9] for these stages. The cutting time is used to calculate the machining cost of the profile.
International Journal of Research (IJR)
e-ISSN: 2348-6848, p- ISSN: 2348-795X Volume 2, Issue 06, June 2015Available at http://internationaljournalofresearch.org
processes, the unit production cost UC (Rs./piece) can be obtained as
where
CM =cutting cost (Rs./piece)
CI =machine idling cost (Rs./piece)
CR =tool replacement cost (Rs./piece) CT = tool cost (Rs./piece)
ko =sum of direct labour cost and overhead (Rs./min)
TM = actual cutting time
TI =machine idle time (min)
tl =tool life (min)
te =time required to exchange a tool (min)
kt =cutting edge cost (Rs./edge)
2.2 Machining Constraints
The practical constraints imposed during the roughing and finishing operations as described by Chen and Su [9] are given below.
2.2.1 Parameter Bounds Bounds on cutting speed:
where VrL and VrU are the lower and upper bounds of
cutting speed in roughing, respectively.
Bounds on feed:
where frL and frU are the lower and upper bounds of
feed in roughing, respectively.
2.2.2 Roughing Machining
The expression for the cutting force constraint is given by
where Fr is the cutting force during rough machining, kf, _and v are the constants pertaining to a specific tool–workpiece combination, and FU is the maximum allowable cutting force (kgf).
2.2.3 Power Constraint The power constraint is given by
where Pr is the cutting power during rough
machining (kW),is the power efficiency, and PU is
the maximum allowable cutting power (kW).
2.2.4 Chip–Tool Interface Temperature Constraint
This constraint is expressed as
where Qr is the temperature during roughing (C), kg,
T, and are the constants related to the equation for the chip– tool interface, and QU is the maximum
allowable temperature.
2.2.5 Dimensional Accuracy Constraint
The regressional relation for calculating the dimensional accuracy is given below [19]:
where _ is the dimensional accuracy, f is the feed rate per revolution, d is the depth of cut, and V is the cutting speed.
2.2.6 Finish Machining
All the above constraints and surface finish constraint are considered for finish machining.
2.2.7 Surface Finish Constraint
The maximum allowable surface roughness is calculated as given below [8]. Surface roughness is influenced by the feed and the nose radius of the tool:
where r is the nose radius of cutting tool (mm), Rmax
is maximum allowable surface roughness (_m) and fs
is the feed.
3. SOLUTION METHODOLOGY
Genetic algorithms (GA) are non-traditional search and optimisation techniques. GA are different from traditional optimisations in the following ways [20]. 1. GA work with a coding of the parameter set, not the parameters themselves.
2. GA search from a population of points and not a single point.
International Journal of Research (IJR)
e-ISSN: 2348-6848, p- ISSN: 2348-795X Volume 2, Issue 06, June 2015Available at http://internationaljournalofresearch.org
4. GA use probabilistic transitions rules, not deterministic rules.
5. It is very likely that the expected GA solution will be a global solution.
Based on the merits of non-traditional optimisation techniques over traditional techniques, it is paper proposed to use GA methods in solving the machining optimization problem.
3.1 Genetic Algorithm Methodology
Genetic algorithms are computerised search and optimization algorithms based on the mechanics of natural genetics and natural selection.
3.1.1 Steps in the Genetic Algorithm Method
1. Choose a coding to represent problem parameters, a selection operator, a crossover operator, and a mutation operator.
Choose population size n, crossover probability pc, and mutation probability pm. Initialise a random population of strings of size l. Choose a maximum allowable generation number tmax.Set t _ 0. 2. Evaluate each string in the population.
3. If t tmax or other termination criteria are satisfied, terminate.
4. Perform reproduction on the population.
5. Perform crossover on pair of strings with probability pc.
6. Perform mutation on strings with probability pm. 7. Evaluate strings in the new population. Set * _ t + 1 and go to Step 3.
3.1.2 Genetic Algorithm Parameters
Population size: 20 Length of Chromosome: 20 Selection operator: Rank order
Crossover operator: Single point operator Crossover probability: 0.8
Mutation probability: 0.01
Fitness parameter: Unit production cost
3.1.3 Implementation of GA with Numerical Illustration Representation
Representation plays a key role in the development of a GA. A problem can be solved once it can be represented in the form of a solution string (chromosomes). The bits (genes) in the chromosome could be binary, real integer numbers. In this work, the cutting speed and feed rate are considered to be the primary parameters for the turning operation.
Each of these primary variables is represented in a binary string format.
The total length of the string is 20 in which first 10 bits are used for speed representation and next 10 bits represent the feed variable. The speed and feed are represented as substrings in the chromosome.
The strings (0000000000 0000000000) and (1111111111 1111111111) represent the lower and upper limits of speed and feed.
Initialisation
During initialisation, a solution space of a ―population size’ solution string is generated randomly between the limits of the speed and feed. In this work the solution space size (population size) is considered as 20 as shown in Table 1. Columns 1 and 2 show the initial random binary population. Columns 3 and 4 show the decoded decimal value of the binary string. Columns 5 and 6 show the actual decoded speed and feed value which is calculated based on the following formula.
where
xi is the decoded speed or feed,
x(L)i is the lower limit of speed or feed,
x(U)i is the upper limit of speed or feed, and
n is the substring length (=10).
In this example, x(L)i _ 50 for speed
x(U)i _ 550 for speed
x(L)i _ 0.2 for feed
x(U)i _ 1.0 for feed
Evaluation
In a GA, a fitness function value is computed for each string in the population, and the objective is to find a string with the maximum fitness function value. It is often necessary to map the underlying natural objective function to a fitness function form through one or more mappings. Since, we use a minimisation objective function, the following transformation is used:
where g(x) is the objective function (unit production cost) and f(x) is the fitness function.
International Journal of Research (IJR)
e-ISSN: 2348-6848, p- ISSN: 2348-795X Volume 2, Issue 06, June 2015Available at http://internationaljournalofresearch.org
Column 7 is calculated based on the above transformation.
Table 1. Output of genetic algorithm No. String 1
(speed) String 2 (feed) Decoded values Actual values (Speed) Fitness (Feed)
1. 2. 3. 4. 5. 6. 7. 8. 9. 10. 11. 12. 13. 14. 15. 16. 17. 18. 19. 20. 1011101110 0001111001 0010000111 1000001101 1100100011 0000111001 0100110101 1101101110 1101000010 0111110011 0110111101 1011001001 1011100011 1010100101 1011110010 0100101110 0011010111 1100100011 1011111111 0110110011 0101001111 1011100110 1010001100 0111110010 0001101101 0011011101 0010111010 0111101101 0100111100 1011011011 0110101110 1110101011 1011000011 0111110110 0110010010 1010111001 1111010011 1001010100 0010001101 0000110110
750 335 417 121 742 109 135 652 116 525 498 307 803 109 442 57 221 78 309 186 201 878 493 479 834 316 458 499 731 294 445 430 267 713 939 398 739 707 411 677 502 381 754 402 419 302 697 198 215 979 155 803 596 442 767 141 425 435 54 263
0.461975 0.780254 0.709873 0.589443 0.285239 0.372825 0.345455 0.585533 0.447116 0.771652 0.536266 0.934311 0.752884 0.592571 0.514369 0.745064 0.965591 0.666080 0.310264 0.242229 0.004362 0.105769 0.100540 0.011910 0.004875 0.052030 0.052689 0.002112 0.003089 0.011622 0.020722 0.003102 0.003213 0.005168 0.003961 0.045997 0.077460 0.002632 0.005372 0.031559
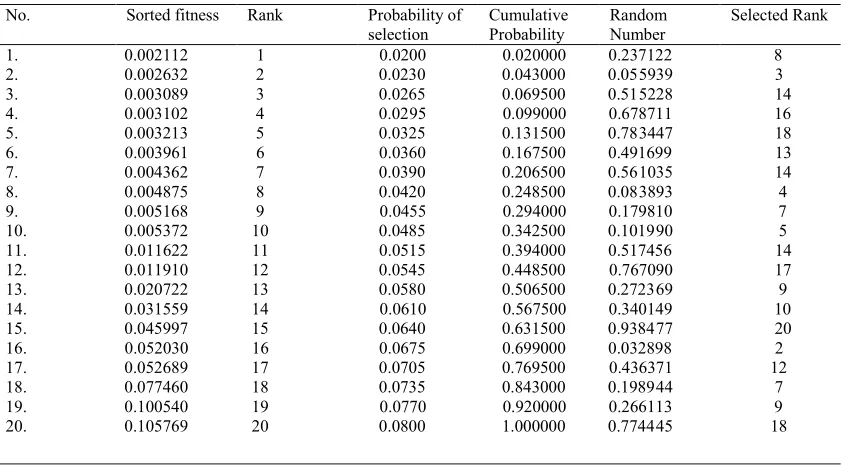
Table 2. Output of reproduction method. No. Sorted fitness Rank Probability of
selection Cumulative Probability Random Number Selected Rank
1. 0.002112 1 0.0200 0.020000 0.237122 8
2. 0.002632 2 0.0230 0.043000 0.055939 3
3. 0.003089 3 0.0265 0.069500 0.515228 14
4. 0.003102 4 0.0295 0.099000 0.678711 16
5. 0.003213 5 0.0325 0.131500 0.783447 18
6. 0.003961 6 0.0360 0.167500 0.491699 13
7. 0.004362 7 0.0390 0.206500 0.561035 14
8. 0.004875 8 0.0420 0.248500 0.083893 4
9. 0.005168 9 0.0455 0.294000 0.179810 7
10. 0.005372 10 0.0485 0.342500 0.101990 5
11. 0.011622 11 0.0515 0.394000 0.517456 14
12. 0.011910 12 0.0545 0.448500 0.767090 17
13. 0.020722 13 0.0580 0.506500 0.272369 9
14. 0.031559 14 0.0610 0.567500 0.340149 10
15. 0.045997 15 0.0640 0.631500 0.938477 20
16. 0.052030 16 0.0675 0.699000 0.032898 2
17. 0.052689 17 0.0705 0.769500 0.436371 12
18. 0.077460 18 0.0735 0.843000 0.198944 7
19. 0.100540 19 0.0770 0.920000 0.266113 9
International Journal of Research (IJR)
e-ISSN: 2348-6848, p- ISSN: 2348-795X Volume 2, Issue 06, June 2015Available at http://internationaljournalofresearch.org
Selection and Reproduction
Reproduction selects good strings in a population and forms a mating pool. The reproduction operator is also called a selection operator. In this work rank order selection [18] is used. Table 2 shows the output generated using this method.
Column 8 is arranged by sorting the fitness value of column 7 (Table 1) in ascending order.
Column 9 is the corresponding rank of the string. A lower ranked string will have a lower fitness value or a higher objective function and vice versa. Column 10 shows the probability of selection for each string which is calculated, based on the following formula [18]:
Expected value of probability
where
N =20
min =0.02 max =0.08
Column 11 shows the cumulative probability. Column 12 shows random numbers generated between 0 and 1.
Column 13 shows the range in which the random number lies in the cumulative probability. The string corresponding to the higher cumulative probability value in the range is chosen as one of the parents.
In Table 2 for the first string the generated random number is 0.237122. The string number 8, which has a cumulative probability of 0.2485000, is selected as the parent, and this process is repeated for the entire population.
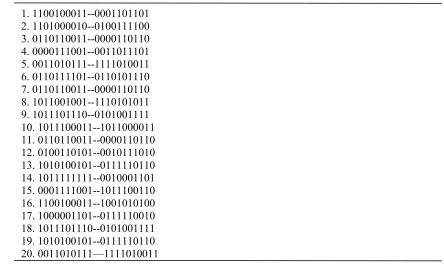
Table 3 shows the list of selected chromosomes after reproduction for crossover.
Table 3. Selected chromosomes for crossover.
1. 1100100011--0001101101 2. 1101000010--0100111100 3. 0110110011--0000110110 4. 0000111001--0011011101 5. 0011010111--1111010011 6. 0110111101--0110101110 7. 0110110011--0000110110 8. 1011001001--1110101011 9. 1011101110--0101001111 10. 1011100011--1011000011 11. 0110110011--0000110110 12. 0100110101--0010111010 13. 1010100101--0111110110 14. 1011111111--0010001101 15. 0001111001--1011100110 16. 1100100011--1001010100 17. 1000001101--0111110010 18. 1011101110--0101001111 19. 1010100101--0111110110 20. 0011010111—1111010011
International Journal of Research (IJR)
e-ISSN: 2348-6848, p- ISSN: 2348-795X Volume 2, Issue 06, June 2015Available at http://internationaljournalofresearch.org
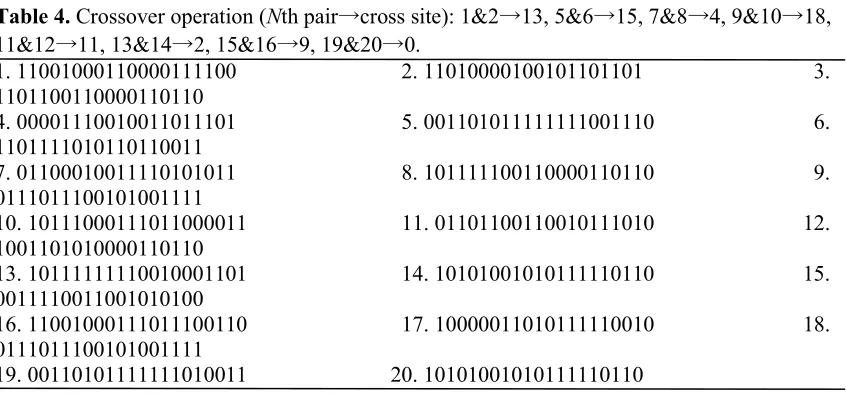
Crossover is used in this work. The crossover probability is 0.8. The concept of crossover is explained below.
Before crossover: 1. 1100100011 – 000 1
2. 1101000010 – 010 0|101101 111100
↑_↓
After crossover: 1&2→13 means crossover takes place between 1st and 2nd string at (13
1)th cross site and after the (13 1)th bit all the information is exchanged between strings. The cross site number starts from zero. Hence cross site number 13 represents the 14th site.
1. 1100100011 – 000 0
2. 1101000010 – 010 1|111100 101101
The complete output after crossover is given in Table 4.
Mutation
Mutation is a random modification of a randomly selected string. Mutation is done with a mutation probability of 0.01.
Before mutation:
1.1100100011000_0 _111100
After mutation: 1→14 means that mutation takes place
at the 1st string at the 14th site. The mutation will invert from 0 to 1 or 1 to 0 at the particular site.
1. 1100100011000_1 _111100
The output after mutation is shown in Table 5.
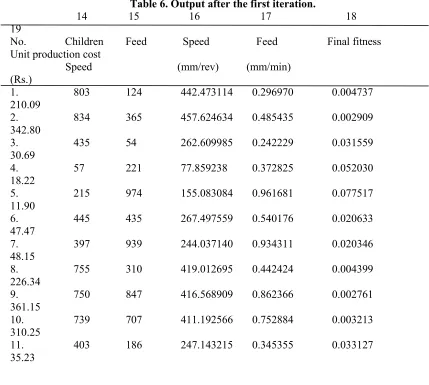
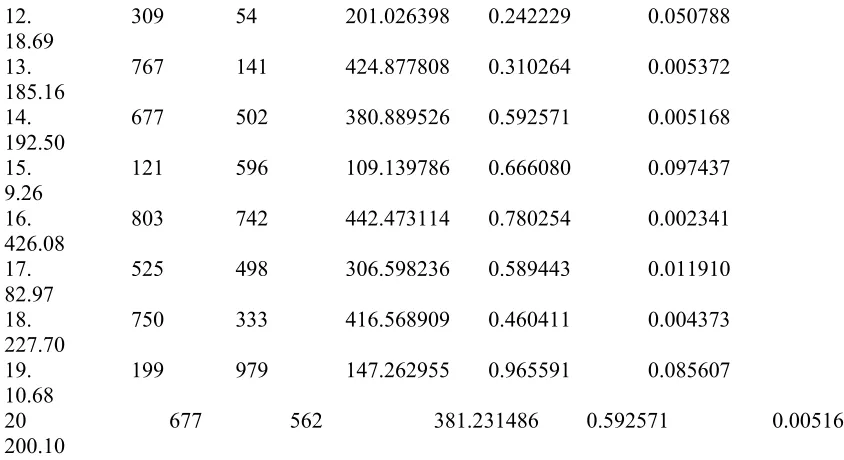
The output after the first iteration is given in Table 6.
The best string in the list is the chromosome number 15 which has minimum unit production cost. The optimal speed is 109.139786 m min_1 and the optimal feed is 0.666080 min rev_1. This completes one iteration of the GA and the best value is stored. All the strings available at the end of first iteration will be treated as parents for the second iteration.
This procedure is repeated for the number of iterations as given by the user.
Table 4. Crossover operation (Nth pair→cross site): 1&2→13, 5&6→15, 7&8→4, 9&10→18, 11&12→11, 13&14→2, 15&16→9, 19&20→0.
1. 11001000110000111100 2. 11010000100101101101 3. 1101100110000110110
4. 00001110010011011101 5. 001101011111111001110 6. 1101111010110110011
7. 01100010011110101011 8. 101111100110000110110 9. 0111011100101001111
10. 10111000111011000011 11. 01101100110010111010 12. 1001101010000110110
13. 10111111110010001101 14. 10101001010111110110 15. 0011110011001010100
16. 11001000111011100110 17. 10000011010111110010 18. 0111011100101001111
International Journal of Research (IJR)
e-ISSN: 2348-6848, p- ISSN: 2348-795X Volume 2, Issue 06, June 2015Available at http://internationaljournalofresearch.org
Table 5. Mutation operation (Nth string→Nth gene):1→14, 7→8, 8→12, 9→11, 11→5, 18→19, 19→6.
1. 11001000110001111100 2. 11010000100101101101 3. 1101100110000110110
4. 00001110010011011101 5. 00110101111111001110 6. 1101111010110110011
7. 01100011011110101011 8. 10111100110100110110 9. 0111011101101001111
10. 10111000111011000011 11. 01100100110010111010 12. 1001101010000110110
13. 10111111110010001101 14. 10101001010111110110 15. 0011110011001010100
16. 11001000111011100110 17. 10000011010111110010 18. 0111011100101001101
19. 00110001111111010011 20. 10101001010111110110
Table 6. Output after the first iteration.
14 15 16 17 18 19
No. Children Feed Speed Feed Final fitness Unit production cost
Speed (mm/rev) (mm/min) (Rs.)
1. 803 124 442.473114 0.296970 0.004737 210.09
2. 834 365 457.624634 0.485435 0.002909 342.80
3. 435 54 262.609985 0.242229 0.031559 30.69
4. 57 221 77.859238 0.372825 0.052030 18.22
5. 215 974 155.083084 0.961681 0.077517 11.90
6. 445 435 267.497559 0.540176 0.020633 47.47
7. 397 939 244.037140 0.934311 0.020346 48.15
8. 755 310 419.012695 0.442424 0.004399 226.34
9. 750 847 416.568909 0.862366 0.002761 361.15
10. 739 707 411.192566 0.752884 0.003213 310.25
International Journal of Research (IJR)
e-ISSN: 2348-6848, p- ISSN: 2348-795X Volume 2, Issue 06, June 2015Available at http://internationaljournalofresearch.org
12. 309 54 201.026398 0.242229 0.050788 18.69
13. 767 141 424.877808 0.310264 0.005372 185.16
14. 677 502 380.889526 0.592571 0.005168 192.50
15. 121 596 109.139786 0.666080 0.097437 9.26
16. 803 742 442.473114 0.780254 0.002341 426.08
17. 525 498 306.598236 0.589443 0.011910 82.97
18. 750 333 416.568909 0.460411 0.004373 227.70
19. 199 979 147.262955 0.965591 0.085607 10.68
20 677 562 381.231486 0.592571 0.005168 200.10
4. Test Example
For testing the proposed methodology, the component shown in Fig.1 is considered. The component is to be machined with optimal speed and feed using an STC15 CNC turning centre [21] available in our laboratory. The workpiece material is mild steel and the tool material is a carbide tip. The proposed model is run on an IBM PC 586 compatible computer using the ―Matlab‖ language. Tables and graphs summarise the computational results.
Number of roughing cuts =15 Depth of cut for finishing = 0.5 mm
Figure 1.Sample part for the case study
Table 7.Feature and operation classification
Feature no. Feature Operation
0 (F0) Raw Material _
1 (F1) Turn Groove
2 (F2) Chamfer Chamfering
3 (F3) Groove U Grooving
4 (F4) Turn Grooving
5 (F5) Fillet Filleting
International Journal of Research (IJR)
e-ISSN: 2348-6848, p- ISSN: 2348-795X Volume 2, Issue 06, June 2015Available at http://internationaljournalofresearch.org
Table 8. Final result of genetic algorithm
Maximum fitness Speed (mm/min) feed (mm/rev) Min unit production cost (Rs.)
0.15111 104.252 0.9937 348.44
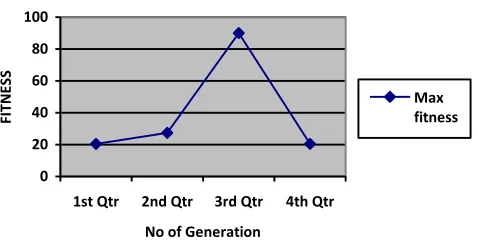
Graphic Output of Genetic Algorithm
0 20 40 60 80 100
1st Qtr 2nd Qtr 3rd Qtr 4th Qtr
No of Generation
FITN
ES
S
Max fitness
Fig. 2. It shows the fitness obtained in each iteration of the GA. The graph shows that the GA produces smooth fitness at the initial iteration and varying fitness in the subsequent iterations.
5. Results and Discussion
The results obtained from GA discussed below.
Table 7 shows the optimal cutting parameters such as speed and feed obtained from GA for the minimum unit production cost of Rs. 348.44. Figure 2 shows the fitness obtained in each iteration of the GA. The graph shows that the GA produces smooth fitness at the initial iteration and varying fitness in the subsequent iterations.
6. Conclusion
Many types of CNC machines have been used to produce continuous finished profiles. A continuous finished profile has many types of operations such as facing, taper turning and circular turning. A model of the process has been formulated and one non-traditional algorithm, GA has been employed to find the optimal machining parameters for the
continuous profile. Of the one algorithm, GA produces marginally better results than other non-traditional algorithm. Other constraints such as work holding and dynamic instability can be included as a future extension of this work. The proposed model can further be extended for thread cutting and internal operations.
REFERENCES
[1.]W. W. Gilbert, ―Economics of Machining, Machining Theory and Practice‖, American Society of Metals, 1950.
International Journal of Research (IJR)
e-ISSN: 2348-6848, p- ISSN: 2348-795X Volume 2, Issue 06, June 2015Available at http://internationaljournalofresearch.org
[3.]B. Gopalakrishnan et al., ―Machine parameter selection for turning with constraints: an analytical approach based on geometric programming‖, International Journal of Production Research, 29(9), pp. 1897–1908, 1991.
[4.]K. Iwata et al., ―A probabilistic approach to the determination of the optimum cutting conditions‖, ASME Journal of Engineering for Industry, 94, pp. 1099–1107, 1972.
[5.]5. J. S. Agapiou, ―The optimisation of machining operations based on a combined criterion, Part-1: the use of combined objectives in single pass operations‖, ASME Journal of Engineering for Industry, 114, pp. 500–507, 1992.
[6.]J. S. Agapiou, ―The optimization of machining operations based on a combined criterion, Part 2: multi pass operations‖, ASME Journal of Engineering for Industry, 114, pp. 508–513, 1992.
[7.]Ruy Mesquita et al., ―Computer aided selection of optimum machining parameters in multi pass turning‖, International Journal of Advanced Manufacturing technology, 10, pp. 19–26, 1995.
[8.]Y. C. Shin et al., ―Optimisation of machining conditions with Goon, B. (2005). Effects of excessive drinking on sport participation. Retrieved on 7. 8. 2006, from http://www.excessive_ drinking.com. 30, pp. 2907–2919, 1992.
[9.]M. C. Chen and C. T. Su, ―Optimisation of machining conditions for turning cylindrical
stocks into continuous finished profiles‖, International Journal of Production Research, 36(8), pp. 2115–2130, 1998.
[10.] B. K. Lambert et al., ― The application of geometric programming to machining variable selection‖, International Journal of Production Research, 8, pp. 123– 133, 1970.
[11.] I. Yellowley et al., ―The optimal subdivision of cut in multi pass machining operation‖, International Journal of Material Processing Technology, 27, pp. 1572–1578, 1992.
[12.] Q. Meng et al., ―Calculation of optimum cutting condition for turning operation using a machining theory‖, International Journal of Machine Tool and Manufacture, 40, 1709–1733, 2000.
[13.] A. V. S. R. K. Prasad et al., ―Optimal selection of process parameters for turning operations in a CAPP system‖, International Journal of Production Research, 35, 1495–1522, 1997.
[14.] M. C. Chen et al., ―A simulated annealing approach for optimization of multi-pass turning operations‖, International Journal of Production Research, 34, pp. 2803– 2825, 1996.
International Journal of Research (IJR)
e-ISSN: 2348-6848, p- ISSN: 2348-795X Volume 2, Issue 06, June 2015Available at http://internationaljournalofresearch.org
[16.] 16. R. Gupta et al., ―Determination of optimal subdivision of depth of cut in multi-pass turning with constraints‖, International Journal of Production Research, 33(9), 2555–2565, 1995.
[17.] J. A. Arsecularatne et al., ―Optimum cutting conditions for turning components‖, Proceedings of Institution of Mechanical Engineers, 206, pp. 15–31, 1992.
[18.] R. Saravanan et al., ―Comparative analysis of conventional and non-conventional optimisations techniques for CNC turning process‖, International Journal of Advanced Manufacturing Technology, 17, pp. 471–476, 2001.
[19.] D. Y. Jang and A. Seireg, ―Machining parameter optimisation for specified surface condition‖, Journal of Engineering for Industry, 114, pp. 254–256, 1992.
[20.] Kalyanmoy Deb, ―Optimizations for engineering design – Algorithm and examples‖, Prentice-Hall of India, New Delhi, 1996.
[21.] Sinumeric System 810T Operator’s Manual. Siemens – HMT,1987.
Abhishek Agrawal