DOI: http://dx.doi.org/10.26483/ijarcs.v8i9.4734
Volume 8, No. 9, November-December 2017
International Journal of Advanced Research in Computer Science
RESEARCH PAPER
Available Online at www.ijarcs.info
© 2015-19, IJARCS All Rights Reserved 4
ISSN No. 0976-5697
IMPROVING THE PERFORMANCE OF A CLASSIFICATION BASED OUTLIER
DETECTION SYSTEM USING DIMENSIONALITY REDUCTION TECHNIQUES
Kurian M. J
Research Scholar , Research and Development Centre ,Bharathiar University ,Coimbatore.
Dr. Gladston Raj S
Head of Department of CS, Govt. College, Nedumangadu Trivandrum, Kerala, India.
Abstract: The basic concept of the classification based outlier is to train a model which separate outliers from normal data. The medical cancer dataset is used for the application of classification based anomaly detection. With the comparison of C4.5 and Decision Tree classification algorithms, it is clear that K-Neighborhood algorithm is more suitable for the identification of outliers in terms of f-score, error rate and accuracy. Also the time taken for identification of outlier using KNN is less than that of C4.5 and Decision Tree. In this work, the classification performance for the identification of outlier is measured using dimensionality reduction algorithms like PCA, KPCA and LPP, and the result reveals that the influence of dimensionality reduction on the cancer dataset is very much enhanced the classification performance to a significant level.
Keywords: Outlier detection, Classification, accuracy, KNN, C4.5, Decision tree
I.
I
NTRODUCTIONOutliers may be significant items, which represent the general characteristic of the object. This work aims to study the performance of classification algorithms for outlier detection using dimensionality reduction. Before the elimination of items, one should study the relevance of item in the dataset
In high dimensional data set, some attributes may be irrelevant. But by using feature selection approaches such as filler and wrapper, we have to find out the subset of the original attributes.
Problem Specification
The identification of outlier can be viewed as classification problem which can lead to the discovery of unexpected knowledge in the medical field. The general idea is to train a classification model that can distinguish normal data from outliers [1].
In medical cancer dataset, the available number of malignant/outlier samples are less than that of the normal/benign and it causes an inaccurate classifier model. Many solutions like factor analysis and principle component methods were suggested to improve the efficiency of the algorithm with the elimination of variables .This method proposes to use dimensionality reduction and feature selection algorithms to overcome the training performance and testing accuracy issues in the classification based outlier detection approaches.
II.
M
ODELINGC
LASSIFICATIONB
ASEDO
UTLIERD
ETECTIONS
YSTEMThe popular methods of outlier detection are supervised, semi supervised, unsupervised proximity-based methods . The Grubb’s test identifies one outlier at a time in a univariate data. The Rosener’s test is a sequential procedure for detecting maximum of ten outliers. So there is a need of
more sophisticated and speedy method known as classification based outlier detection, which heavily depends on the quality and availability of training data set.
A. Algorithm for dimensionality reduction
The number of variables used to describe an object is known as the dimensionality of that object. The dimensionality reduction is the search for a subset of features to describe the original dimension.
(a). Principal Component Analysis
Principal Component Analysis is used to leaving out the data which is of the least important to the information stored in the data set. It compresses an N- dimensional vector to M-dimensional vector, where M<N.
(b).Kernel PCA.
Kernel PCA is a technique for extracting non-linear mappings that maximize the variance in the data.
(c).LPP (Locality Preserving Projection)
LPP is a classical linear technique which projects the data along the directions of maximal variance by calculating the optimal linear approximations to the eigen functions of the Laplace beltrani operator on the main fold.
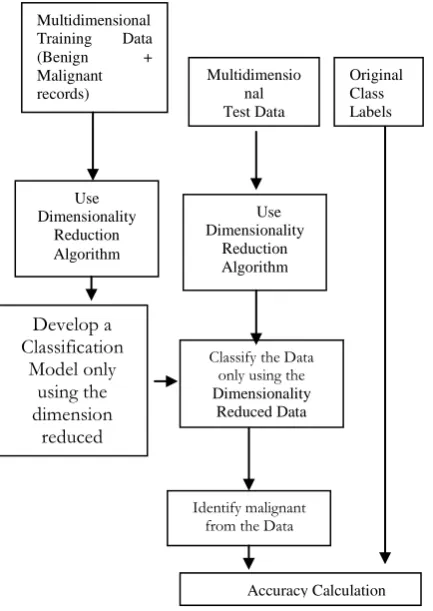
B. The Model of Dimensionality Reduction
© 2015-19, IJARCS All Rights Reserved 5
Figure 1: The Classification Based Outlier Detection System
Chi Square, Information Gain, & Gini Index are the three feature selection methods, which are used and evaluated in
this work.
C. Algorithms used for Classification
a) C4.5 Classifier
C4.5 classifier is a tree based approach which creates a tree model by using values of only one attribute at time.
b) DT Classifier
It is a predicative modeling tool that identifies the most important attributes by hierarchical breakdown of the data.
c) K-NN Classifier
K-Nearest Neighbors is a method to assign the input instance to the class with the majority of K- Nearest Neighbors by considering the Euclidean distances between two instances.
III.
THEA
SSESSMENTThe efficiency of the classification algorithms under evaluation were tested with “Wisconsin Breast Cancer Database”
Breast cancer dataset
Breast cancer dataset (Wisconsin Breast Cancer Database) took from the UCI online machine-learning repository at http://www.ics.uci.edu/~mlearn/MLRepository.html.
The WBCD dataset is summarized in Table 1 and it comprises of 699 instances taken from fine needle aspirates (FNA) of human breast tissue. The class is dispersed with 444
(65.0%) benign samples and 239 (35.0%) malignant samples (Tan et al 2003).[16][17][20]
Table1. Summary of the WBCD dataset
Attribute Possible values
Clump thickness Integer 1–10
Uniformity of cell size Integer 1–10
Uniformity of cell shape Integer 1–10
Marginal adhesion Integer 1–10
Single epithelial cell size
Integer 1–10
Bare nuclei Integer 1–10
Bland chromatin Integer 1–10
Normal nucleoli Integer 1–10
Mitoses Integer 1–10
Class Benign (65.5%),
Malignant (34.5%)
Metrics Used For Assessment
Random index and Run time are two events for assessing the algorithm under consideration. The total run time is the total time taken for training and testing, but this model focus on the time taken for training which is more than the time taken for testing.
Assessment of Performance
a) Confusion Matrix
[image:2.595.299.542.91.300.2]A Confusion matrix reveals the type of classification error a classifier produced. The advantage of using this matrix is that it not only tells us how many got misclassified but also what misclassifications occurred.
Figure 2: A confusion matrix.
Predicted Class
Positives Negatives Actual Class
RP WN Positives
WP RN Negatives
The breakdown of a confusion matrix is as follows:
RP –the number of positive examples correctly classified (Right Positives –RP)
WN- the cases are those belong to a class but were did not allocated to it (Wrong Negatives -WN)
WP - the cases are those did not belong to a class but were allocated to it (Wrong Positives –WP).
RN - the number of negative examples correctly classified (Right Negatives –RN).
The performance of the algorithm is measured with metrics Sensitivity, Specificity, Accuracy, Precision, F-score, Error rate and CPU time.
Sensitivity = RP/ (RP +WN)
Specificity = RN/ (RN +WP)
Multidimensional Training Data
(Benign + Malignant
records)
Identify malignant from the Data
Accuracy Calculation Classify the Data
only using the
Dimensionality Reduced Data Multidimensio
nal Test Data
Develop a Classification
Model only using the dimension
reduced
Original Class Labels
Use Dimensionality
Reduction Algorithm
Use Dimensionality
© 2015-19, IJARCS All Rights Reserved 6
Error Rate = (T – C) /T, The test data has total of T objects and C of the T objects are correctly classified.
b) Validation Methods
The validation method used in this work is K-fold cross validation. The data set is partitioned into K- disjoint subsets of almost equal size. One of the subsections is treated as the test set and the classifier is built with residue. The accuracy is estimated with the test set. The procedure is done recurrently k times so that each subsection is treated as a test subset only once. One of the K-subset is used as a test set and remain K-1 subsets are put together to form a training set. Thus each data point gets a chance to be in a test set only once.
In the first iteration, the subgroup c2,…,ck, jointly served as a
training set while c1 is treated as test set for the first model.
The second iteration is trained with subsets c1, c3,…,ck and
tested on c2: and so on[20].
About the Implementation
The proposed outlier detection software is established with Matlab version 7.4.0 (R2007a) and uses some of the features of Weka with Matlab interface code. The Mex and Java interface of Matlab is used to implement this outlier detection software. The standard weka implementation of the classification algorithms are used here and the default parameters are passed while invoking the classifier algorithms [20].
IV.
THER
ESULTS ANDD
ISCUSSIONIn the second plot clearly shows that the benign records are grouped together and form a distinct cluster. The red points that are deviating from the black cluster are the outliers which signify the malignant nature of that case[16][17][20].
[image:3.595.149.462.318.511.2]Each table cell value is the average of 100 separate runs with different training and testing data sets because each one is an average of 10 trials and in each trail had a10-fold validation.
Figure 3: The Plot of WBDC Data Shows the Benign Cluster and Malignant Outliers[20]
Table 2 - The Performance of Outlier Detection with different Feature Dimensionality Reduction Algorithms and Classification Algorithms
Algorithm Precision
%
F-Score
%
Sensitivity %
Specificity %
Accuracy
%
Error Rate %
C4.5 Classifier 96.18 95.82 95.58 92.60 94.53 5.47
PCA + C4.5 Classifier
99.45 97.90 96.41 98.99 97.29 2.71
kPCA + C4.5 Classifier
99.07 96.24 93.62 98.24 95.28 4.72
LPP + C4.5 99.20 97.75 96.38 98.57 97.13 2.87
[image:3.595.72.522.594.768.2]© 2015-19, IJARCS All Rights Reserved 7
PCA + Decision Table
99.61 97.90 96.28 99.15 97.31 2.69
kPCA + Decision Table
99.19 96.79 94.58 98.47 95.94 4.06
LPP + Decision Table
99.39 97.64 96.15 9562 96.97 3.03
k- Neighbourhood 96.07 96.66 97.31 92.23 95.57 4.43
PCA + k-Neighbourhood
96.65 96.83 97.07 93.69 95.85 4.15
kPCA + k-Neighbourhood
95.25 94.38 93.66 91.08 92.75 7.25
LPP + k-Neighbourhood
96.89 97.20 97.57 94.23 96.37 3.63
The Effect of Dimensionality Reduction Algorithms
This experiment reveals the outlier detection performance with different number of dimensionality reduction algorithms
as well as different feature sets. But it is clear that if the number of dimension as 5, then it will be sufficient to represent the whole data and hence produced good results. So, there is a significant improvement in performance.
[image:4.595.74.523.55.245.2]The sensitivity or recall measures the proportion of actual malignant records that are correctly identified as outliers. As shown in the graph, with respect to sensitivity or recall, the proposed PCA+C4.5 and proposed PCA+ Decision Table classifiers performed well.
Figure 4: The Sensitivity/Recall Chart
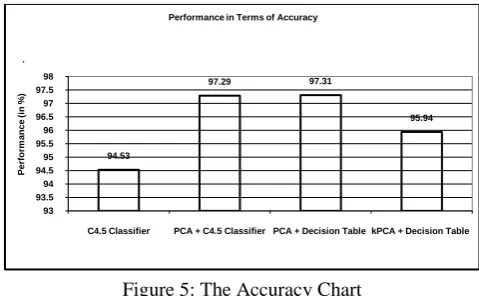
[image:4.595.311.554.322.435.2]The accuracy measures the capability of the algorithms to correctly identify the normal as well as outliers in the data. As shown in the graph, with respect to accuracy, the proposed PCA +C4.5 and proposed PCA+ Decision Table classifiers performed better than others.
Figure 5: The Accuracy Chart
. As shown in the graph, with respect to f-score , the proposed PCA + C4.5 and of the proposed PCA + Decision Table classifiers performed well.
Figure 6: The F-Score Chart
[image:4.595.44.286.382.498.2]In this case, error rate measures how much the algorithm wrongly identify both the normal as well as outliers in the data. The lower value of error rate signifies that proposed PCA+C4.5 and proposed PCA+Decision Table classifiers are making less error while identifying the malignant as well as outlier data.
Figure 7: The Error Rate Chart
The specificity measures the proportion of normal records that are correctly identified and the graph is shown below.
Figure 8: The Specificity Chart
95.58 96.41 96.28 94.58 93.5 94 94.5 95 95.5 96 96.5 97
C4.5 Classifier PCA + C4.5 Classifier PCA + Decision Table kPCA + Decision Table
P er fo rm an ce (i n % ) .
Performance in Terms of Sensitivity
94.53 97.29 97.31 95.94 93 93.5 94 94.5 95 95.5 96 96.5 97 97.5 98
C4.5 Classifier PCA + C4.5 Classifier PCA + Decision Table kPCA + Decision Table
P er fo rm an ce (i n % ) .
Performance in Terms of Accuracy
95.82 97.9 97.9 96.79 94.5 95 95.5 96 96.5 97 97.5 98 98.5
C4.5 Classifier PCA + C4.5 Classifier PCA + Decision Table kPCA + Decision Table
P er for m a nc e (i n % ) .
Performance in Terms of F-Score
5.47 2.71 2.69 4.06 0 1 2 3 4 5 6
C4.5 Classifier PCA + C4.5 Classifier PCA + Decision Table kPCA + Decision Table
P er fo rm an ce (i n % ) .
Performance in Terms of Error-Rate
92.6 98.99 99.15 98.47 88 90 92 94 96 98 100
C4.5 Classifier PCA + C4.5 Classifier PCA + Decision Table kPCA + Decision Table
P er fo rm an ce (i n % ) .
[image:4.595.311.554.511.624.2] [image:4.595.44.284.593.741.2]© 2015-19, IJARCS All Rights Reserved 8
[image:5.595.310.566.55.359.2]The following bar chart shows the performance of the algorithm in terms of precision.
Figure 9: The Precision Chart
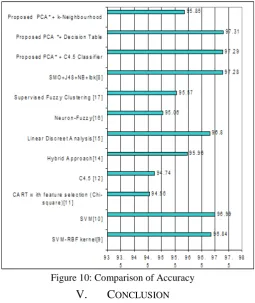
[image:5.595.40.282.80.181.2]The table reveals the comparison previous results with this work. * The First Five Principal Components are used for classification
Table 1 - The Comparison with Recent Works
Sl N
o
Classifiers Classification accuracy
1 SVM-RBF kernel[9] 96.84%
2 SVM[10] 96.99%
3 CART with feature selection (Chi- square)[11]
94.56%
4 C4.5 [12] 94.74%
5 Hybrid Approach[14] 95.96%
6 Linear Discreet Analysis[15] 96.8%
7 Neuron-Fuzzy[16] 95.06%
8 Supervised Fuzzy Clustering [17]
95.57%
9 SMO+J48+NB+Ibk[8] 97.28%
10 Proposed PCA* + C4.5 Classifier
97.29%
11 Proposed PCA *+ Decision Table
97.31%
12 Proposed PCA* + k-Neighborhood
95.85%
Figure 10: Comparison of Accuracy
V.
C
ONCLUSIONThe performance of outlier detection using dimensionality reduction algorithm is executed with Mathlab and outlier detection software. The result illustrates that the influence of the algorithm on the cancer dataset is considerably high and increases the whole classification performance.
The excellent outlier detection performance of the proposed PCA+C4.5 classifier and proposed PCA + Decision Table classifier algorithm reveal that a classification algorithm will be capable of perfectly identifying the multidimensional outlier data in its subspace.
The upcoming work may address the chance of improving the performance of classification algorithm using a good distance metric.
VI.
R
EFERENCES[1] Jiawei Han, Micheline Kamber and Jian Pei, "Data Mining Concepts and Techniques (Third Edition)", Morgan Kaufmann Publishers is an imprint of Elsevier, c 2012 by Elsevier Inc.
[2] T.Santhanam a, M.S. padmavathi B “Application of K-means and Genetic algorithms for Dimension reduction by integrating SVM for diabetes Diagnosis” Procedia Computer Science 47(2015) PP 76-83.
[3] Raneet Kaur, Sarbjeet Singh “A Survey of Data mining and Social Network Analysis based Anomaly Detection Tecniques” Egyptian Informatics Journal Volume 17 Issue 2 July 2016 Pages 199-216.
[4] Zhijun Zheng “Analysis and Comparision of Dimensional Reduction Based on capture data” Asia-Pacific Conference on wearable Computing System, 2010.
[5] C.R..Rao “Data Mining and Visualization” 2nd
Edition 2015.
[6] Aditya Shrivastava ,Mukesh Baghal,Hitesh Guptu “ A Review of Intrusion Detection Techniques by Soft -Computing and Data Mining Approach ”,IJACR Volume 3-No.3,Issue 12, 2013
[7] Wing W.Y.NG, Daniel S.Yeung, Michael Firth,Eric.C.C.Tsang, Xi-Zhao Wang “Feature selection using localized generation 96.18
99.45 99.61 99.19
94 95 96 97 98 99 100
C4.5 Classifier PCA + C4.5 Classifier PCA + Decision Table kPCA + Decision Table
P
e
rf
or
m
a
nc
e
(i
n %
)
.
[image:5.595.30.283.283.629.2]© 2015-19, IJARCS All Rights Reserved 9 error for supervised classification problems using RBFNN”
Elsevier Dec.2008.
[8] Shikha Agrawal,Jitendra Agrawal , “Survey on AnomalyDetection using Data Mining techniques@ procedia Computer Science Volume 60,2015, PP 708-713.
[9] Gayathri Devi S. “ Breast Cancer prediction System using Feature Selection and Data Mining Methods” IJARCS, Vol 2. No.1(2011)
[10] Deepika Dave, Dr. R.K. panday, prof.Vineet Ricdhariya “ A Novel approach for Intrusion Detection using KNN classification and DS-Theory” IJARCS, Vol 2 No.3(2011)
[11] Punamchand M. Mahajan ,Dr. Satish .R.Kolha,Dr. Pradeep M. Patil “ Defect detection in tecture using statistical Approach and principle Component Analysis”, IJARCS ,Vol 2 No. 2(2011)
[12] D. Napolean, S. Pavalakodi “An effective method of Dimensionality Reduction for High dimensional Datasets using PCA” IJARCS,Vol2 No.2 (2011).
[13] Viek Sharma ,Prof. Sadhna Mishra “classification of web users into interested users and non-interested users by using Decision Table” IJARCS Vol3. No 4 (2012)
[14] Niketa V.Kadam “Cluster based and distance based Approach for Outlier Detection” IJARCS Vol 4. No. 2 (2013).
[15] Ch. Nagamami ,Dr. Ch. Suneetha “ A Survey for Outlier detection and its strategies” , IJARCS , Vol 6 No. 3(2015).
[16] Kurian M.J, Dr. Gladston Raj S. “Outlier Detection in Multidimensional Cancer Data using Classification Based Approach” International Journal of Applied Engineering Research (IJAER) Vol. 10, No.79, pp (342 -348) 2015
[17] Kurian M.J, Dr. Gladston Raj S. “An Analysis on the Performance of a Classification Based Outlier Detection System using Feature Selection” International Journal of Computer Applications (IJCA) Vol.132.No.8. December 2015.
[18] Meraj Nabi, Abdul Wahid, Pradeep Kumar “Performance Analysis of Classification Algorithms in Predicting Diabetes “ IJARCS, Vol 8. No.3 (2017)
[19] Harshada chandrakant Mandhore , Sonali R. Iadate “Comparative Analysis with implementation of Cluster based, Distance based and Density based Outlier Detection Technologies using different Healthcare datasets” IJARCS ,Vol 8 No.5(2017)
![Figure 3: The Plot of WBDC Data Shows the Benign Cluster and Malignant Outliers[20]](https://thumb-us.123doks.com/thumbv2/123dok_us/680331.1075350/3.595.72.522.594.768/figure-plot-wbdc-shows-benign-cluster-malignant-outliers.webp)