ISSN: 2319-8753
I
nternational
J
ournal of
I
nnovative
R
esearch in
S
cience,
E
ngineering and
T
echnology
(An ISO 3297: 2007 Certified Organization)
Vol. 3, Issue 12, December 2014
Spatial Filter Optimization Using Gaussian
Kernel for Single Electro- Encephalo Gram
(EEG) Trial Classification
Aarti Bhalla
1Doctorate Student, School of Computer and Systems Sciences, Jawaharlal Nehru University, Delhi, India1
ABSTRACT: Brain Computer Interfaces (BCI) enable people suffering from Amyotrophic Lateral Sclerosis (ALS) or severe paralysis to communicate and control using only brain signals. These signals are captured from EEG, that is relatively cost effective and non invasive. Raw EEG signals are subject to processing and feature extraction for automating the detection of changes in the amplitude of the brain signals due to imagining of a limb motion and to enable classification. The processed signal is analysed using machine learning tool and translated into interpretable form. In this manuscript, we propose an advanced feature extraction method utilizing spatial characteristics (channel information) of an EEG signal. The method maximizes inter class variance and minimizes intra class variance among the optimized spatial features to facilitate classification. Kernel based Fisher’s criterion is used for Spatial filtering which transforms the data into a suitable feature space for classification. This approach overcomes the limitation of the existing Fisher based Common Spatial Patterns and performs better in general. Experimental results on BCI Competition datasets demonstrate the effectiveness of this methodology in terms of accurate classification, in comparison to the other method.
KEYWORDS: Brain Computer Interfaces, Mental tasks, Feature Extraction, Fisher’s Common Spatial Patterns, kernel, Fisher’s criterion.
I. INTRODUCTION
Controlling the world with the mind has always been a dream of humanity. Establishing direct communication between the brain and computer has been an agenda of scientific research for a long time. Brain is one of the most vital organs of human body, which controls the co-ordination of human muscles and nerves (Wang et al., 2011). The brain consists of complex structure of billions of neurons for carrying out various body organ functions, movements, control and communication. It also receives stimulus from various sense organs and sends responses through neural pathways to these sense organs. Communication is a basic human need which involves more than just speaking and listening. But severe neurological diseases such as amyotrophic lateral sclerosis (ALS), brain stem stroke, focal epilepsy, locked-in condition etc. restrict a person’s ability to communicate emotions, thoughts and basic needs. Such patients in nearly vegetative state usually have active brain regions with normal brain activities. These people rely on alternative ways of communication. Processing and analysing bio-signals using software techniques are playing role since 1960s to provide physicians with fast and accurate means of diagnosis (Gandhi et al., 2011). The research works (Licklide, 1960, Engelbart, 1962) have emphasized the potential of a symbiotic relation between human and computer.
ISSN: 2319-8753
I
nternational
J
ournal of
I
nnovative
R
esearch in
S
cience,
E
ngineering and
T
echnology
(An ISO 3297: 2007 Certified Organization)
Vol. 3, Issue 12, December 2014
Biology, Mathematics, Engineering, Physiology, Psychology and Computer Science. Due to improved understanding of functioning of the brain, low-cost computing devices, and advancement in signal processing techniques, the field of BCI has received a great interest in the past 20 years.
Among various existing techniques of brain signal acquisition, electro- encephalo gram (EEG) is the most commonly used. EEG signal is a complex mixture of brain signals emitted from different cortices of the brain (Wolpaw et al, 2012) and is often corrupted with artifacts i.e. ElectroOculoGraphic (EOG), ElectroMyoGraphic (EMG) activity etc. and external noise. These signals taken raw are unable to capture a person’s mental state as they are inherently filtered through several brain layers both spectrally and temporally.
Raw EEG signals have a weak spatial resolution due to volume conduction. This becomes a problem when the relevant signals are weak while in the same frequency band, other sources produce strong signals. The extraneous components need to be eliminated for attaining improvised signal.
Common Spatial Pattern(s) (CSP) is used to quickly estimate relevant information from the data related to oscillatory processes. It has been applied for detection of major brain rhythm modulations (e.g. mu, beta), e.g. related to stress/ relaxation, sensory-motor imagery, workload aspects, visual processing vs. idling and other idle-rhythm-related problems, or thought recognition. The CSP algorithm exploits features such as event-related synchronization and desynchronization localized in the (sensory-) motor cortex.
Given the recordings from two class distributions, the aim of CSP algorithm is to find spatial filters (directions) which have maximum variance for one class and minimum variance for the second class simultaneously. It is stepwise implemented as signal (pre-) processing (spatial/spectral filtering) followed by feature extraction and machine learning. A frequency filter is applied first, followed by spatial filter, followed by log-variance feature extraction and lastly a classifier applied to the extracted features. With spatial filtering, the original channels are mapped down to a small number of channels (usually 4-6) having maximally informative variance w.r.t. to the prediction task. The CSP filters can be computed from the covariance matrices of each class by solving a generalized eigenvalue problem.
CSP is simpler to implement, faster to execute and robust. A priori specification of individualized frequency bands is not required. However, these bands must be known for methods like band-power and frequency-estimation (Guger et al 2000b). CSP achieves satisfactory result for synchronous (cue based) BCIs but is less effective for asynchronous BCIs (Nicolas-Alonso et al., 2012). The time related variations and correlation among frequency bands in the signal are not captured by the CSP method. The working of CSP depends on spatial resolution since it utilizes many electrodes for enhanced performance (Pfurtscheller et al 2000, Guger et al 2000b). The electrode positions must remain unchanged across all trials and sessions for CSP method to give genuine results (Ramoser et al 2000).
A major drawback in the CSP application is that it is highly sensitive to artifacts and noise in the EEG. The CSP filters are calculated from the covariance matrix of an EEG trial having large number of channels with contrastingly small samples. A trial containing artifacts can severely modify the filters (Guger et al 2000b, Ramoser et al 2000). According to the ‘curse of dimensionality’, as variables are added, the data space becomes increasingly sparse (Bellman, 1961). The CSP method uses a weak optimization function that does not ensure that all spatial filters are useful. It results in mapping of the EEG signal into spaces that may not lead to appropriate discrimination by the corresponding features. Therefore the selection of a small number of spatial filters is important for overcoming the curse of dimensionality to encapsulate all of the relevant information.
ISSN: 2319-8753
I
nternational
J
ournal of
I
nnovative
R
esearch in
S
cience,
E
ngineering and
T
echnology
(An ISO 3297: 2007 Certified Organization)
Vol. 3, Issue 12, December 2014
Section 2 discusses the functioning of CSP and some related methods. Section 3 showcases our proposed method. Section 4 briefly explains the datasets and experimental framework. Section 5 analyses the comparison results. A brief conclusion is drawn up in the last section.
II. RELATED WORKS
Common Spatial Pattern (CSP) (Muller-Gerking et al., 1999) is one of highly successful supervised signal enhancement techniques which estimate spatial filters to analyse multichannel data. A matrix notation is suitable to represent the EEG signal. Let 𝑿𝟏𝒊 and 𝑿𝟐𝒊 be the raw EEG data of trial i having dimensions 𝑁 × 𝑇 where 𝑁 denotes
number of electrodes and 𝑇 denotes number of samples in time for class 1 and 2 respectively. The covariance matrices of class 1 and 2 are given as
∑𝟏𝒊 = 𝑿𝟏𝒊 𝑿𝒊𝟏/ 𝒕𝒓𝒂𝒄𝒆 (𝑿𝟏𝒊𝑿𝟏𝒊 𝑻) and ∑𝟐𝒊 = 𝑿𝟐𝒊 𝑿𝟐𝒊/ 𝒕𝒓𝒂𝒄𝒆 (𝑿𝟐𝒊𝑿𝟐𝒊 𝑻) respectively.
The normalized covariance matrices averaged over trials of class 1 and 2 are given as
∑𝟏 = < ∑𝟏𝒊 > Trials and ∑𝟐 = < ∑𝟐𝒊 > trials (1)
A matrix W and diagonal matrix 𝑫 with elements in [0, 1] is determined to maximize
𝐖∑𝟏𝑾𝑻= 𝑫 Such that 𝑾(∑𝟏 + ∑𝟐 )𝑾 𝑻= 𝑰 (2)
The rows of matrix 𝑾 are the spatial filters, whereas the columns of matrix 𝑾−𝟏 are common spatial patterns. Using
this projection matrix 𝑾 the EEG recordings 𝑿𝟏𝒊 are decomposed into
𝒁𝒊 = 𝑾 𝑿𝟏𝒊 (3)
A large corpus of CSP-based approaches aim at achieving enhanced control over spectral filtering. Several other methods exist to adapt the spectrum to a process of interest, among others common spatio-spectral patterns, common sparse spectral spatial pattern, r^2-based heuristics, automated parameter search, and manual selection based on visual inspection. Several of these methods have been shown to give approx. comparable results. An alternative and competitive method, especially when there are complex interactions between frequency bands and time periods are to be modelled is the dual-augmented Lagrange paradigm which learns both spatial filters and their relative weightings in a unified cost function.
The common spatio-spectral pattern (CSSP) filter is an extension of the CSP filter (Lemm et al., 2005) that involves time delay embedding. The CSSP's transform is given by:
𝒁 = 𝑾𝑿 + 𝑾𝝉 𝑿𝝉=𝑾
𝑿
𝑿𝝉 (4)
Where, 𝑾 = [W Wτ] is a CSSP matrix in which the number of channels get doubled. However, it requires choice of a
frequency band and hyper-parameter τ which is difficult to adjust. In order to overcome this, Novi et al. (2007) used sub-band CSP filters with different non overlapping frequency bands and combined their output linearly. This model does not require prior knowledge of frequency bands and fine tuning of hyper-parameters.
In Filter-Bank CSP (Ang et. al, 2008), a set of CSP filters is learned for each of several time/frequency filtering methods, followed by log-variance feature extraction. The extracted features are concatenated over all selected spectral filters before machine learning. Due to the problem of over fitting, even though FBCSP cannot replace CSP yet it is beneficial for oscillatory processes having different spatial topographies, jointly active in different frequency bands. For a given prediction task i.e. recognizing complex event-related dynamics in response to a stimulus, their concerted behaviour must not be ignored. With filter-bank CSP capturing oscillations in various time windows rather than frequency windows is possible. In a scenario involving workload measurements, it can deduce relevant interactions between frequency bands e.g. mu/alpha.
ISSN: 2319-8753
I
nternational
J
ournal of
I
nnovative
R
esearch in
S
cience,
E
ngineering and
T
echnology
(An ISO 3297: 2007 Certified Organization)
Vol. 3, Issue 12, December 2014
This method performs optimization of spectral and spatial filters in two different stages and subsequently extracts log-variance features from the processed signal. These features are then fed to a classification algorithm such as, LDA. SpecCSP (Tomioka et al., 2007) optimizes power spectrum weights at each time point and spatial filtering is done with CSP, in iterative manner. It incorporates non homogenous weighting of cross-spectrum matrices. By focussing on certain frequency bands i.e. alpha band, the parameters such as frequency prior and the spectral filter can be tuned to extend the considered spectrum to high-gamma oscillations. One can also adapt the time window of interest and the learner component (e.g., a good alternative choice being logistic regression). The drawback of this method is that spectral filters obtained have finite number of parameters thus they are not very precise spectral filters. Moreover, the spatial filtering is done by CSP which uses only distance between the class means and is silent about within class variances which too are indispensable for classification (D. Fattahi et al., 2013).
Fisher CSP
To overcome the shortcomings of CSP method, D. Fattahi et al. (2013) have promulgated a spatial filtering method that uses a different target function to maximize, i.e. Fisher’s discriminant criterion:
𝐽𝑐 𝒘 =
𝑚1−𝑚22
𝜎12−𝜎22 (5)
where 𝑚1 and 𝑚2 are the mean and 𝜎1 and 𝜎2 are the variance of the features of class 1 and class 2 respectively. The
features fi are log of variance of the spatially filtered signal using w.The FCSP optimization function maximizes inter-classes variances and minimizes intra-class variances, thus leading to better discrimination among the features than the CSP. To solve the optimization problem with linear constraints, they have zero average correlation among the source signals for selecting subsequent filters. FCSP method is robust against noise and outliers and in most likelihood will not overfit. Although this method based on the principle of Linear discriminate Analysis (LDA) is suited for linearly separable data, it however becomes incompatible for highly skewed and non-linear, real world data such as EEG. Such data cannot be simply classified in a linear fashion. Secondly, lower order statistical estimates e.g mean and scatter matrices calculated with small samples and high dimensionality will lead to high bias and high variability, for which regularisation is required. Lastly, the method relies heavily on assumptions such as having normal distribution and equal covariance structure for all classes which are not true in many applications [Mika et. al.,1999]. So a more sophisticated and non linear classification method need to be employed so that the features could be first transformed into an appropriately discriminative space and then classified by an optimal hyper plane in that space. Methods such as Kullback Leibler CSP [M. Arvaneh et. al, 2013] and stationery CSP [Fattahi et. al, 2013] have been proposed in literature that penalize the non linearities in the data by incorporating a regularization term besides the CSP target function.
III. PROPOSED METHOD
For most real world data, a linear discriminant has less expressiveness as it is not complex enough. Here, a non linear feature extraction method on the basis of Fisher’s discriminate is proposed. The method utilizes the kernel trick (S. Mika et al., 1999) for efficiently determining fisher discriminate features. This flexible approach involves dot-products of the training patterns, i.e., k(x,y) = (Φ(x).Φ(y)) which can be efficiently computed. This has, in fact, the same effects of a non linear mapping Φ to some high dimensional feature space F. In this method, the parametric estimates of class conditional distributions are replaced by a non-parametric kernel estimate without any explicit mapping to F.
In order to find a spatial filter w using linear discriminant in the kernelized feature space, maximize
J(
w
)=
(𝜇1 𝜑−𝜇2𝜑)2 (𝜎1𝜑)2+(𝜎
2 𝜑
)2 (6) where 𝜇1𝜑 and (𝜎1𝜑)2 are mean and variance of the features (in kernel space) belonging to class 1 and 𝜇
2 𝜑
and (𝜎2𝜑)2 are
those of the features in kernel space belonging to the other class.
𝑓𝑗𝜑 = 𝑙𝑜𝑔 [𝐸𝑛 𝒘𝑻 𝛷 𝑿
𝑗 = 𝑙𝑜𝑔 [𝒘𝑻(𝛷(𝑿𝑗). 𝛷(𝑿𝑗)𝑇)𝒘] (7)
represents the log energy feature of the spatially filtered signal, where mean of features
𝜇𝑐
𝜑
= 1
𝑛𝑐∑ 𝑓𝑗
𝜑 𝑛
𝑗 =1 𝑦𝑗=𝑐
ISSN: 2319-8753
I
nternational
J
ournal of
I
nnovative
R
esearch in
S
cience,
E
ngineering and
T
echnology
(An ISO 3297: 2007 Certified Organization)
Vol. 3, Issue 12, December 2014
(𝜎𝑐
𝜑
)2= 1
𝑛𝑐∑ (𝑓𝑗 𝜑
−
𝑛 𝑗 =1 𝑦𝑗=𝑐
𝜇𝑐 𝜑
)2, variance of features for c Є {1, 2}. (9) The optimization function J(w) is computed in the kernelized feature space F (which is non-linearly related to input
space). Initial values of the filters w can be derived by applying standard CSP method. These filters are updated such that they maximize between class variance and minimize within class variance while average correlation between the spatially filtered signals is zero. An optimal hyperplane in the feature space can be found by using all the training samples, not only the difficult ones as in SVMs. This approach provides a simple closed form solution with theoetically sound interpretation.
Due to the possibilities of a large number of non-linearities in real world data, several choices of the kernel k, exist that capture such non-linearities e.g. Gaussian RBF, polynomial kernel etc. We use Gaussian kernel, k(x,y) = exp(-||x - y||2 /c) to kernelize the training data, where c is some positive constant.This kernel is a measure of closeness, equal to 1 when the points coincide and equal to 0 at infinity. Optimized Fisher Common Spatial Patterns are found by solving (6) using generalized Eigen- value problem. The method a.k.a Kernel Fisher Common Spatial Patterns (KFCSP) finds those directions in the feature space that are sufficiently discriminative for non linear features by considering both inter and intra classes variances and with zero average correlation among the sources (spatially filtered signals). The aforementioned modification in the existing FCSP method is anticipated to considerably improve the classification accuracy over a wide range of datasets.
It may be noted that the complexity of KFCSP increases with the number of training samples. Suitable optimization algorithms [Fattahi et.al, 2013] are needed to derive the leading eigenvectors of large matrices.
IV. DATASETS AND EXPERIMENTAL SETUP
The first dataset is BCI competition 3 dataset IVa [13] that comprises brain signal values from five healthy subjects. The last dataset was dataset IVb of this competition. The five subjects (‘aa’,’al’,’av’,’aw’,’ay’) were given visual cues for 3.5 s to perform three types of motor imagery i.e. left hand, right hand and right foot movement. For each subject, 280 trials were recorded using Brain Amp devices having 118 EEG channels, measured in accordance with the international 10/20-system. The actual cognitive states for only some right hand and right foot trials are available in a vector whereas the cognitive states for other trials are to be determined by the proposed model.
The second dataset is taken from BCI competition 4 dataset I comprising of motor imagery continuous signals of 59 EEG channels for 7 subjects. For each subject two classes of motor imagery were selected from the three class left
hand, right hand, and foot. The trainingdata was procured by presenting visual stimuli on a computer screen in the
form of arrows. It has complete marker information (labels) that indicates the time points of cue presentation and the corresponding target classes. Some of the data sets were artificially generated.
The continuous two class dataset is converted to epoched dataset with each epoch having certain number of trials. The length of the data epoch and the choice of a frequency band (defaulting to motor imagery time scales and frequency ranges) are the parameters that are most commonly tuned to the task, both of which can also be found via k-fold cross validation search. The main user-configurable parameters are the selection regions in time and frequency and the machine learning component.
ISSN: 2319-8753
I
nternational
J
ournal of
I
nnovative
R
esearch in
S
cience,
E
ngineering and
T
echnology
(An ISO 3297: 2007 Certified Organization)
Vol. 3, Issue 12, December 2014
V. EVALUATION RESULTS
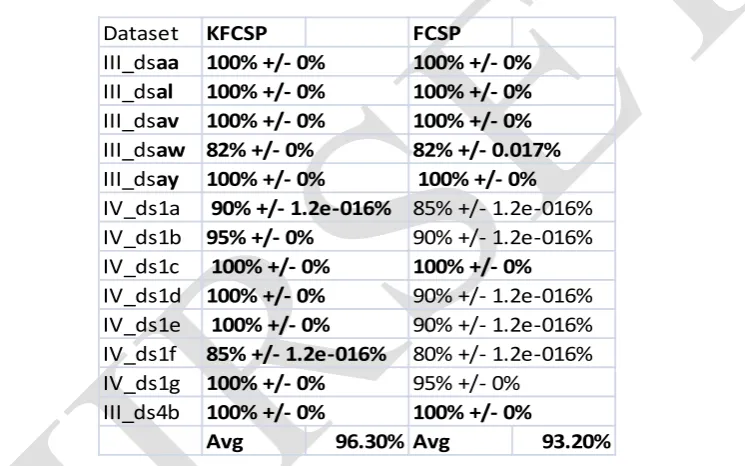
For each of the 3 BCI datasets in table 1, KFCSP is giving better if not equal classification accuracy than FCSP method. KFCSP method gives 100 percent accuracy in 9 out of 13 cases while FCSP method gives 100 percent accuracy in just 6 subjects. For subject ‘aw’, although both these methods are providing the same average accuracy but standard deviation for KFCSP is zero whereas for FCSP it is non-zero. KFCSP has non zero standard deviation in only two out of 13 datasets which indicates that more robust and stable results are obtained with KFCSP as compared to FCSP. This invariance characteristic of KFCSP is highly desirable for BCI systems based on non-stationary and artifact-sensitive real life data such as EEG. It can be undoubtedly attributed to the non linear kernel used for computing KFCSP filters in case of not linearly separable data.
For rest of the datasets KFCSP achieves greater accuracy than FCSP. For subjects ‘1a’,’1b’,’1f’ and ‘1g’, the improvement in classification accuracy is 5% whereas for subjects ‘1d’ and ‘1e’, it comes out to be 10% which is simply twice the former improvement.
Dataset
KFCSP
FCSP
III_ds
aa
100% +/- 0%
100% +/- 0%
III_ds
al
100% +/- 0%
100% +/- 0%
III_ds
av
100% +/- 0%
100% +/- 0%
III_ds
aw 82% +/- 0%
82% +/- 0.017%
III_ds
ay
100% +/- 0%
100% +/- 0%
IV_ds1a
90% +/- 1.2e-016%
85% +/- 1.2e-016%
IV_ds1b
95% +/- 0%
90% +/- 1.2e-016%
IV_ds1c
100% +/- 0%
100% +/- 0%
IV_ds1d
100% +/- 0%
90% +/- 1.2e-016%
IV_ds1e
100% +/- 0%
90% +/- 1.2e-016%
IV_ds1f
85% +/- 1.2e-016%
80% +/- 1.2e-016%
IV_ds1g
100% +/- 0%
95% +/- 0%
III_ds4b
100% +/- 0%
100% +/- 0%
Avg
96.30% Avg
93.20%
Table 1. Comparison results of Fisher CSP and kernel based Fisher CSP techniques obtained by 10 fold cross validation on 3 different datasets for two class motor imagery in terms of average classification accuracy (%) with standard deviation(%). For each dataset, the result for r=6 features is shown. To obtain a fair evaluation statistical test is applied to compare both models. The methods which perform statistically significantly different are highlighted in bold.
ISSN: 2319-8753
I
nternational
J
ournal of
I
nnovative
R
esearch in
S
cience,
E
ngineering and
T
echnology
(An ISO 3297: 2007 Certified Organization)
Vol. 3, Issue 12, December 2014
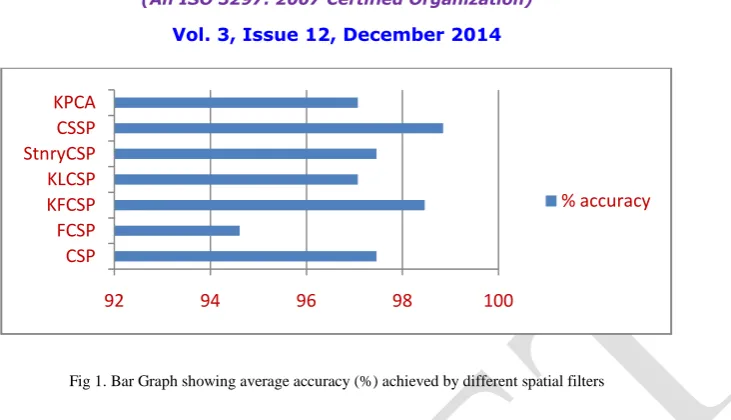
Fig 1. Bar Graph showing average accuracy (%) achieved by different spatial filters
Figure below shows the changes in the classification accuracy for different datasets when the number of filters ‘r’ is varied. For both the methods, the relation between classification accuracy and ‘r’ is not direct. The value of ‘r’ is subject-dependent; KFCSP shows less variation in the classification accuracy as compared to FCSP method by changing ‘r’.
Fig 2(a) Classification accuracy (%) vs number of filters ‘r’ of subjects from BCI competiton 3 dataset IVa for KFCSP method.
Fig 2(b).Classification accuracy (%) vs number of filters ‘r’ of subjects from BCI competiton 3 dataset IVa for FCSP method.
It implies that by filtering the signal with KFCSP filters, not much fine tuning of the parameter is required as good result is obtained for most of values of ‘r’, whereas for filtering the signal with FCSP filters, fine tuning of parameter is
92 94 96 98 100
CSP FCSP KFCSP KLCSP StnryCSP CSSP KPCA
% accuracy
0 20 40 60 80 100 120
1 2 3 4 5 6 7 8 9 10
aa
al
av
aw
ay
0 20 40 60 80 100 120
1 2 3 4 5 6 7 8 9 10
aa
al
av
aw
ISSN: 2319-8753
I
nternational
J
ournal of
I
nnovative
R
esearch in
S
cience,
E
ngineering and
T
echnology
(An ISO 3297: 2007 Certified Organization)
Vol. 3, Issue 12, December 2014
significant which is time consuming. It could be attributed to FCSP’s more weightage attached to the non-relevant cortical areas/channels.
V. CONCLUSION
Brain Computer Interface assists severely physically challenged people to communicate with the help of electroencephalogram (EEG) signal. Features derived from multiple channels result into a large sized feature vector but the available number of samples is small. It may hinder the classifier’s performance for mental task classification. Signal processing and feature extraction to determine a minimal subset of relevant and discriminative features is indispensable before classification of such data. A reduced set of significant features not only decreases the time complexity to learn a model but also reduces the bias of a classifier to estimate error on a specific dataset. In this paper, a novel feature extraction method via kernel trick to non-linearly transform the data and optimize the fisher’s discriminant criterion that maximizes between class variance and minimizes within classes variance simultaneously, thus eliminating some of the drawbacks of standard CSP method. Comparing classification accuracy of the well-known Fisher CSP method with our proposed method over publicly available datasets, demonstrates the superiority of our method in terms of precision and stability.
REFERENCES
[1] Blankertz, B., Dornhege, G., Krauledat, M., Mïller, K., and Curio, G. "The non-invasive Berlin Brain-Computer interface: Fast acquisition of effective performance in untrained subjects." NeuroImage, vol. 37, no. 2, pp. 539-550, 2007.
[2] Blankertz, B., Tomioka, R., Lemm, S., Kawanabe, M., and Mueller, K. R. "Optimizing spatial filters for robust EEG single-trial analysis." IEEE Signal Process Mag, vol. 25, no.1, pp. 41-56, 2008.
[3] Pfurtscheller, G., and da Silva, L. "Event-related EEG/MEG synchronizaion and desynchronization: basic principles." Clin Neurophysiology 110, pp. 1842-1857, 1999.
[4] Buzsaki, G., "Rhythms of the brain" Oxford University Press US, 2006.
[5] Fukunaga K., "Introduction to Statistical Pattern Recognition" Academic Press, Computer Science and Scientific Computing Series, 1990.
[6] Ramoser, H., Gerking, M., and Pfurtscheller, G. "Optimal spatial filtering of single trial EEG during imagined hand movement." IEEE Trans. Rehab. Eng, vol.8, pp. 441- 446, 2000.
[7] Tomioka, R., Dornhege, G., Aihara, K., and Mueller, K.-R. "An iterative algorithm for spatio-temporal filter optimization." In Proceedings of the 3rd International Brain- Computer Interface Workshop and Training Course, 2006.
[8] Tomioka, R., Dornhege, G., Nolte, G., Blankertz, B., Aihara, K., and Mueller K. R "Spectrally Weighted Common Spatial Pattern Algorithm for Single Trial EEG Classification" Mathematical Engineering Technical Reports (METR-2006-40), 2006.
[9] Lemm, S., Blankertz, B., Curio, G., and Muller, K. R."Spatio-spectral filters for improving classification of single trial EEG." IEEE Trans Biomed Eng, vol. 52, no. 9, pp.1541-1548, 2005.
[10] Dornhege, D., Blankertz, B., Krauledat, M., Losch, F., Curio, G., and Muller, K. R. "Combined optimization of spatial and temporal filters for improving brain-computer interfacing," IEEE Transactions on Biomedical Engineering, vol. 53, no. 11, pp. 2274- 2281, 2006.
[11] Ang, K. K., Chin, Z.Y., Zhang, H., Guan, C. "Filter Bank Common Spatial Pattern (FBCSP) in Brain-Computer Interface" IEEE International Joint Conference on Neural Networks (IEEE World Congress on Computational Intelligence), pp. 2390- 2397, 2008.
[12] Onton, J., and Makeig, S. "Broadband high-frequency EEG dynamics during emotion imagination." Frontiers in Human Neuroscience, 2009.
[13] http://sccn.ucsd.edu/wiki/BCILAB, Open Source Matlab Toolbox for Brain-Computer Interface research.
[14] Bell, A. J., and Sejnowski, T. J. "An information-maximization approach to blind separation and blind deconvolution." Neural Comput. 7, pp 1129-1159, 1995.
[15] Hyvaerinen., A. "Fast and Robust Fixed-Point Algorithms for Independent Component Analysis." IEEE Transactions on Neural Networks vol. 10, no. 3, pp 626-634, 1999.
[16] Makeig, S., Palmer, J. A., Delgado, K.K., and Rao, B.D. "Newton Method for the ICA Mixture Model", 33rd IEEE International Conference on