ZZZZZZZZZZZZZZZZZZZZZZZZZZZZ
Rand, Michele
Dorfman
Kann
M.
Lisa
and
Department of Ecology and Evolutionary Biology, Brown University, Providence, Rhode Island 02912
Manuscript received March 11, 1994
Accepted for publication July 21, 1994
ABSTRACT
To test hypotheses of neutral evolution of mitochondrial DNA (mtDNA) , nucleotide sequences were
determined for 1515 base pairs of the NADH dehydrogenase subunit 5 (ND5) gene in the mitochondrial
DNA of 29 lines of Drosophila melanogaster and 9 lines of its sibling species Drosophila simulans. In
contrast to the patterns for nuclear genes, where D . melanogaster generally exhibits much less nucleotide
polymorphism, the number of segregating sites was slightly higher in a global sample of nine ND5 se- quences in D . melanogaster (s = 8) than in the nine lines of D. simulans ( s = 6). When compared to
variation at nuclear loci, the mtDNA variation in D . melanogaster does not depart from neutral expec-
tations. The ND5 sequences in D. simulans, however, show fewer than half the number of variable sites
expected under neutrality when compared to sequences from the period locus. While this reduction in
variation is not significant at the 5% level, HKA tests with published restriction data for mtDNA in D . simu- lans do show a significant reduction of variation suggesting a selective sweep of variation in the mtDNA
in this species. Tests of neutral evolution based on the ratios of synonymous and replacement polymor-
phism and divergence are generally consistent with neutral expectations, although a significant excess of
amino acid polymorphism within both species is localized in one region of the protein. The rate of mtDNA
evolution has been faster in D . melanogaster than in D. simulans and the population structure of mtDNA is distinct in these species. The data reveal how different rates of mtDNA evolution between species and
different histories of neutral and adaptive evolution within species can compromise historical inferences
in population and evolutionary biology.
M
ITOCHONDRIAL DNA is widely used as a geneticmarker in population and evolutionary biology. It is generally assumed that the variation in mtDNA se- quences is neutral with respect to fitness and that the patterns of nucleotide variation can be used to infer the evolutionary histories of populations and closely related species. In recent years several reports have described non-neutral behavior of mtDNA haplotypes in experi-
mental populations (MACRAE and ANDERSON 1988; FOS
et al. 1990; NIGRO and PROW 1990).
As
general tests forthe neutrality of mtDNA, these results have been incon-
clusive either because the experimental design has been
challenged (SINGH and HALE 1990) or because nuclear-
cytoplasmic interactions have been implicated as the ba-
sis for the presumed fitness differences of mtDNAs (Fos
et al. 1990; NIGRO and PROUT 1990). While direct ex-
perimentation will continue to play an important role in
addressing the mechanisms of mitochondrial and
nuclear coevolution, its ability to distinguish between
neutral us. adaptive molecular evolution in the history of
a species remains uncertain (GILLESPIE 1991).
Nucleotide sequence data offer an alternative and po-
tentially more powerful means of testing hypotheses of
neutrality. Here one seeks to infer, from the patterns of
nucleotide polymorphism and divergence, whether the
observed variation is consistent with specific predictions
of the neutral theory of molecular evolution (KIMURA
1983). One such prediction is that the levels of nucle-
Genetics 198: 741-756 (November, 1994)
otide polymorphism within a species will be correlated
with levels of sequence divergence between species ( e . g . ,
HUDSON et al. 1987). An additional prediction of the
neutral theory is that the ratio of synonymous: replace- ment substitutions will be the same within and between
species (MCDONALD and KREITMAN 1991). In Drosophila
a rapidly growing number of nuclear loci has been s u b
jected to these (and other) tests of neutrality ( e . g . ,
KREITMAN and HUDSON 1991; BEGUN and AQUADRO 1991, 1993,1994; BERRY et al. 1991; M A R T I N ~ ~ M P O S et al. 1992;
SCHAEFER and MILLER 1992; LANGLEY et al. 1993). Given
the widespread use of mtDNA in population biology, the
application of these methods to mtDNA sequences seems long overdue.
Because mtDNA does not recombine, it provides an interesting context in which to detect departures from neutral expectations. If an advantageous mutation oc- curred in an mtDNA variant that lead to its fixation in a population, all other polymorphisms on that molecule
would be fixed as a single linkage group (the hitchhiking
effect; MAWARD-SMITH and HAIGH 1974). Evidence for
such a “selective sweep” was recently reported for a re- gion of the fourth chromosome in Drosophila, a part of the genome that generally does not recombine (BERRY
et al. 1991). Similarly, other regions of the Drosophila
genome that experience low rates of recombination
have been shown to exhibit low levels of nucleotide poly-
742 D. M. Rand, M. Dorfsman and L. M. Kann
1991, 1993; MARTIN-CAMPOS et al. 1992; STEPHAN and MITCHELL 1992). While these patterns may be the result of a recent selective sweep of one or more advantageous mutations, background selection against deleterious mutations may also play a role in the reduction of linked neutral polymorphism in regions of low recombination (CHARLESWORTH et al. 1993).
As a first step in testing some of the neutral predic- tions regarding mtDNA, nucleotide sequences were de- termined for 1515 base pairs of the NADH dehydroge- nase subunit 5 (ND5) gene in nine wild lines each of
Drosophila melanogaster and Drosophila simulans from diverse localities around the world and 10 lines each of
D . melanogaster from Arvin, California and Zimbabwe, Africa. The ND5 gene was chosen because it is the long- est protein coding gene in mtDNA and is one of the most divergent genes between
D.
melanogaster and Drosoph-ila yakuba (GARESSE 1988). Under neutrality, one would predict that this gene would be more variable within species which would provide the best opportunity in a coding region to detect the loss of variation from a po- tential selective sweep.
The data provide no evidence for departures from neutral mtDNA evolution in the samples of D . melano- gaster. In contrast, the levels of variation in the ND5 gene of
D.
simulans are Iower than expected. Although the current sequence data fail to reject neutrality at the5 % level, an analysis of existing restriction enzyme data
(HALE and SINGH 1991b; SOLIGNAC et al. 1986) does re-
veal significantly less variation in D. simulans than ex-
pected under neutrality. Tests of the ratio of synony- mous and replacement substitutionswithin and between species (MCDONALD and KREITMAN 1991) fail to reject neutral mtDNA evolution except in a very localized re- gion of the ND5 gene. However, different rates of mtDNA evolution in the two species are evident in the ND5 sequences. In general, the patterns of nucleotide variation support earlier studies suggesting that the evo- lutionary histones of mtDNA have been very distinct in
D, simulans and D . melanogaster (SOLIGNAC et al. 1986; BABA-A~SSA et al. 1988; SAITA and TAKAHATA 1990; HALE and SINGH 1991a,b). The data illustrate the problems of inferring population histories from mtDNA varia- tion when rates of molecular evolution differ between species and different histories of adaptive and neu- tral evolution have shaped molecular variation within species.
MATERIALS AND METHODS
Fly strains: Nine strains of both D . melanogaster and D . simulans were chosen from diverse localities around the
world. Six lines of D. melanogaster were obtained from RAMA
SINCH and LARRY HALE and were used in their earlier studies
(HALE and SINGH 1991a,b) of mtDNA restriction site variation
(ARG, La Plata, Argentina; BRO, Brownsville, Texas; CAF,
Brazzaville, Congo; FRA, Villeurbanne, France; IND, Varanasi,
India; JAP, Jume, Japan). Three additional lines were obtained
from ANDREW CLARK (DVA, Death Valley, California; DEN, Egi,
Denmark; PEN, Rothrock State Forest, Pennsylvania).
The nine strains of D. simulans were obtained from the
National Drosophila Species Resource Center (Bowling Green
State University, Bowling Green, Ohio; name of sequence, col-
lecting locality for line and stock center number are, respec-
tively: SIM.OHAI, Kenscoff, Haiti, 14021-1251.0; SIM.lGUY,
Georgetown, Guyana, 14021-1251.1; SIM.ZCOL, Leticia, Co- lombia, 14021-1251.2; SIM.4AUS, Australia, 14021-1251.4; SIM.5PER, Lima, Peru, 14021-1251.5; SIM.GCAL, Nueva, Cali- fornia, 14021-1251.6; SlM.7AFR, Raratango, Cook Island, Af-
rica, 14021-1251.7; SIM.8 MEX, Tamazunchale, Mexico,
14021-1251.8; SIM.SNGU, Gorak, New Guinea, 14021-1251.9).
The collecting localities for the I>. simulans lines are all from
regions where the cosmopolitan, sill haplotype is found ( BABA-
&%A et al. 1988; HALE and SINCH 1991b), and the si11 haplotype
was confirmed by Southern blot analyses (data not shown).
Two random samples of 10 lines each of D . melanogaster
from Arvin, California (Arv2, Arv3, Arv8, Arvll, Arvl2, Arvl3,
Arvl5, Arv19, Arv21, Arv23) and Zimbabwe, Africa (Zim3,
Zim5, Zim6, Zim7, Zim8, ZimlO, Zimll, Ziml8, Zim22,
Zim24) were obtained from C. F. AQUADRO and D. J. BEGUN.
The “diverse” samples of both D. melanogaster and D . simu- lans were chosen for comparison to the widely cited data of
KREITMAN (1983) and KREITMAN and HUDSON (1991), where se-
quences from the Adh region were presented for individual
lines from diverse localities around the world. While such
samples violate some of the assumptions of both the HKA test
and the TAJIMA’S test (see below), the use of these samples will
provide a comparison to a number of other published HKA
tests that have used the REITMAN and HUDSON data as a ref-
erence locus ( e . g . , BERRY et ~ l . 1991; BEGUN and A Q U ~ R O 1991,
1994). The “random” samples from Arvin, California and
Zimbabwe were chosen for direct comparison to recently pub-
lished data from nuclear loci for these same lines (BEGUN and
AQUADRO 1993, 1994).
DNA amplification and sequencing: DNA template was pre-
pared from a single female from each of these strains by plac-
ing the fly in a microcentrifuge tube, macerating the tissue
with a sterile pipette tip holding 50 pl of 10 mM Tris (pH 8.2),
1 mM EDTA and 25 mM NaCl and proteinase K added to a
concentration of 200 pg/ml (GLOOR and ENGELS 1991). The
resulting homogenate was incubated at 37” for 20-30 min and the proteins were denatured by heat treatment at 95” for 2-3 min.
Sequencing templates were prepared by polymerase chain
reaction (PCR) amplification of two overlapping fragments
covering the 1500-bp region sequenced. A 1.39-kb fragment was amplified with primers 880R 5’CcAAAAAGAGGCA- TATCACT3‘ and 2230L: 5’AGCTATAGCTGCTCCTAC3’
[number = 3’ nucleotide of primer based on the published
sequence of GARESSE (1988) and the letter indicates the di-
rection of elongation with respect to GARESSE (1988), Figure 21.
An overlapping, 1.77 kb fragment was amplified using prim-
ers 1280R 5‘GACCTCCAAAATATTCTGAT3’ and 3017L
5’TAGAAGAGGTAAAA’ITCGAG3’. Nine additional primers
spaced approximately 300 bp apart on each strand were used
as internal sequencing primers on these templates. DNA was
amplified in 50-pl reactions containing 1 pl of fly homogenate
(see above), 5 pl of Promega Mg-free 1OX buffer, 6 pl of 25 mM
MgCl,, 50 pmol of each primer and 2 units of Promega Taq
polymerase. Double-stranded products were precipitated
with ammonium acetate and ethanol at room temperature
( KREITMAN and WDWEBER 1989). The PCR products were used
in three sequencing reactions.
The sequences were determined in both directions using dideoxy methods, The double-stranded templates were heated
These “snap-cooled” templates were melted in the presence of labeling mixture with 50 pmol of sequencing primer and trans- ferred to the chain termination reactions (US. Biochemical Corp. with Sequenase, version 2.0). Sequencing gels were run “short” with 1.0 M sodium acetate in the lower buffer chamber (SHEEN and SNEED 1988) resolving sequence from about 50 bp through 350 bp from the primer. “Long” gel runs without sodium acetate generally resolved sequence from 200 bp through 500 bp from the same primer.
Sequence comparisons and analyses: Sequences were aligned by eye. Heterozygosity per nucleotide site, T , was es- timated from the average number of nucleotide differences between all pairs of sequences within a species (NEI 1987, Equation 10.6). A different measure of nucleotide heterozy- gosity, 8, was also estimated from the number of polymorphic or “segregating” sites (WAITERSON 1975; NEI 1987, Equation 10.3). Both T and 8 are estimates of the neutral parameter, which for autosomal regions is 4Nep, where Ne is the effective population size and p is the neutral mutation rate. Since mtDNA is effectively haploid and is transmitted through the female germline, 8 and r a r e estimates of 2Nep where Ne$ the effective population size of females. Assuming equal numbers of males and females and no paternal leakage of mtDNA, es- timates of 8 and T for mtDNA should be multiplied by four for comparison to a typical autosomal region (or multiplied by three for comparison to X-linked genes). It should be noted that as estimates of nucleotide heterozygosity, 0 and T are only valid when the samples are drawn from a randomly mating population at equilibrium for mutation and genetic drift. Since some of the sequences described here are a diverse sample from localities around the world, this assumption may well be violated (e.g., Begun and Aquadro 1993).
The sequences were tested for departures from the neutral expectations using the HKA test (HUDSON et al. 1987), TAJIMA’S (1989) test and the MCDONALD and KREITMAN (1991) test. The HKA test examines whether the levels of nucleotide polymor- phism at different loci are consistent with the levels of diver- gence between species at these loci. This test was modified to account for the different effective population size of mitochon- drial genes and other regions of the genome for which the appropriate data exist (polymorphism in D. melanogaster and
D. simulans and divergence between these species; see, e.g.
BEGUN and AQUADRO 1991; FORD et al. 1994). Modifications
were also made to account for different sample sizes of alleles sequenced (or restriction mapped) in mtDNA and the refer- ence loci (see, e.g., BERRY et al. 1991), as well as for different “effective” number of nucleotides surveyed by restriction en- zymes or direct sequencing (HUDSON et al. 1987; BEGUN and AQUADRO 1991; BERRY et al. 1991; FORD et al. 1994).
Phylogenetic analyses: Phylogenetic trees of the sequences from diverse samples of D. melanogaster and D. simulans and the homologous sequence from D. yakuba (CLARY and WOLSTENHOLME 1985) were reconstructed using both parsi- mony (PAUP 3.0s, SWOFFORD 1991) and distance methods (MEGA 1.01, KUMAR et al. 1993). The D. yakuba sequence was assigned as an outgroup in the parsimony analyses with a con- straint matrix of character state transformations defined by the frequencies of nucleotide changes in the 19 sequences (State Changes option of MacClade 3.01, MADDISON and ADDIS IS ON
1992). Bootstrap replications were performed using a branch and bound algorithm. In the distance methods, pairwise die tances between all sequences ( n = 9 D. mehnoga&r, n = 9 D. simuhns and the single D. yakuba) were determined using TWU-
RA’S (1992) distance which adjusts for biased base composition.
RESULTS
The nucleotide positions that are variable within ei- ther D. melanogaster or D. simulans are presented in
Table 1 (diverse samples of D. mhnogaster and D. simu- hns)
.
Table 1 also shows the nucleotide present at the h e mologous position in D. yukuba (Curwand WOISIENHOLME1985). Figure 1 presents a comparison of the 1515 bp in D. mhnogaster and D. simulans. The published sequence
(GARESSE 1988) was not used in estimating nucleotide poly- morphism or divergence. This sequence is derived from two different clones, one from a Cantons stock (up to position 1858) and the other from a wild French stock (position 1858 through the rRNA genes; GARESSE 1988). Moreover, the published sequence has a six bp insertion relative to all other strains (plus D. simuhnsand
D.
yakuba)that adds an isoleucine and a glycine to the open reading frame (boxed nucleotides at position 1859 in Figure
2
of GARESSE 1988). It should be noted that the EmRI cloning site defining the junction between the Cantons clone and the clone of the wild French stock’s mtDNAlies in this 6 b p insertion raising the possibility that this insertion is a clon- ing artifact. The absence of these 6 bp from the 38 new sequences reported here seems to support this possibility.Patterns of sequence divergence: The numbers and proportions of nucleotide differences between D. mela-
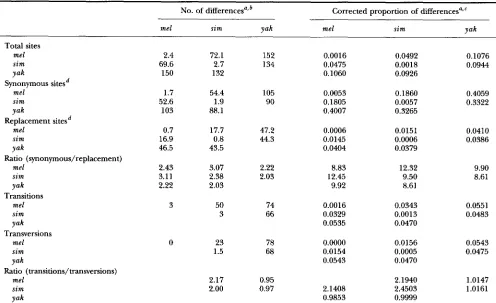
nogaster, D. simulans and D. yakuba are presented in Table 2. Sequence divergence was determined from all painvise differences between the nine diverse sequences of D. melanogaster and D. simulans plus the published sequence of D. yakuba. Net sequence divergence be- tween D. melanogasterand D. yakuba (10.6%) is slightly more than twice of that between D. melanogaster and D. simulans is (4.8%). The divergence between D. simu-
2ans and D. yakuba (9.3%) is less than twice of that between D. melanogaster and D. simulans is (4.8%). This suggests a faster rate of substitution along the lin- eage leading to D. melanogaster (see phylogenetic analy- sis below). To test this, the method of TAJIMA (1993) was applied. Using D. yakuba as a known outgroup and a comparison of the ND5 sequences between D. melano-
gaster and D. simulans [see the data in Figure 1, Table 1 and Figure 2 of GARESSE (1988)], there are 43 sites where D. melanogaster has a fixed, derived nucleotide
[ m l = 43; see TAJIMA (1993) expression 2a]
and
24 sites where D. simulans has a fured, derived nucleotide744 D. M. Rand, M. Dorfsman and L. M. Kann
1 . . . o c ) o o o * c ) - c ) .
I
. . .
u u ~ u u u u u u
0. . .
. . . . u . . . . . . U" c ) . . .
. . .
. . 0 0 . 0 c ) .
. . .
d d o o c ) o o o o c 3 . . .. . .
. u .
. . .
. . . . - 0 .
. . .
. . .
f
. . .. . .
. u .
. . .. . . . 0
. . .
. . o . . .
. . .
. . . . e
. . .
. . o u . o . .
. . .
o c ) o o . 0 ( 3 0 0 .. . .
c). . . . . . x . . . . . .
. . .
. 0 c ) . . o . . u .. . .
. r ) c ) . . o . . o .. . .
0
. . .
mtDNA
CA T T A
1 ~ m A A 1 T F C T A T U C m r r A T G ~ A T T A A G m A T A ~ ? T A 6 0
A A A C A A T T A A A T T A U C A T T f f i T A C ~ T M ~ T A T ~ C A A T F V N L I S Y S L S C F L L S L Y F L L
A A A G Tc
6 1 A A ~ T A T G A m A T ~ ~ T T A ~ m A A A T T r T A T M G M ~ T T 1 2 0 T T A C T A T A C T A A A T M T A A ~ A ~ A A T C A A A ~ m ~ T A ~ ? T A A C A A
N D ~ I Y F I E W E L V S L N S U S I V
c. . c G G
1 2 1 A T 1 P I C ~ T T T A m 9 r T A r r ~ T T r T T A T A A ~ T 1 8 0
T A ~ - C T M ~ A ~ A A A T A A T A A A T A T ~ C A A G A A T A ? T A A A G A U T F L F D W ~ S L L F ~ S F V L U I S
A . ' G i G ' A '
1 8 1 r r m A G T C A T I T I I T A T A - A A T A C A T A A T A A A ~ T A A T c A T A ? T A A ~ G A m 2 4 0
A G A P J L T r A C T m T A T ~ A T G T A T T A m 9 r C T A T T A G T A T A A ? T f f i C T A A A S L V I F Y S K E Y U ~ N D N H I N R F
C G A '
2 4 1 A ? T A T A T T A G T A T T A I \ T A ~ A r r M T A A T A T T O T T A A T T A T T A G C C A A A m A 300
T A A T A T A A r r A ~ T T A T A A A C ~ T A G T T A ~ T A A C M T T A A T A A ~ m A A A T I W L V L U F V L S W Y L L I I S P N L
A T
3 0 1 A T T A ~ m T A T T A O G ~ G ~ ~ f f i O A C T T O 1 T F C T T A ~ m A G T A A m A T 3 6 0 T M r r T T M T U T C C C A C T C T A C ~ r r - C ~ M T A A C A U r r A ? T A A A T A
I S I L L G W D G L G L V S Y C L V I Y
C
3 6 1 m C ~ T A ~ A A A r r T T A T M T G C ~ T A T A ? T A A ~ ~ A r r T A A ' K G A A ~ G 4 2 0
A
A A A G ~ A T M ~ f f i A A T A ~ ~ C C A T A T A A T R i A f f i C A A T ~ T T A ~ ? T A A C C C F Q N I K S Y N A G Y L T A L S N R I G
T G
4 2 1 G T O T ~ C m A C T T r m C T T O M T A T T A U T T A - G A - T T A T A ? T 4 8 0
CTACArr~TGAADAAAOA~CGAACTTATAAm1PITACCTTrTACmAATATAA D V A L L L S I A W ~ L N Y G S W N Y I
. A G T A
4 8 1 T m A m A ~ I T A T A C ~ T G M ~ A A A T G ? T A A T A A ~ A A G ? T f f i T A A T A 5 4 0 ~ T A A A T C m M T A T G ~ A C T T A A A C ~ A C A I L T T T
F Y L E I U Q N E F E ~ L U I G S L V U
A A A
5 4 1 T T A G C T G C T A T M C ~ ~ r r f f i A ~ C ~ T T r ~ ? T A C ~ A G C T A T A 600
A A ' K G A C G T A T R i A T r r T ~ ~ A A C C A A T G G f f i r r ~ T A T L A A ~ T K S A Q I P F S S W L P A A ~
C T
6 0 1 G C T G C r r C T A C A C C T D T m A ~ A ~ ~ T A C A T T A G T T A C A ~ ~ T G T A 6 6 0
C W L C G ~ ~ ~ ~ T G T G G A C A U G ~ ~ ~ U U T ~ U C T - G T G T A A ~ ~ A A T G T ~ G A C C A C A T
A A P T P V S A L V H S S T L V T A G V
A 7 8 1 A A M R 1 \ A T T A ~ C m A r r T A C m A A G T c M T T A O G m A A T ~ T U C A A ~ ~ 840
~ A A T M f f i W T I C A - ~ A G T T 1 P I T c C A A A T T A T T A ~ ~ M C A G K K I I A L S T L S Q L G L Y U S I L S
T
8 4 1 A T A O G A ~ M T T A ~ T A T A 1 T F C A m A T T A A C T C ~ T G C ~ A m A A A ~ A T T A 900
T P l r r C T A T A ~ ~ T A A A T A A T T O f f i T A f f i ~ T A A A ~ T A A T U G F L K L A Y F H L L T H A L F K A L
A A
9 0 1 ~ m A T A T G T G C ' P G G G G C T A ? T A T T r A T M T A T A A A T A A ~ r r M G T A ~ m A 960
M C A A A T A T A C A C C P I C C C C G A T M T U C T A ~ h T A m A T T U C f f i ~ A T M G C A A A T
L F U C A G A I I H N ~ N N S Q D I R L
A ' T
9 6 1 A T A G G G G G G T T U C A A T T A T A C C m A A C T T C A G C ~ m T A A C G T A T c T M m A 1020
TArrCCCCCAA~TTAAGTATAIrTATCOAARTTGAICTCGAAC~~CATAGTTAUT
N G G L S I H ~ P L T S A C F N V S N L
C G T
1 0 2 1 G C m A T G T G W V L T A C C m m A G C T G G A ~ A T T r T U C G T A T 1 P I ~ A D A A A ? T 1 0 8 0
A L C G H P F L A G F Y S K D I I L E I
f f i U U T A C A C C T T A T G G A C ~ A A ~ T A A G A T T r ~ A T A T T M ~ M
A A
1 0 8 1 G T T A G A A T T A ~ T G T T A T G ~ A ~ A T A ~ A ~ T A f f i ~ m A 1 1 4 0
V S I S N V N ~ F S F F L Y Y F S T G L C A R r r T T A A ~ m A C M T T A T A C ~ ~ ~ T A T M T ~ G A T G C C C A U T
A ' r~ T
1 1 4 1 A C T O T T G T T A m A m C G A T T A G m A T T A ~ ~ T 1 P I C C ~ ~ A m A A A T T O ~ T 1 2 0 0
T G A C A A ~ A A T A A G T A U ~ T A A ~ T A A T A A G T T A ~ C C A C T ~ m A A C ~ C A T V S Y S F R L V Y Y S ~ T G D L N C G
T A T A
1 2 0 1 ~ A T T O A A T A T A T T G ~ - T T A T A C ~ C ~ T A T A A T A G O A T T A T T A 1 2 6 0 r r T A A C T T A T A T A A T I T A C T A C ~ A A ~ A A T A ~ G G C A C C A T A T T A T C ~ ~ T A A T
S L N W L N D E S W I ~ L R G H ~ G L L
C
1 2 6 1 A T T A T A A G A A ? T A T T O O A O G T A ~ T A T T A A A T R i A T R i A ~ C ~ ~ A T A T A 1 3 2 0
T A A T A ~ T T A A T A A C C r r C A T c T T A T A A m A A C T A A C T A A I ~ S I I G G S ~ L N W L I F P F P Y ~
C A A G
1 3 2 1 A ~ m A C C T A m A T A T M ~ T T M C A T T A ~ T A T G T A T T O T A G ~ m ~ 1 3 8 0 T U U C A A A T G G A T A U T A T A m T A A C A A ~ T M T A A A C A T A C A T A A ~ r r C C C C A A A T
I C L P I Y U K L L T L F V C I V G G L
r~ .~ G A G
1 3 8 1 m G G A T A m A A l m C m A A G A A A ~ A ~ A A A T A A A ~ A ~ A T A T A T 1 4 4 0
A U C C T A T A U T T A A A G ~ m A A A T ~ m A m A D A A A T A A A T A T A T A F G Y L I S L S N L F F L N K S L F ~ Y
C C
T 0 1 4 4 1 A A m A A G A A ~ A O G G ~ T A T A ~ m A T A C C ? T A T A T T A ~ C ~ A ~ T A T A 1 5 0 0 6 6 1
T A m A T T A A ~ O A m M T A T T A T C T T A A ~ C ~ ~ T T A ~ A C A A ? T M T A ? T A 1 2 0 T T ~ T T r ~ T c C ~ G T A T A C T A A A T A ~ A A T A ~ ~ T A C C A T A T A T A U T M T P ~ C T A A A T T A ~ T ~ M T T r T T O A A ~ C C A A T c C T G ~ A A T T A T M T N L S T F L G S ~ W F Y P Y I S T Y G ~ Y L L I R F N I I L S T S W L G Q L ~ L
G
1 5 0 1 A-AWCTlTA 1 5 1 5
T m T A G D A A A T
I F Y P L
T G
I 1 1 T T A T T A ~ A T T A A C A A T A m 9 r T A ~ T G G A ~ ~ ~ T A A ~ M ~ A m A I 8 0 A A T A A T A O A C C T A A T T O T T A ~ A U T A ~ A C C T A A r r ~ A T T ~ C T T A A A C T A A A T L L S G L T Y F M A G L G A N F E F D L
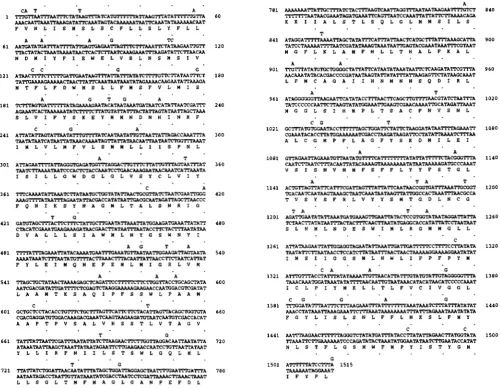
FIGURE 1.-Nucleotide and amino acid sequence of ND5 gene from D . melanogaster and D . simulans. The D . melanogaster
sequence is presented in the opposite direction from that in GARESSE (1988) so that the bottom strand presented here is the strand in Figure 2 of GARESSE. Position 1 corresponds to position 2842 and position 1515 corresponds to position 1322 in GARESSE. Note
that the duplication of six bp reported at position 1859 in GARESSE was not found in the sequences reported here. Differences
between D . melanogaster and D . simulans are indicated by a single nucleotide above the sequence. The single letter amino acid
code is shown below the sequence and is based on the top strand in the figure.
rates of evolution in
D.
melanogasterhave been reportedfor some mitochondrial genes [or portions of genes:
ND2, COI
(SHARP
and LI 1989), COI, COII, ATPase6(KANEKO et al. 1993)l.
The ratio of synonymous to replacement substitutions
is slightly higher in the mel-sim comparison than in the
intraspecific or mel-yak comparisons. This pattern is also
true for the ND2 gene [ratios of synonymous to replace-
ment substitutions for melvs. sim, me1 vs. yak and sim vs.
yak are 17.9, 4.9 and 5.8, respectively; see Tables
2
and3 of KANEKO et al. (1993)l. However, the COI and
ATPase6 genes show very different ratios for these spe-
cies comparisons (32.5, 36.1 and 73.2 for COI and 7.7, 13.3 and 17.6 for ATPase 6).
The patterns of transitional and transversional changes in the sequences indicate that transitions out- number transversions at close evolutionary distances
(more than 2:l within species and between
D.
mela-nogaster and
D.
simulans). The bias toward transitionsdrops off to 1:l in the comparisons to
D.
yakuba. Thisdecrease in the transiti0n:transversion bias has
been noted in previous sequence comparisons of
mtDNA in Drosophila (DESALLE et al. 1987a; SATTA
et al. 1987).
The patterns of synonymous and replacement substi-
tution between D . melanogaster and
D.
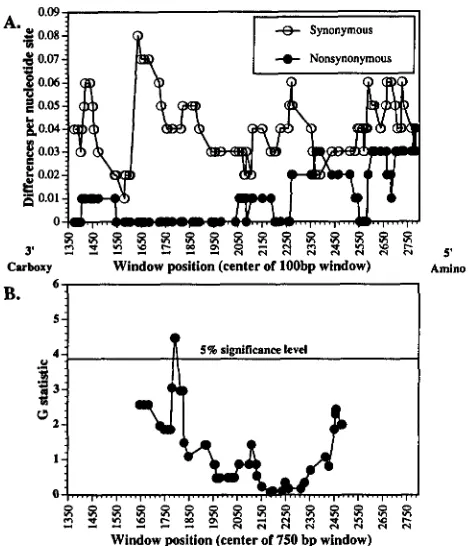
simulans varyconsiderably across the ND5 gene. Figure 2 presents the
patterns of divergence in a slidingwindow of 100 bp that
is moved across the data set ( i . e . , along Figure 1 from
right to left) one variable site at a time. The greatest
amount of synonymous divergence is in a region with no
amino acid divergence (the left half of Figure 2 which
746 D. M. Rand, M. Dorfsman and L. M. Kann
TABLE 2
Nucleotide differences between species
No. of differencesajb Corrected proportion of differencesazC ~~
me1 sim Yak me1 sim Yak
Total sites
me1 s i m
Yak
Synonymous sitesd
me1 sim
Yak
Replacement sitesd
me1 sim
Y ak
2.4 72.1 152 0.0016 0.0492 0.1076
69.6 2.7 134 0.0475 0.0018
150 132
0.0944 0.1060 0.0926
1.7 54.4 105 0.0053 0.1860 0.4059 52.6 1.9 90 0.1805 0.0057
103
0.3322 88.1 0.4007 0.3265
0.7 17.7 47.2 0.0006 0.0151 0.0410
16.9 0.8 44.3 0.0145 0.0006 0.0386
46.5 43.5 0.0404 0.0379 Ratio (synonymous/replacement)
me1 2.43 3.07 2.22 8.83 12.32 9.90
s i m 3.11 2.38 2.03 12.45 9.50 8.61
Yak 2.22 2.03 9.92 8.61 Transitions
me1 3 50 74 0.0016 0.0343 0.0551
sim 3 66 0.0329 0.0013 0.0483
Yak 0.0535 0.0470
Transversions
me1 s i m
Yak
0 23 78 0.0000 0.0156 0.0543
1.5 68 0.0154 0.0005 0.0475
0.0543 0.0470 Ratio (transitions/transversions)
me1 2.17 0.95 2.1940 1.0147
s i m 2.00 0.97 2.1408 2.4503 1.0161
Yak 0.9853 0.9999
Within each of the nine comparisons for a given type of data, values presented are the average of all pairwise differences (or proportions) between sequences. The upper right of each 3 X 3 matrix shows the gross differences and the lower left shows the values correcting for intraspecific variation [the values on the diagonal; NEI (1987, p. 276)].
Number of differences are uncorrected, observed values.
Corrected proportions were calculated using the J u ~ s CANTOR (1969) method for total, synonymous and replacement sites and the TAMURA ( 9 9 2 ) method for proportions of transitions and transversions.
The values for corrected proportions of synonymous and replacement sites are the divergence per synonymous and replacement site, "
respectively.
coding strand of Drosophila mtDNA which is from right to left in Figure 2 of GARESSE (1988) and from left to right in Figure 1 of this report). In the right (amino-terminal) half of the comparison, there are some windows of 100 bp where there are as many replacement as synonymous differences between
D.
melanogaster andD.
simulans.If the 1515 bases are divided into two regions of 758 nucleotides, the numbers of nonsynonymous and syn-
onymous substitutions, respectively, are three and 29 in the left half, and 13 and
27
in the right half. This dif- ference is significant (Chi-square with continuity cor- rection = 4.24, d.f. = 1, P<
0.039).Nucleotide polymorphism in D . meZunogustm Data on the number of segregating sites and nucleotide het- erozygosity are presented in Table 3. The diverse
D.
melanogaster sequences show eight variable nucle- otide positions ( S = 8) over the 1515 bp surveyed. Three of these eight polymorphisms are replacements and two of the three replacement polymorphisms are in the sequence from India. All of the polymorphisms are transitions, five A.G and three C:T.. .
The estimate of nucleotide heterozygosity based on the number of segregating sites ( 8 = 0.0019) is slightly, but not significantly, larger than that based on the number of painvise differences between sequences ( m = 0.0016). This is to be expected in a diverse sample with one or a few sequences drawn from different geo- graphic regions since such a sample is likely to have an excess of unique or low frequency polymorphisms. This is reflected in the negative value of TAJIMA'S D statistic. The two halves of the data set (N-terminal and Gterminal; see sequence divergence above) show pat- terns very similar to the entire 1515-bp region. HALE and SINCH (1991a) report an average painvise difference ( m ) of 0.0053 estimated from 4,4.5- and &cutter restriction analyses of entire mtDNAs in 144 lines of
D.
melano- gaster. This larger estimate of m presumably reflects the greater number of collecting localities and flies surveyed by H A L E and SINGH (1991a).Neutrality Tests of mtDNA 747
A. 0.09
’5 f 0.08 -8 Synonymous
3
0.07-
e
0.062 0.05 g0.04
r o o 2
I.
f 0.03
$0.01
0
$ $ a $ ~ g & ~ ~ a a $ R $ ~
3’
“ “ “ “ N a N N a N N
5’Carboxy Window position (center of lOObp window) Amino
5 4
I
Window position (center of 750 bp window)
FIGURE 2.-Patterns of synonymous and nonsynonymous (replacement) substitution between D. melanogaster and D. simulans across the ND5 gene. (A) A window spanning 100 bp was moved across the data set (from right to left of Figure
1) and the number of silent and replacement differences be- tween the two species per nucleotide site was tabulated. The left part of panel A shows low levels of amino acid replacement substitution but the highest level of synonymous substitution. Toward the right half of panel A the levels of synonymous and replacement substitutions are more similar. These differences between the two halves of the data are significant (see RESULTS).
(B) A window of 750 bp was moved across the data set (across Table 1 from left to right) and the Gstatistic was calculated for a MCDONALDKREITMAN test comparing the numbers of synony-
mous and replacement polymorphisms within species to the
number of synonymous and replacement substitutions be- tween species. The data are generally consistent with a neutral model, but in one region of the gene there is a window of 750
bp that show an excess of amino acid replacement polymor- phism. This excess lies in the region where the level of amino acid substitution between species is lowest.
Table 3). There is a single nonsynonymous polymor- phism in one line of the Arvin sample while the other nine lines from Arvin, and the three additional U.S. lines in the diverse sample, are identical. The 10 sequences from Zimbabwe, Africa, show four segregating sites, one of which is nonsynonymous. Thus, the U.S. sample has lower levels of mtDNA polymorphism (-IT = 0.0001) than the Zimbabwe sample ( T = 0.0006), a pattern that was
observed by HALE and SINGH (1991a) for restriction analyses of mtDNAs from North American vs. Euro- African samples. Similarly, data from several nuclear loci indicate that nucleotide polymorphism in the Arvin sample is lower than in the Zimbabwe sample (BEGUN and AQUADRO 1993, 1994).
Population structure in D . melanogaster: There is clear differentiation between the Arvin, California, and Zimbabwe samples indicated by two fixed or nearly fixed positions (see Tables 1 and
4).
At the two positions where these samples are differentiated (1715 and 2603) the diverse sample ofD.
melanogaster also shows evi- dence for differentiation between the United States and Europe/Aftica (see Table 1). Measures of population subdivision indicate that the differentiation between the United States and Africa for mtDNA is substantial and significant (see Table 4). While a comparable statistic for differentiation between North America and Africa was not presented by H A L E and SINGH (1991a), it is clear from their data that this distinction is strong. Restriction h a p lotype#7
was found in 47 of 52 (90%) lines from North America, but was found only once in 36 lines (3%) from the Euro-African region (Table 4 of H A L E and SINGH 1991a).The differentiation of mtDNA between the United States and Africa is higher than that for nuclear gene regions (BEGUN and AQUADRO 1993,1994). This is to be expected given the lower effective population size of mtDNA. Assuming equal numbers of males and females, the effective population sizes of mitochondrial and X-linked genes should differ by a factor of three. Nota- bly, the FST values reported by BEGUN and AQUADRO
(1993) for X-linked genes that are experiencing “nor- mal” levels of recombination are quite close to one-third the FST for mtDNA (see Table 4). These samples are directly comparable since the mitochondrial ND5 se- quences are derived from some of the same female lines of
D.
melanogaster that BEGUN and AQUADRO used to es- timate FST for these X-linked genes. The ratios of the FSTvalues would be expected to equal the inverse of the ratios of the effective population sizes for two different genetic markers only if the combined term N m (effective population size of marker times the migration rate) in the expression FST = 1/ ( N m
+
1 ) is large ( N m-
5-10). Given the large population size(-lo6
AQUADRO et al.1988) and presumed high migration rate (SINGH and RHOMBERG 1987; DAVID and CAPY 1988; HALE and SINGH 1991a,b) in
D.
melanogaster, an N m > 5 may well hold.748 D. M. Rand, M. Dorfsrnan and L. M. Kann
TABLE 3
Estimates of nucleotide variation at the N D 5 locus
No. variable
Species Sample ( n ) No. Sites sites 0" 7rQ TAJIMA'S D c
D . melanogaster Diverse (9) 1515 8
D . melanogaster Arvin, CA (IO) 1 0.0002 0.0019 1 t 0.0007 0.0016 0.0001 0.0001 t t 0.0003 0.0013 -0.855 D . melanogaster Zimbabwe (10) 1515 4 0.0009 t 0.0003 0.0006 t 0.0007 -1.112
D . melanogaster N-term, diverse (9) 758 4 0.0019 t 0.0007 0.0016 t 0.0015 -1.245
D . melanogaster Gterm, diverse (9) 758 4 0.0019 t 0.0007 0.0016 2 0.0015 -0.689
D . simulans Diverse (9) 1515 6 -0.843
D. simulans N-term, diverse (9) 758 0.0015 t 0.0005 0.0018 2 0.0010
0.907
4
D . simulans
0.0010 t 0,0004 0.0006 t 0.0009
Cterm, diverse (9) 758 2 0.0019 L 0.0007 0.0029 2 0.0015 2.073* 1515
- 1.363
Estimate is from WATERSON (1975) and error assumes no recombination [see NEI (1987, Equations 10.2 and 10.3)].
Estimate is from NEI (1987, expression 10.6) and error is the square root of expression 10.9 (NEI 1987). Both estimates are of 2 Np where N is the effective number of females and p is the neutral mutation rate.
'From TAJIMA (1989) expression 38; * indicates a departure from neutral expectations at the 5% level.
TABU 4
Estimates of population subdivision in D . melanogaster Samples compared FsT" X*' d.f. P<
mtDNA-ND5 sequences
Arvin, California us. Zimbabwe' 0.74 17.40 5 0.005 United States vs. Euro-Africad 0.73 16.38 4 0.005
Pgd e 0.25
G 6 p d e 0.30
vermilione 0.32
whitee 0.28
Mean for X-linked loci 0.29
mtDNAX ratio 2.57
"
FST estimated using the method of HUDSON et al. (1992). bTest of the null hypothesis that the genetic distance between X-linked locipopulations Dij = 0. See NEI (1987, p. 227).
Ten sequences from each population; data from Table 2. dFour American lines (ARC, BRO, DM, PEN) us. three Euro-
e Data are for United States us. Zimbabwe samples analyzed using African lines ( C A F , FFL4, DEN); data from Table 1.
fourcutter analysis (BEGUN and AQUADRO 1993).
AQUADRO 1993) reflects neutral levels of population dif- ferentiation, the above comparisons of FST values for nuclear and mitochondrial markers suggest essentially neutral population subdivision of mtDNA in
D.
mela- nogaster. However, additional samples and better esti- mates of N m for each marker are needed before firm conclusions of this sort can be made.Nucleotide polymorphism in D . simulans: The di- verse
D.
simulans sequences show six polymorphic nucleotide sites, and one three base pair insertion (TAA at position 2132) that adds a leucine to an (A+
T)-rich stretch coding for leucines and a methionine. Only base- pair substitutions were considered in estimating nucle- otide heterozygosity. Of the six single base polymor- phisms, two are nonsynonymous transversions (AT at position 1502 and C:A at position 2752) and four are synonymous A G transitions. Four of the polymorphisms lie in the C-terminal half of the sequence and are at high frequency in the sample (4/9), defining two lineages withinD.
simulans. Three of these four polymorphisms are closely spaced in the sequence (positions 1502,1505 and 1523). None of the polymorphisms are shared be-tween
D.
melanogaster and D. simulans. At position 2840 the polymorphism withinD.
simulans is either the retention of an ancestral state (A in both D . melano-gaster and
D.
yakuba) or a back mutation to A. The latter explanation is more parsimonious given the many fixed differences betweenD.
melanogaster and D. simulans. The two estimates of nucleotide heterozygosity show slightly different patterns in the two species, 8 being lower, and r being higher inD.
simulans than inD.
melanogaster (Table 3). This difference reflects the greater number of high frequency polymorphisms inD.
simulans, resulting in a positive value of TAJIMA'S D sta- tistic. While it is apparent that the levels of nucleotide variation inD.
simulans are not significantly lower (see standard errors in Table 3), this is distinct from the pat- terns of variation in nuclear genes whereD.
simulans generally shows more nucleotide variation thenD.
mela- nogaster (AQUADRO et al. 1988; BEGUN and AQUADRO 1991; HEY and KLIMAN 1993). It should be noted, how- ever, thatD.
simulans has been reported to show lower levels of nucleotide heterozygosity thanD.
melanogaster in regions of the genome experiencing low rates of re- combination (BEGUN and AQUADRO 1991). In both spe- cies, hitchhiking of selectively advantageous or delete- rious mutations has been invoked to account for the reductions of nucleotide heterozygosity relative to loci experiencing "normal" rates of recombination (BEGUN and AQUADRO 1991; BERRY et al. 1991).Population structure in D . simulans: In contrast to
D.
melanogaster, where fixed differences in mtDNA are evi- dent between continents, the polymorphisms in D. simulans show little geographic structure Notably, theV
a, %
h
B
j - .
g g
3 . " -
*8
w
m"B y
8 g -
i Q
Q
P
72
2
m"*
I"
Q8
ta
In
P i
i j L
p
2 L a
3 %
'I
-
2-:j
ii
2
$ 5
e ?
W0
B
8 83
G-4 K
i?
)I
P
v d
2
3
9 Y Z-
q;e4.5$S.Sg
m o u '? F ? - ? ? ? ? * ? V
8 3
2 %
25
$ Z ' S : , a 8 g+&m , , , a 8 r r n * * *~g2*+~;;;;;;,
c m - # w r l r j y . . . s
m & & r r @ l m o o o &
2 %
- a & <
%%-,
Y 0 Zw E.s.c d P q" 2 & ,!3
0 0 0 0 0 0 0 0 0 0 0 0
m m r - a L - i - m O - b W
c 9 3 O W Q k
l n o m m m m
? F ? - ? s e * 8 % 1 8
S %
8 ,
P"2S_O,@v
XX~U?~SX~~
+%@ E & b w 3 '$9 $ L
2
Psz
-
e, I 1 3 $ C 2 &m a m w m w t - r - w w
\\\\\,\\,\
y\
- $ g y ; g g g e g
21s
y::csz
- u E %
z 2.5 3 % c 8 4 g
9 5 2 ;";f$S
9
o y " . + q q m Z $ q y
- * o o o o a m m a
2 2
' c ~ . z ~ , s ~ ~ ~ c o m a a m m ~ ~ c ~ w,\\\,,\\,\
tf
.c
e, u Z f 5 0 cl??3.gEsz3g
3 3 g q . 2 g g =! 5s:
$Ujj$.$ aJ m a Oy o . ; a 8 9 " c e ,
o y y q q t . o * M !
ZF?
53 2
aJ 2 ag *oQ
5
v..+..>~>.&Y&
- # m m * m w m m * Z
;;$
-
a $j.glI.e, cc@aB:.r
$ 0 20s
E c : 5 P = P i - d% X $ % $ ~ o q ~ q Q?? 2's 3
J,"
e,v ) O g c ; , % q a
m m " + " o a
7 %
e-+
b S U E ! ; %\
\
\
\
\
\
\
?
Y
\
\ \"$b&;t;vl
*
O O ~ ~ ~ ~ ~ a ~ 2
m m + r r + w
s s
Ea;?
c o=='-$.ga w ~ U i - Q - s $ j
5;
*
s U " a E i - S $ 2
" -+ In
wg2
i'J$
e,?
S - % z
* m lna- 3 $.@ t a w=
25s
g z 6 -
2 5 5
c6.s
- m 2 23 a f g
0.2; ? ' - e
0.zw,2
Q-is
6"-O-s;,o-z5, 2 E 0
5
9
0 3 e , 4 h e , m 5- - - + m m n . j ; v)&g-m.',r ,m amp 3 L 'Ef c
5 $ ;. z m - m *
-
-m Oi" a QI ~~a 8 45
5
," 2 '2.s C.,-.Z ecy,"
,$X
m a i- ab5
g . q
s ~ ~ g z ~ - ; a s - - c .- G
-
3.3- n v )z
0 o . c 5 " ' Z ' k u2
0' 3 7 a . ; z . Z
a@?;
3 6
a 5 2 u& ' E
5 $ 8 5 c . 2 3 rn w % v)ececkl.-
z.:a,g,..S:
5 % g 2 - a * = A EId
W d " d Z Z a . m $ .gs.;: . c a s
s s."d":.$
$ 4z z
-0 8 12"g
c . 2 2r n l n m m l q m " m - r o ^ d 6 3 - F J o P 3 ? 0 " 4 $
z z z z z z z z z z
2 2
j?
g,s
w&g
g
-@
9
2
E,"r
EE.2
u u
O O U E C O g E b L
. o m
g q O z u
L. 3.2 3 v) Eh"'UOs
g g
2:
z e . - U ' 5 m * $ $ &4
8:"2
z g
> p g , 2 . 2
-00 v) E 2 2 12
-*
a a 9 3 m%ti&%
2; 5 2 ~ a $ W w aqrn-gy
r-r- 5 5'Ss$,,$ap
y u u 05;:
..*
" 2
L. e, 875 k 9z.2
2 G Z $.. 6 %
$xi
x
m ? $ % % - 32"
a .n * ~ v ; ~ & q Q , o Og
""u u u u rn -.: a" J .z .zw 0 aJ ar b > g :
&.
e, E1
-
r("" v ) v ) E S ! Q - $ S ~ , ~ ~ . . Zp - m m m e d c - E - - 0,
g
V,;-;a..=;
y w 0c j F a " - y s " $
0 u p I m m c I I - P&sa$$
p " M U , p $ 8 2 3c"
.- c g 5
=
- 6 m g g 4 . c . g . S----
Z Q - a i r W &~ , , ~
0
..S&;ggg@
gg5444u-j ^ b v j g ' c e
3 3 3 3 3 3 d e 0 ..I 0 0
:
9
*
z
$ 3
m " ) Q 52 " " -
ghhhhh<ss+$e+*
5 3 2 % 38 %
3 & $ 2g
s! I1 c S Q y j !&
$ 9 -
ge*.ce*.e*$.g.g - U - U - U ' E f ' E f - U b Q u u Og.:
z
$ . Z Z Z
E Ez v T T T T v a , 4 4 4 $ i c
-
F: $ Z *'e,5 5
!2
" J
9
3 6 s
o , y "m c o o o o o m m l n ~ m m
- - r ( - c r ) W
p " g 2 p p
S E",gag
* a c 2 8aJ 0 5
a" v15
u s 3 2 Z Q w "
u
Q.2
* a g
$ 2
g h
.I , $ a m i
;2
~ 3 4 . 3 0P?gZa=CJN.$g
3 s
b+
M d 28
i s . 2 O .a 95 T g
-33,
3 3P 6
Z d c 6 " f c Q - g u v)
wqz
0a a d a a a a a a a d ' c 0 Q
-
"h
3-G c 0 s a a 5 d d
. g Z a b
w E m E E . 5- - - # " F w ~ 3 3 c.c;a;a
~ -05 " 2 O D 0 e, o( N"
a a 0 0 C S a -
u w Y I 4 * c r h
9
P
TI2
.g
v1 .- 5 E. 2 h3 9 2 u.-
mi-
.c
B
YE,
.--
Ln e, 5
8
.^ m.-
x
2
Y
s
2 b iri2
2 -6 Y e, c4
E
PY VI
.* C 0
:e
g
4
2:
I
5.3
g
A g u m S A z c s
2
h .-
v)m
gg
/+
z d z l
2;
&
d zp
g
38
* = a 6 E
B B a , z 4
E E E &
, g
g g
63
.E
s s $ $ g p
I $ ;
!$:
& & & O U 8
a n a &
e~
0 0 0
0 9 o u
750 D. M. Rand, M. Dorfsman and L. M. Kann
Guinea and Australia. This stems from a higher average number of pairwise differences between lines within the New World than between lines from the two “popula- tions.’’ This is of little significance because the sample of
D.
simulans is not appropriate for calculating F,,HALE and SINGH (1991b) also found two frequent re- striction haplotypes in
D.
simulans, plus two additional haplotypes at lower frequency. While they reported a relatively high GST value (0.55) among 69 lines from around the world, they found no endemic haplotypes and the two common haplotypes were often present in the same populations. Thus the sequence data pre- sented here are consistentwith earlier restriction studies (HALE and SINGH 1991a,b) indicating lower levels of mtDNA variation, and less population structure of mtDNA inD.
simulans than inD.
melanogaster.Tests of neutrality: The method of HUDSON et al. (1987) was used to test for departures from neutrality. None of the samples of mtDNA sequence from
D.
mela- nogaster reported here deviate significantly from neu- tral expectations when compared to different regions of the nuclear genome (see Table 5). The HKA test of the ND5 sequences inD.
simulans compared to the six se- quences from the period locus reported by KLIMAN and HEY (1993) is notable in that the mtDNA sequences show fewer than half the expected number of segregating sites. Although the HKA statistic is not significant, a Gtest using the same data but adjusting the polymor- phisms in mtDNA for the difference in effective popu- lation size (3 X S, = 18; see Table 5) is highly significant ( G = 15.16, P < 0.0001; note that such a test does not adjust for the possibility that polymorphisms are not in- dependent of one another). Using the published data on restriction site variation inD.
simulans (HALE and SINCH 1991b) and restriction site differences betweenD.
simulans andD.
melanogaster (SOLIGNAC et al. 1986), mtDNA variation inD.
simulans does show a significant HKA test statistic in comparison to the period sequence reported by KL.IMAN and HEY (1993) (see Table 5).It is important to note that the assumption of a ran- domly mating population is violated in the HKA tests using the “diverse” samples of
D.
melanogaster (and theD.
simulans sample). Previous work has shown that population subdivision ofD.
melanogaster exists among different geographic regions of the globe (BEGUN and AQUADRO, 1993, 1994; HALE and SINGH 1991a). This may also be true forD.
simulans ( H A L E and SINGH 1991b; but possibly to a lesser extent than inD.
melanogaster as indicated above). Hence, the HKA results from these samples should be interpreted with caution since these diverse, overdispersed samples will typically show more polymorphism that random samples from single locali- ties (c& Table 3).The MCDONALD and KREITMAN (1991) test examines whether the ratio of silent to replacement substitutions is the same within and between species. Applied to the current data, this approach fails to reject the neutral
model. For 29
D.
melanogaster sequences vs. nineD.
simulans sequences there are 15 fured replacement (FR) ,5 4 fixed synonymous (FS) , seven polymorphic re- placement (PR) and 11 polymorphic synonymous (PS) sites ( G = 2.08, P < 0.5). When the
D.
simulans clade containingsim.1, sim.2, sim.6and sim.9 (see Table 1 and Figure 3) is used as the interspecific comparison, the numbers suggest an excess of polymorphic replace- ments (FR = 16, FS = 58, PR = 6, PS =7),
although the test is not significant ( G = 3.18, P < 0.1).There is, however, considerable spatial variation in the outcome of this test (Figure 2). If one considers a sliding window of 750 bp that is moved across the data set, the carboxy-terminal half of the data (left half of Table 1; 29
D.
melanogaster, 9D.
simulans) does indi- cate a region where the ratios of synonymous and re- placement polymorphism and divergence are not con- sistent with neutral expectations (see Figure 2B). This deviation is significant (FR = 2, FS = 25, PR = 4, PS =7;
G = 4.47, P < 0.05). As is evident from this figure, the significance of this one peak hangs on a single variable nucleotide site since the significance drops off rapidly as the window moves along. By comparing the top and bot- tom halves of Figure 2, it is evident that the lowest level of replacement substitution between species overlapsthe peak in the G statistic of the MCDONALD-KREITMAN test. Hence the significant G statistic stems from the fact that the level of replacement polymorphism does not drop in this window of reduced amino acid divergence. A pattern of excess replacement polymorphism has been observed in the mitochondrial ATPase 6 gene in
D.
melanogaster (KANEKO et al. 1993) and at the mito- chondrial ND3 gene in mice (NACHMAN et al. 1994). Two plausible explanations for these observations are that amino acid polymorphisms are slightly deleterious or that selective constraints on protein sequences have been relaxed within species (NACHMAN et al. 1994).The Tajima test examines whether the average num- ber of pairwise nucleotide differences between haplo- types in a sample (T) is larger or smaller than that ex- pected (0) from the observed number of segregating sites. Under the assumptions of a random mating popu- lation and an infinite sites equilibrium model of neutral DNA evolution, the difference between T and 0 is ex-
pected to be zero ( i . e . , TAJIMA’S
D
= 0 ) . A positive value of TAJIMA’S D indicates possible balancing selection or population subdivision. A negative value of TAJIMA’S D suggests recent directional selection, a population bottleneck or background selection of slightly deleteri-ous alleles (TAJIMA 1989). With the exception of the carboxy-terminal half of the