SYSTEM IDENTIFICATION OF A NUCLEAR REACTOR BUILDING
UNDER FIXED-BASE CONDITION USING MEASURED DATA
Ali NIOUSHA*
Kajima Technical Research Institute
19-1Tobitakyu
2-Chome, Chofu-shi,Tokyo 182-0036,
Japan
[email protected]
Tel: +81-424-89-7596
Fax: +81-424-89-7116
Yukio NAITO
Kajima Technical Research Institute,
Japan
Masao KAN
Nuclear Power Department, Kajima
Corporation
Atsushi ONOUCHI
Chubu Electric Power Co., Inc., Japan
Atsushi TACHIBANA
Chubu Electric Power Co., Inc., Japan
ABSTRACT
We apply our proposed system identification method to estimate the dynamic characteristics of a partly embedded nuclear reactor building under an imaginary fixed base condition and discuss the results. Although the proposed method is essentially designed for systems without embedment, the applicability of the method to partly embedded buildings has already been checked and confirmed in our previous paper, using an analytical model. In this paper, we study the dynamic characteristics of the building itself using forced vibration tests, microtremors and earthquake observation data. Effects resulting from out-of-plane deformation of the base mat, the sharing ratio of the exciter force between the sealed and inner walls, and the amount of frame averaging needed for reliable spectral analysis are also studied.
Keyword: dynamic response characteristics, system identification, soil-structure interaction, forced vibration, fixed-base condition
1 INTRODUCTION
Dynamic response characteristics of structures are based on many factors, including the structure itself, the foundation and the surrounding soil. These conditions make it difficult to identify the total system or the structure itself, so several data transformations are taken into account. It is known from simulation analyses of nuclear reactor buildings with large soil-structure interaction (SSI) that a significant change in building stiffness has little effect on the fundamental frequency of the soil-building system. One important aim of the structural identification is to validate the soundness and the rigidity of the whole structure. To this end, the authors presented a system identification methodfor estimating the fixed-base dynamic characteristics of a building by isolating the effect of dynamic SSI (Ishibashi, 1994 and Naito, 1997) and applied it to the results of vibration tests on a model nuclear reactor building (Naito, 2003) and a high-rise building (Hikita et al., 2003). The method is basically designed for buildings without embedment. However, its applicability to buildings with embedment has already been checked and confirmed using an analytical model (Naito, 2004, 2005). Hikita et al. (2003) showed that instead of using the classical spectral analysis, where the transfer functions are obtained by the cross and power spectra of the input-output pair, the transfer functions might be estimated by the cross spectra of the input/output with the horizontal motion of the foundation. Furthermore, Naito (2004,2005) applied the proposed method as well as the recursive ARX method to a partly embedded analytical model and discussed their superiority or inferiority compared to other classical approaches. It was also shown that the fundamental frequency of the building might be estimated not only from the peak of the transfer functions, but also from the splitting effect of the coherence function at that frequency.
A number of studies have been reported on system identification of a building itself by isolating the SSI effect. The pioneer work done by Luco (1980, 1986) and later Matsuyama (2001), Yagi (2002) and Haraguchi (2003) contributed in this field.
The purpose of the present study was to investigate the system identification of a reactor building, Hamaoka nuclear power plant unit-4 reactor building (hereafter H4-RB), under fixed-base conditions using forced vibration tests, microtremors and earthquake observation data. Here, due to space limitations, the dynamic characteristics of the building in the NS direction only are addressed. In the following sections, a general description of the building, sensor locations and methodologies are briefly presented. At the end, the results and conclusions are discussed.
Exciter
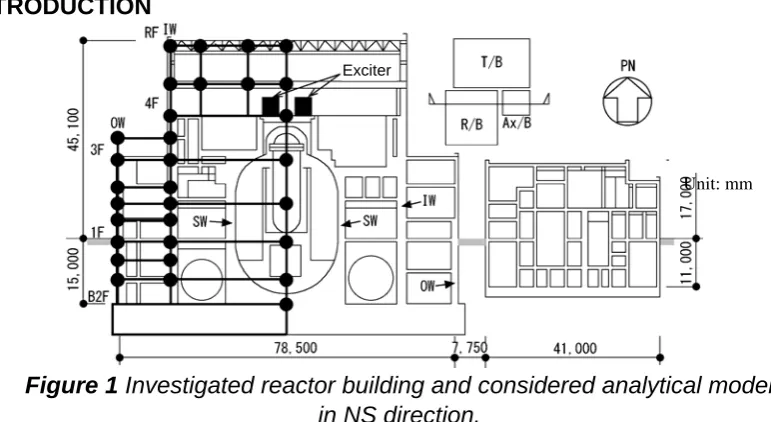
Figure 1 Investigated reactor building and considered analytical model
in NS direction.
2 GENERAL
DESCRIPTION
H4-RB is a reinforced concrete structure with steel frame at the roof. The foundation is 83.5m×83.5m in plan and 6.5m thick, and is directly founded on rock with an equivalent shear velocity of around 800 ms-1. The building extends 45.1m above ground level and 15m below ground level to B2F (Fig.1).
The forced vibration tests were performed in April and May 1992, using large counter-rotation
eccentric-weight-type exciters located at 4F (Nakagawa, 1998). Two 10-tonf-type exciters were used for horizontal excitation. The exciter locations are shown in Fig.2. The vibration tests in the NS direction were performed for two different sensor arrangements and the averaged horizontal motion at each floor was used as the representative motion of that level.
The microtremor observations were done just after the vibration tests were performed. The MIK system (Kajima, 1991) was used for data acquisition and processing.
The building was also investigated for earthquake observation records. Four events, namely, the 1995.04.18 earthquake of magnitude M=4.9, the 1996.10.05 earthquake of magnitude M=4.5, the 1997.3.16 earthquake of magnitude M=5.9 and the 1997.10.11 earthquake of magnitude M=4.9 were selected for the investigation. Fig.3 shows the epicenters of these earthquake events.
3 METHODOLOGIES
AND
CONSIDERATIONS
The data analysis was done for two different base conditions, 1) flexible base including SSI effect, 2) fixed-base case with SSI effect completely eliminated. The fixed-base transfer function of each mode due to the applied harmonic force on the multi-mass structure (Fig.4) can be obtained using the relation proposed by Naito (1997, 2003). Here, for brevity, the derivation is not repeated, and only the final result is shown.
α β γ θ
α β γ
s s s
s s e fix
s
y H
y
H
− +
− =
0 0
(1)
where:
ye: absolute horizontal displacement response at equivalent height,sH.
y0 and θ0: absolute horizontal displacement and rocking angle response at foundation level.
sβ: modal participation factor of s th
mode.
sγ: excitation participation factor of sth mode.
NS PN
NS EW EW
起振機
IW IW
Exciter
Figure 2 Plan of the operating floor
(4F) with location of the exciters.
Figure 3 Epicenter of the investigated
earthquakes.
138° 30’30’
30’
α: F/mi, exciter force divided by particle’s mass.
sβ, sγ andsH are estimated from the mass matrix and the corresponding fixed-base mode vectors of
the building. It can be seen that Eq.1 is independent of the soil properties and the only needed values are the response records, the exciter force, the mass matrix and the mode shape vector. The above
relation can be used for the ground motion excitation by setting the exciter acceleration to zero, where the numerator becomes the output (ye) and the denominator becomes the input motion (y0+Hθ0).
For the ground excitation (Naito, 2005), the transfer functions of the isolated fixed-base model are estimated using the following spectral relations:
) )( (
) ( 1
0 0 0 0
0 0 )
(
θ θ
θ
ω
H y H y
y H y
S S
H e
+ +
+
= (2a)
) ( 2
0 0 )
(
θ
ω
H y y
y y
e e e
S S H
+
= (2b)
) ( 3
0 0 0
0 )
(
θ
ω
H y y
y y
S S
H e
+
= (2c)
where, S is the cross (or power)-spectrum function. The above relations should theoretically be equal under ideal conditions, but generally are not due to noise or unmeasured input effect on the system. Relations (2a)~(2c) differ only in the way of the noise and unmeasured input effect cancellation. Relations (2a) and (2b) are those of the classical spectral analysis, where the former is less sensitive to the output noise and the latter is less sensitive to the input noise. Relation (2c) is a method recently proposed by Hikita et al. (2003), which is effective when unknown input, e.g. to the underground walls, exists in the system. In order to minimize the noise effect, ensemble averaging is needed for the cross-spectra and power-spectra of several data sets.
In addition to the spectral analysis, a simple single-input, single-output (SISO) recursive ARX model, based on the Forgetting Factor approach, has been used for the parametric system identification. The input and output definitions are as mentioned above. In a recursive parametric method, since the noise
mi
Absolute coordinate 0
y Hθ0
0 θ
i
θ
i
x
H
Foundation
m(i -1)
0 θ
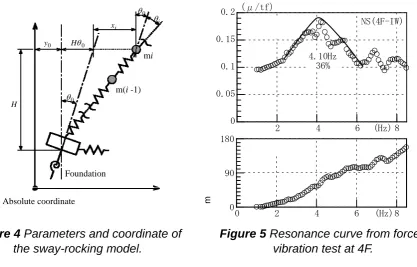
Figure 4 Parameters and coordinate of
the sway-rocking model.
0 0.05 0.1 0.15 0.2
2 4 6 (Hz)8
(μ/tf)
NS(4F-IW) 共振曲線
(振幅)
4.10Hz 36%
0 90 180
0 2 4 6 (Hz)8
位相遅れ (度)
Figure 5 Resonance curve from forced
vibration test at 4F.
is removed over all the frequencies, reliable results are expected. By introducing q-1 as the back-ward-shift operator, defined as q−iy(t)=y(t−i), the following equation can be written for an ARX model:
e x q B y q
A( )⋅ = ( )⋅ + (3)
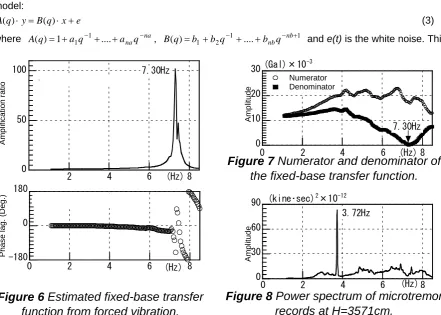
where A(q)=1+a1q−1+....+anaq−na, B(q)=b1+b2q−1+....+bnbq−nb+1 and e(t) is the white noise. This
relation relates the current output y(t) to a finite number of past outputs y(t-k) and inputs x(t-k). By determining the coefficients of the above polynomials for each time step, the modal parameters can be obtained. It is shown that the damping ratio and natural frequency of the system can be estimated using the roots of the denominator of the system transfer function for each time step, obtained from the procedure (Safak, 1989).
In order to apply the above methods to the actual measurement, it is useful to summarize the results obtained by Naito (2004, 2005).
1) The estimated fundamental frequency for the fixed-base condition using Eq.1 was 7.60Hz for forced vibration and 7.51~7.55Hz for ground excitation (CASE1) with R less than 3. These results show a small difference from the real fundamental frequency of the fixed-base model (7.30Hz). Here R is the ratio of the standard deviation of the input motion to the underground walls (x1) to that of the input motion from supporting soil (x0). These input motions were assumed to be uncorrelated.
2) It was also shown that the accuracy of the estimated modal parameters from Eq.(2c) and recursive ARX were relatively good. For the vertically incident wave case, where the two input motions are correlated, the results of Eq.(2a) and Eq.(2b) also gave acceptable results.
3) The drop in the coherence function in the vicinity of the real fixed-base fundamental frequency could indicate the existence of a natural mode at that frequency.
0 50 100
2 4 6 (Hz)8
伝達関数(応答倍率)
7.30Hz
180
0
-180
0 2 4 6 (Hz) 8
(度)
伝達関数(位相遅れ)
Figure 6 Estimated fixed-base transfer
function from forced vibration.
A
m
pl
if
ic
at
ion
rat
io
P
has
e
l
ag.
(Deg.
)
0 30 60 90
0 2 4 6 (Hz)8
(kine・sec)2×10-12 3.72Hz
Figure 8 Power spectrum of microtremor
records at H=3571cm.
A
m
pl
it
u
de
0 10 20 30
0 2 4 6 (Hz)8
(Gal)×10-3
7.30Hz 分子側
分母側
A
m
pl
it
ude
Numerator Denominator
Figure 7 Numerator and denominator of
4 RESULTS
4.1 Forced Vibration Test
Two sets of data for the two sensor arrangements were combined using the nominal frequency interval (Δf=0.05Hz). The observed amplitude A(ω) and phase lag θ(ω) from the vibration test were converted into complex form using Y(ω)=A(ω)e-iθ(ω)
, where i is the complex number −1.
The fundamental vibration frequency and damping ratio of the flexible base case were calculated from observation data. These parameters were obtained by a curve fitting process of the resonance curve corresponding to the inner wall (IW) at 4F. The result is shown in Fig.5. The predominant peak is
around 4.1 Hz and the calculated damping ratio is 36%. The level of damping ratio shows a large soil-structure interaction effect in the system.
The fixed base transfer function is estimated using the method described in section 3. The IW angle is used as a representative base rocking angle. Using the analytical model in the NS direction (Fig.1), the equivalent height from the top of the foundation (1H=3571cm), the participation factor (1β=4.4324)
and the excitation factor (1γ=0.1521) of the first mode are obtained. The exciters were located on 4F
slab between the IW and the sealed wall (SW), which correspond to two masses at 4F in the analytical lattice model. The applied force must be divided between these masses. Considering the actual displacement of the building and taking into account the response of the analytical model, the sharing ratio of the applied force between SW and IW is set to 0.85:0.15.
The values needed in Eq.1 are considered as follows: ye is obtained by interpolating the averaged responses of 3F and 4F at 3571cm, y0 is calculated using the averaged records at the base level (B2F) and θ0 is calculated from the IW rocking motion at B2F. The difference and the effect of other rocking motions, namely the outer wall (OW) and SW, on the results of the estimated transfer functions will be discussed in section-5.
The fixed base transfer function of the reactor building is calculated from the above bases, and the
0 5 10
4 5 6 7 8
H1
H2
H3
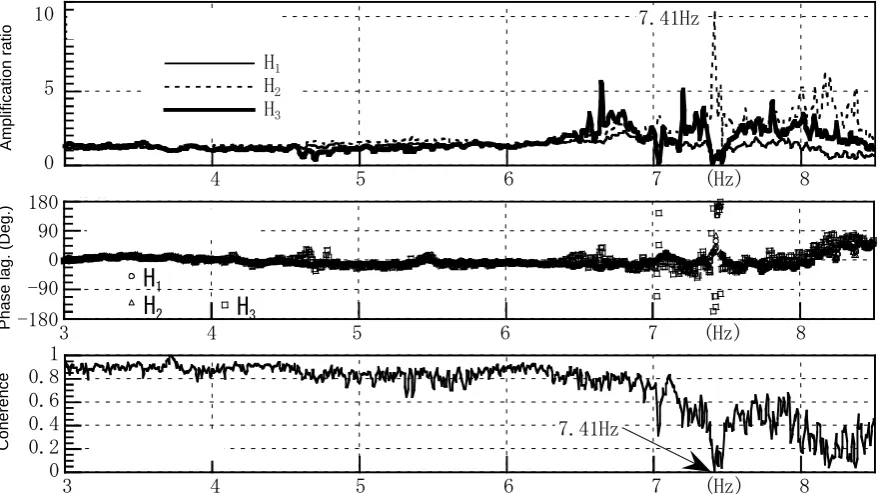
(Hz) 7.41Hz 伝達関数(応答倍率)
-180 -90 0 90 180
3 4 5 6 7 (Hz) 8
(度)
伝達関数(位相)
H
1H
2H
30 0.2 0.4 0.6 0.8 1
3 4 5 6 7 (Hz) 8
コヒーレンス 7.41Hz
Amplification ratio
Phase lag. (Deg.
)
Coherence
results are shown in Fig.6. It can be seen that the predominant peak is moved to 7.3Hz and the estimated damping ratio becomes 0.4%. The numerator and denominator of the transfer function are shown in Fig.7. The deep point at 7.3Hz of the denominator corresponds to the peak of the fixed-base transfer function. The reason why the phase lag of the transfer function is in the opposite direction around the peak, as discussed by Naito (2003), might be due to small phase errors during the measurement. The damping ratio (0.4%) looks small although the amplitude of the vibration is very small. Naito (2004, 2005) showed that adding the embedment soil springs, to the structure with given 1% damping ratios increases the damping ratio to 2.7% (CASE1). It was also shown that the estimated damping ratios have large differences for different cases. Therefore, the estimated damping ratio for the fixed base condition includes some errors.
4.2 Microtremor Observation
The microtremor observations were made just after the forced vibration test. Seven frames were used for the investigation. The records are in mkine with 102.4Hz sampling rate and 280sec length for each frame. The records are filtered using a band pass filter with a frequency pass of [0.5Hz- 12Hz] and resample to 25.6Hz.
Using a 2000-point window, the power spectra of the investigated frames are calculated. From the amplitude of the power spectrum, it can be seen that 3.72Hz is the vibration frequency for the SSI case (Fig.8).
For the fixed-base condition, the input is the averaged summation of the horizontal response (y0) and
rocking motion (Hθ0) at B2F, and the output is the averaged response at H=3571cm obtained from interpolation of the records at 3F and 4F. The IW representative angle is used for the base rocking motion.
For the spectral analysis, the transfer functions are calculated by averaging the values over all
(a) Natural frequency
(b) Damping ratio
5 6 7 8 9
50 100 150 200 250(sec)
振動数(Hz)
本フレーム平均値=7.30Hz 全フレーム平均値=7.23Hz
0 0.1 0.2 0.3 0.4 0.5
50 100 150 200 250 (sec)
減衰定数
全フレーム平均値=5.5%
本フレーム平均値=5.6%
Avr. of all frames
Avr. of all frames Avr. of this frames
Avr. of this frames=5.6%
(Hz)
Figure 10 Estimated modal parameters from
frames. The predominant peak of H2 at 7.41Hz is the first mode of the fixed base case (Fig. 9). The notch at 7.41Hz in the coherence function around the predominant peak of the transfer function is also observed. This phenomenon is also shown by Naito (2004, 2005). The first modal parameters of the fixed-base condition are also estimated using the ARX recursive model. The procedure is carried out for all frames and the modal parameters are calculated for each frame, but only the results of one frame are shown here. The window in the calculation is selected using the forgetting factor λ=0.99 (βs=λt-s
). These results show that the variation of the first mode frequency is around 7.3Hz and the damping ratio
is about 5.6% (Fig.10).
4.3 Earthquake Observation
The above-mentioned earthquake events are used for the investigations. The records have a 100Hz sampling rate with a length of 81.92sec. They are filtered using a band pass filter with a pass range of
-5 0 5
0 10 20 30 40 50 60 70(sec)80
(Gal) 1995.04.18
0 0.02 0.04 0.06
0 2 4 6 8 (Hz)10
(Gal・sec) 1995.04.18
-10 -50 5 10
0 10 20 30 40 50 60 70(sec)80
(Gal) 1996.10.05
0 0.03 0.06 0.09
0 2 4 6 8 (Hz)10
(Gal・sec) 1996.10.05
-8 -40 4 8
0 10 20 30 40 50 60 70(sec)80
(Gal) 1997.03.16
0 0.05 0.1
0 2 4 6 8 (Hz)10
(Gal・sec) 1997.03.16
-15 0 15
0 10 20 30 40 50 60 70(sec)80
(Gal) 1997.10.11
0 0.04 0.08 0.12
0 2 4 6 8 (Hz)10
(Gal・sec) 1997.10.11
-10-5 0 5 10
0 10 20 30 40 50 60 70(sec)80
(Gal) 1995.04.18
0 0.05 0.1
0 2 4 6 8 (Hz)10
(Gal・sec) 1995.04.18
-15 0 15
0 10 20 30 40 50 60 70(sec)80
(Gal) 1996.10.05
0 0.04 0.08 0.12
0 2 4 6 8 (Hz)10
(Gal・sec) 1996.10.05
-10 0 10
0 10 20 30 40 50 60 70(sec)80
(Gal) 1997.03.16
0 0.05 0.1 0.15
0 2 4 6 8 (Hz)10
(Gal・sec) 1997.03.16
-20 0 20
0 10 20 30 40 50 60 70(sec)80
(Gal) 1997.10.11
0 0.05 0.1 0.15
0 2 4 6 8 (Hz)10
(Gal・sec) 1997.10.11
(a)
y
0+
H
θ
0 (b)y
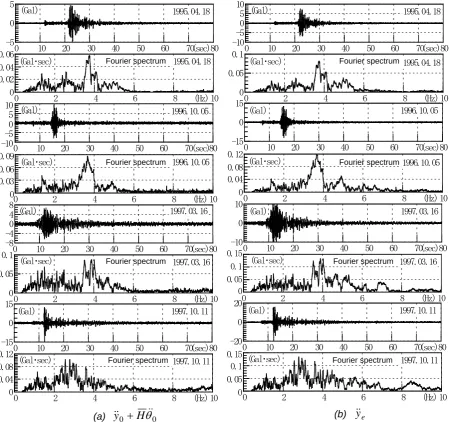
eFigure 11 Response at foundation (
y
0+
H
θ
0) and equivalent height (
y
e)
obtained from earthquake records.
Fourier spectrum Fourier spectrum
Fourier spectrum Fourier spectrum
Fourier spectrum Fourier spectrum
[0.5Hz- 20Hz] and then resampled at 0.02sec time intervals. The input-output pair waveforms and corresponding Fourier transform amplitudes used in the analysis are shown in Fig.11. It can be seen from the Fourier spectra that these earthquakes have relatively low amplitude for frequencies over 5.5Hz compared to the lower frequency range.
Eq.(2a)~(2c) is applied to the input and output pairs and the estimated transfer functions are shown
0 10 20 30 H1 H2 H3 逆ナイキスト 1997.03.16 振幅 6.10Hz 2.5% -180 -90 0 90 180 逆ナイキスト 1997.03.16 (度) 位相
H1 H2 H3
0 0.5 1 1997.03.16 コヒーレンス 0 5 10 H1 H2 H3 逆ナイキスト
1997.10.11 振幅 6.18Hz
-180 -90 0 90 180 逆ナイキスト 1997.10.11 (度) 位相
H1 H2 H3
0 0.5 1
0 1 2 3 4 5 6 7 8
1997.10.11 (Hz) コヒーレンス -180 -90 0 90 180 逆ナイキスト
1996.10.05(度) 位相
H1 H2 H3
-180 -90 0 90 180 逆ナイキスト 1995.04.18 (度) 位相
H1 H2 H3
0 0.5 1
0 1 2 3 4 5 6 7 8
1996.10.05 (Hz) コヒーレンス 0 5 10 15 20 H1 H2 H3 逆ナイキスト 1996.10.05 振幅 6.30Hz 0 0.5 1 1995.04.18 コヒーレンス 0 10 20 30 H1 H2 H3 逆ナイキスト 1995.04.18 振幅 6.69Hz 6.3% A m pl if ic ati o n P hase (D eg. ) C ohe re nce A m pl if ic ati o n P hase (D eg. ) C ohe re nce Am plific a tio n P hase (D eg. ) C ohe re nce Am plific a tio n P hase (D eg. ) C ohe re nce
Inv. Nyquist Inv. Nyquist
Inv. Nyquist Inv. Nyquist
Inv. Nyquist Inv. Nyquist
Inv. Nyquist Inv. Nyquist
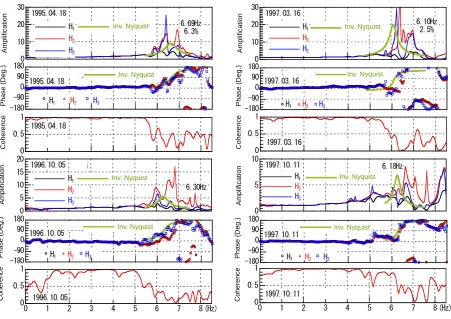
Figure 12 Estimated transfer functions and coherence functions from each
earthquake events.
-1 -0.5 0 0.5 1-2 -1 0 1 Real(1/H) Ima g(1/ H) 逆ナイキスト 1995.04.18 event 1996.10.05 event 1997.03.16 event 1997.10.11 event -1 -0.8 -0.6 -0.4 -0.2 0 0.2 0.4
-1 -0.5 0 0.5 1 Real(1/H) Im ag (1 / H) 逆ナイキスト -0.8 -0.4 0 0.4 0.8
5 6 7 8 Freq.(Hz) R eal ( 1/ H) 振動数依存 -10 0 10 20
-5 0 5 10 15 20 Real(H) Im a g( H) ナイキスト -3 -2 -1 0 1
-5 -4 -3 -2 -1 0 1 Real(1/H) Im a g(1/ H) 逆ナイキスト -5 -4 -3 -2 -1 0 1
4 5 6 7 8 Freq.(Hz) Re a l(1 /H) 振動数依存 -2 -1.5 -1 -0.5 0 0.51 1.5
5 6 7 8 Freq.(Hz) Real (1/H ) 振動数依存 -20 -10 0 10 20 30
-20-10 0 10 20 30 Real(H) Im a g( H) ナイキスト -2 1 4 7 10
-6 -3 0 3 6 Real(H) Ima g( H) ナイキスト -1 -0.8 -0.6 -0.4 -0.2 0 0.2
-2 -1 0 1 2 Real(1/H) Ima g(1/ H ) 逆ナイキスト -2 0 2 4 6 8
-5 -2.5 0 2.5 5 Real(H) Ima g( H) ナイキスト -2 -1 0 1
5 6 7 8 Freq.(Hz) Rea l( 1/H ) 振動数依存
in Fig.12. These transfer functions are obtained using 1024-points with a 512-point overlap and then averaged. The amplitude peak, the change of the phase and the drop of the coherence are observed in the range of 6~7Hz. Since no single dominant peak is observed, in order to estimate the predominant frequencies and damping ratios, the inverse Nyquist method has been applied to the transfer function obtained as H3. The estimated transfer function based on the inverse Nyquist method and the corresponding predominant frequency and damping ratio are shown in Fig.12. The data that explain the inverse Nyquist calculations are shown in Fig.13. The results in Figs.12-13 show that the estimated predominant frequencies are in the range of 6.10Hz~6.69Hz. Unlike the microtremor results, the
splitting effect of the coherence function around the predominant frequency is not clear. In addition, the estimated transfer functions have several peaks. These problems can be explained as follows:
1) The accuracy of the accelerometer used for the earthquake observation is less than that of the velocity meter used for microtremor observation. Furthermore, as shown in Fig.11, the power of the input signal for frequencies higher than 5.5Hz is small, so the SN ratio will be lower compared to the microtremor observations.
2) The earthquake data is short compared to the microtremor observation. This might be another reason.
The SSI case is investigated using the records of the 1997.03.16 event. The input motion is selected at GL-150m (borehole) and the output is the averaged response at H=3571cm. The transfer function is calculated using the spectral analysis and is shown in Fig.14. The peak around 4Hz corresponds to the frequency of the first mode. It is noted that the peak around 1.5Hz is due to the ground amplification and not the building vibration. From the ARX model, the time varying modal parameters are also obtained (Fig.15). The results are only shown for the part of the records that have large amplitude.
(a) Frequency (b) Damping ratio
3 4 5 6 7 8
10 12 14 16 18(sec)20 1997.03.16 6.58Hz 4.13Hz (Hz) 3 4 5 6 7 8
10 12 14 16 18(sec)20 1997.10.11 6.39Hz 4.09Hz (Hz) 0 0.1 0.2 0.3 0.4 0.5
10 12 14 16 18(sec)20 1997.03.16 0.1375 0.0030 0 0.1 0.2 0.3 0.4 0.5
10 12 14 16 18(sec)20 1997.10.11 0.2316 0.0926 3 4 5 6 7 8
15 16 17 18 19(sec)20 1996.10.05 6.42Hz 4.08Hz (Hz) 0 0.1 0.2 0.3 0.4 0.5
15 16 17 18 19(sec)20 1996.10.05 0.0860 0.0170 3 4 5 6 7 8
20 22 24 26 28(sec)30 1995.04.18 基礎固定系
相互作用系 (Hz)
6.68Hz
4.00Hz 0.10 0.2 0.3 0.4 0.5
20 22 24 26 28(sec)30 1995.04.18 基礎固定系 相互作用系 0.1069 0.0501 Fixed-base SSI Fixed-base SSI -6 0 6
20 40 60 (sec)80
GL-150m 時刻歴 (Gal) 1997.03.16 0 0.01 0.02 0.03 0.04 0.05
0 2 4 6 8 (Hz)10
フーリエスペクトル (Gal・sec) 0 10 20 30 40
0 2 4 6 8
H1 H2 (Hz) 伝達関数振幅 3.91Hz -180 -90 0 90 180
0 2 4 6 (Hz)8
伝達関数位相 H1
H2
Fourier spectrum
Phase lag. (Deg.
)
Figure 14 Input motion at GL-150m and
transfer function of the SSI system.
Figure 15 Estimated modal parameters
4.4 Summary of System Identification
The system identification is summarized in Table 1. It is noted that the values for the recursive method are averaged over the time range where the waveforms have their main power. Considering the fixed-base predominant frequency, some scattering is observed. For the forced vibration and microtremors that have infinitesimal amplitude level, the predominant frequency is around 7.23Hz~7.41Hz. For the earthquake observation, this value is 6.10Hz~6.69Hz for spectral analysis and 6.39Hz~6.68Hz for parametric identification.
For the damping ratio estimation, as discussed by Naito (2004, 2005), the scattering is large. Since the signal power of the earthquake records is small, the estimated damping ratios are scattered. Hence, more study is needed using earthquake records with larger power in the high frequency range and microtremor data with better S/N ratio or longer duration.
0 0.1 0.2 0.3
5 6 7 8
IW OW SW
(Hz) ×10-2(μrad/tf)
基礎回転角
80 100 120 140 160 180
5 6 7 (Hz)8
(度) 位相
OW IW
SW
Nor
m
al
iz
ed a
m
pl
it
ude
P
has
e l
ag.
(D
eg.
)
Figure 16 Calculated base rocking
angles for different locations.
0 30 60 90 120
6 7 (Hz)8
応答倍率 伝達関数
IW
Avr(IW,OW)
Avr(SW,IW)
Avr(SW,OW)
Avr(SW,IW,OW)
A
m
p
lif
ic
a
ti
o
n
r
a
ti
o
-180
-90
0
90
180
6 7 (Hz)8
(度)
位相
IW
Avr(IW,OW)
Avr(SW,IW) Avr(SW,OW)
Avr(SW,IW,OW)
P
has
e l
ag
(De
g.
)
‐ ‐
Figure 17 Estimated fixed-base transfer
Table 1 Estimated modal parameters for each method.
5 DISCUSSION
5.1 Effect of Different Foundation Rocking Motions
The calculated rocking motions at the foundation using three different vertical motions, namely SW,
IW and OW, are shown in Fig.16. The estimated fixed-base transfer functions using IW rocking angle, the average of SW with IW or OW and the average of IW with OW are shown in Fig.17. From these results the following can be said:
1) The estimated transfer functions differ slightly for different evaluations of the rocking angle of the foundation mat. Although the superstructure and the foundation mat are very stiff, out-of-plane deformation occurs on the foundation surface.
2) Therefore, it is necessary to use the same evaluation of the rocking angle when checking the Frequency (Hz) Damping ratio (%)
SSI Fixed-base SSI Fixed-base
Forced vibration 4.1 7.30 36 0.4
Microtremors (Spectral) 3.72 7.41 − −
Microtremors (ARX) − 7.23 − 5.5
1995.04.18 4.05 6.69 6.3
1996.10.05 3.81 6.30 −
1997.03.16 3.91 6.10 2.5
Earthquake (Spectral)
1997.10.11 − 6.18
−
−
1995.04.18 4.00 6.68 10.7 5.0
1996.10.05 4.08 6.42 8.6 1.7
1997.03.16 4.13 6.58 13.8 0.3
Earthquake (ARX)
1997.10.11 4.09 6.39 23.2 9.3
0 0.1 0.3 0.3
5 6 7 8
100_000 085_015 070_030
(Hz) (μ/tf)
共振曲線
IW SW
-180
-135
-90
-45
0
5 6 7 (Hz) 8
(度) 位相
100_000 085_015 070_030
IW
SW
Norm
al
iz
ed a
m
pl
it
ude
P
has
e l
a
g.
(Deg.
) -180
-90
0
90
180
6 7 (Hz) 8
(度) 090_010
085_015
080_020
070_030
0 30 60 90 120
6 7 (Hz)8
応答倍率 伝達関数
SW IW
090_010
085_015
080_020
070_030
‐ ‐
A
m
pl
if
ic
at
ion
rat
io
P
has
e l
a
g.
(Deg.
)
Figure 18 Response at 4FIW and SW
from analytical model.
Figure 19 Estimated transfer functions
change in the dynamic characteristic of the superstructure during its service life,
5.2 Effect of Sharing Ratio of Applied Force
As discussed in chapter 4.1, the exciters are located at 4F slab between IW and SW, which correspond to two masses at 4F in the analytical lattice model. The effect of the sharing ratio of the applied force is investigated in this section. Using the analytical model of the building (Fig.1), the response at 4FIW and SW for different sharing ratios of applied force is calculated (Fig.18). It can be seen that by changing this ratio, the response changes. The estimated fixed-base transfer functions using the observed data and different sharing ratio of the applied force are plotted in Fig.19. The sharing ratio of the applied force to SW and IW is set to 0.90:0.10, 0.85:0.15, 0.80:0.20 and 0.70:0.30, respectively. It can be seen that the estimated transfer functions differ from case to case. Therefore, it is also necessary to use a similar ratio of applied force when checking the dynamic characteristics of the superstructure during its service life using exciters.
5.3 Effect of Ensemble Averaging
Using the analytical model CASE1 investigated by Naito (2004, 2005), the effect of ensemble averaging on the results of the estimated fixed-base transfer function is investigated. The total number of averaging is set to 100, 1000 and 5000 times. The R-value (Naito, 2004, 2005) is selected as 1.5 (x1:x0=1.5:1). The random waves with lengths of 100sec and frequency sampling of 40.96Hz are used for the input waves as well as the extra-input, and the dynamic response of the model is obtained for each degree of freedom using the frequency domain calculations. By applying Eqs.(2a)~(2c) to the model response, the fixed-base transfer functions are estimated for each case and are plotted in Fig.20. It can be seen that smoother results can be obtained by increasing the number of averaging.
6 CONCLUDING
REMARKS
The fixed-base dynamic characteristics of a partly embedded nuclear reactor building have been investigated using data obtained from forced vibrations, microtremors and earthquake observations. Effects resulting from out-of-plane deformation of the base mat, the sharing ratio between the sealed and inner walls of the exciter force, and the amount of frame averaging needed for reliable spectral analysis have also been studied.
Although a clear transfer function has been estimated for the forced vibration test, the results from the microtremors and earthquake observations show some scattering. For the earthquake records, the
Am
p
lifi
ca
tio
n
r
a
tio
Am
p
lifi
ca
tio
n
r
a
tio
Am
p
lifi
ca
tio
n
r
a
tio
100 times 1000 times 5000 times
examined signals have small power for the frequency higher than 5.5Hz; therefore, more investigation is needed using larger events. For microtremor observation, longer observation might lead to better estimation of the transfer functions. In addition, by measuring the slab deformation due to the exciter force, it will be possible to estimate the sharing ratio of the applied force.
REFERENCES
1) Ishibashi, T. and Naito, Y., (1994), System identification methods of buildings considering rocking motion of the base, Kajima Technical Research Institute annual report, No.42, pp. 199-203, (in Japanese).
2) Naito, Y., Sato, K., Uchiyama, S., Masuda, K., Iwamoto, K., (1997), System Identification of Structural Characteristics for Ground Motion Using Forced Vibration Test Results, Transactions of the 14th International Conference on Structural Mechanics in Reactor Technology (SMiRT 14) K05/1, pp.185-192.
3) Naito, Y., Yano, T., Iguchi, M., Kitada, Y., (2003), System identification of a building alone with the effect of dynamic soil-structure interaction eliminated, Trans.of AIJ, Journal of structural and construction engineering, No.564, pp.39-46, (in Japanese).
4) Hikita, T., Naito, Y., Niousha, A., Harada, H., (2003), Dynamic characteristic estimation of the building during microtremors considering rocking motion of the base, Trans.of AIJ, Journal of structural and construction engineering, No.566, pp.37-44 (in Japanese).
5) Naito, Y. and Niousha, A., (2004), Analytical study on system identification of fixed-base transfer functions for an embedded reactor building, Trans.of AIJ, Journal of structural and construction engineering, No. 579, pp.31-38 (in Japanese).
6) Naito, Y. and Niousha, A., (2005), Analytical study on system identification of fixed-base transfer functions for an embedded reactor building, SMiRT-18, K05/4.
7) Luco, J. E. (1980), Soil-structure Interaction and Identification of Structural Models, Proc. 2nd ASCE Conf. on Civil Eng. and Nuclear Power, Vol. 2, pp. 10/1/1-10/1/31.
8) Luco, J. E., Wong, H.L., and Trifunac, M. D., (1986), Soil-structure Interaction Effects on Forced Vibration Tests, Report 86-05, Dept. of Civil Engineering, Univ. So. Calif., Los Angeles, California. 9) Matsuyama, C., Fukuwa, N. and Tobita, J., (2001), Dynamic characteristics of adjacent low and medium-rise buildings based on the earthquake observation, forced vibration experiment and microtremor observation, Trans.of AIJ, Journal of structural and construction engineering, No.545, pp.87-94, (in Japanese).
10) Yagi, S., Fukuwa, N. and Tobita, J., (2002), Influence of rotational foundation input motion due to Rayleigh wave on transfer function estimation of low-rise RC buildings based on microtremor observation, Trans.of AIJ, Journal of structural and construction engineering, No.552, pp.77-84, (in Japanese).
11) Haraguchi, K., Kanda, J. and Inagaki, M., (2003), A method for identification of the multistoried buildings considering soil-structure interaction by microtremor observation, Trans.of AIJ, Journal of structural and construction engineering, No.564, pp.31-37, (in Japanese).
12) Nakagawa, S. et al., (1998), Forced vibration tests and simulation analyses of a nuclear reactor building, Nuclear Engineering and Design, No.179, pp.145-156.
14) Safak, E., (1989), Adaptive Modeling, Identification, and Control of Dynamic Structural Systems. I: Theory, Journal of Engineering Mechanics, 115, 11, pp.2386-2405.