Transactions of the 17th International Conference on Structural Mechanics in Reactor Technology (SMiRT 17)
Prague, Czech Republic, August 17 –22, 2003
Paper # M02-5
Seismic PSA for NPP Paks of Hungary
Attila Bareith1), Zoltán Karsa1), John W. Stetkar2)
1) VEIKI Institute for Electric Power Research Co., Budapest, Hungary 2) ABS Consulting, Inc, Irvine, CA, USA
ABSTRACT
A seismic probabilistic safety assessment of the NPP Paks has been performed. Steps of the accident sequence model development are described including grouping of equipment failures, identification of seismic-induced transient initiating and additional failures, development of functional event trees for single transient initiating failures and development of a generic event tree. Quantification of the seismic model was done using well-known commercial as well as specific novel computer codes. The quantification process is also described.
KEY WORDS: seismic PSA, core damage frequency, seismic hazard, acceleration range, fragility, seismic capacity,
liquefaction, transient initiating failure, seismic-induced failure, walkdown screening, generic event tree, containment performance
INTRODUCTION
A comprehensive program has been performed for the four VVER-440, type 213 reactors of the Paks NPP in Hungary to re-evaluate and improve the resistance of the plant against seismic events. Although the approach followed in the program was a combination of seismic margin assessment and the use of experience-based methods (SQUG), the last stage included a probabilistic safety assessment (PSA) for seismic events too.
The objectives of the seismic PSA were to
• determine the seismic-induced core damage frequency for NPP Paks
• identify plant vulnerabilities and
• provide feedback to further improvements, if necessary.
The seismic PSA study covered plant operation at full power and a given unit (unit 3) was selected as a reference unit for the analysis. In addition to the risk of core damage, containment performance was also evaluated to enable future extension to a level 2 PSA.
The fundamental parts of the analysis process were identical to the traditional steps of a seismic PSA including assessment of seismic hazard, development of seismic fragilities for safety related structures and components, development of accident sequence and system models for seismic-induced plant transients, and computation of core damage frequency. Each analysis step was a considerable challenge due to the fact that hardly any detailed seismic PSA has ever been performed for a VVER plant.
DEVELOPMENT OF THE ACCIDENT SEQUENCE MODELS
The main objective of developing the accident sequence models is to construct an event tree structure that integrates event trees developed earlier within the internal initiator PSA study and specific earthquake-induced transients into a generic model that reflects the specifics of an earthquake. The accident sequence models were developed in the following major steps:
• selection (grouping) of equipment level failures that can be caused by different seismic-induced failures (groups)
• identification of transient initiating failures and additional system, train or component level failures and degradations that can be caused by any combination of equipment failures selected for a group, establishment of a list of transient initiating failures that can be caused by an earthquake
• development of functional event trees for single transient initiating failures
• development of a generic event tree for modeling plant responses to an earthquake with combinations of single and multiple transient initiating failures
• modeling containment performance.
Grouping of Equipment Failures
groups contain equipment that is inherently rugged or has been upgraded. The high screen category was found to be common for the mechanical and electrical and I&C components, while low screen mechanical components were assigned a different fragility value than the low screen electrical and I&C components. Those components that did not meet the screening criteria for either category were then considered as potential candidates for specific fragilities. These specific fragilities and the associated grouping of equipment as well as structural failures and the associated fragilities were identified. Based on that the groups were listed that were then examined to determine the equipment level failures. Groups mean the seismic-induced failures characterized by the same seismic resistance being either a real group of e.g. mechanical components or a structural failure. Finally, in addition to the one high screen and the two low screen categories (groups) the following groups of unscreened equipment and structures were listed for examination:
• 27 groups of mechanical equipment, grouping based on equipment type and/or location,
• 9 groups of electrical and I&C cabinets, grouping based on cabinet location,
• 20 groups of electrical and I&C relays (contact devices), grouping based on relay type,
• 11 structural failures,
• 2 degrees of liquefaction, based on the difference in consequences.
It is noted that during the quantification all the unscreened cabinets and relays were assigned a single fragility value (i.e. the 29 groups of cabinets and relays were treated as one large group) due to the fact that there was only one fragility value that applied to all of these components.
Identification of Failures
It was a basic modeling assumption that all equipment level failures selected for a given group occur simultaneously, i.e. equipment level failures within a group were assumed to be fully correlated. Potential transient initiating failures and additional system, train or component level failures and degradations were identified by a thorough examination of the equipment level failures selected for each group. The impact of block wall collapse on electrical cables was also taken into consideration during the identification of seismic induced failures. During this examination failures that can be caused by the simultaneous occurrence (AND connection) of different group failures were also identified.
The list of transient initiating failures and additional failures and degradations was identified for each group. An example of the failure listings is given in Table 1 where failures caused by the turbine building damage are shown. In order to be able to do parametric studies and refinements during model quantification failures caused by the unscreened electrical and I&C equipment were identified separately for the 29 groups. Extensive and detailed analysis of electrical circuit diagrams was performed to determine the consequence of I&C failures including seismic induced chattering of contact devices. The failures identified can be recoverable or unrecoverable. In general, relay failures may be recoverable. The likelihood of recovery depends on the type of relay, its failure mode, the possibility of remote or local actions to operate the affected equipment, and the overall plant conditions after the failure occurs. Recovery from cabinet failures is generally much more difficult, because failure of the cabinet anchorage will damage the internal relays and the cabinet cable connections. In these cases, recovery of specific components almost always requires local operation of the affected equipment. Mechanical failures and direct failures caused by structural failure or liquefaction were considered unrecoverable. It is noted however that even if all the failures in a group are identified recoverable their simultaneous occurrence and the earthquake itself may result in such a mental and/or physical load to the operators that they may become practically unrecoverable. This aspect of recovery was dealt with in details during the model development.
Table 1. Sample list of failures caused by the turbine building damage
GROUP: Structure 4 – Turbine Building
Transient initiating failure(s):
• unrecoverable loss of all feedwater pumps
• steam and feedwater header ruptures → total loss of (main and emergency) feedwater
• service water line ruptures → unrecoverable loss of service water → loss of RCP intermediate cooling circuit
• loss of offsite power
Failure(s):
• unrecoverable failure of the emergency feedwater system
• unrecoverable failure of the secondary side decay heat removal system
Based on the failures identified the list of transient initiating failures that can potentially occur due to an earthquake was established. Most of the transient initiating failures had their equivalents among the internal event PSA initiating events, but there were some that had not been modeled in the internal event PSA. The latter included transient initiating failures like inadvertent closure of all main gate valves, inadvertent closure of all steam generator isolation valves and others. These were not modeled in the internal event PSA due to the low likelihood of occurrence, but their likelihood has become notable due to some seismic-specific effects like e.g. relay chatter.
Development of Event Trees for Single Transient Initiating Failures
In order to be able to combine different initiating events and different event trees first the existing PSA model for internal initiators was extended by the initiating event earthquake without assuming any other transient initiating failure except for loss of off-site power. An event tree was developed for such an initiating event that describes the mitigation process as designed in the seismic safety technological concept (SSTC) for the design level earthquake. The reason for doing so was that the SSTC assumes only one transient initiating failure (loss of off-site power) as the consequence of the earthquake, and thus it was seen necessary and useful to construct an event tree to describe the mitigation process as defined in the SSTC. This model is then combined with other possible transient initiating failures (PSA initiating events) and their effects that can be induced by an earthquake. The following assumptions were made during the construction of the event tree for the SSTC.
1. The only transient initiating failure that can be caused by the earthquake is loss of off-site power. Although the design basis of the SSTC takes it as true event, from the PSA perspective it was considered that loss of off-site power can occur with a certain probability as characterized by the fragility of the equipment whose failure can lead to such an event. Therefore, loss of off-site power appears as an event tree header. This approach ensures that a transient initiating failure can be combined with other failures. Also, different event probabilities in different ranges of seismic acceleration can be taken into account in this manner.
2. Although loss of off-site power has a certain probability depending on the earthquake level, it is conservatively assumed that once the off-site power is lost it will be unavailable for 72 hours (no credit is given to recovery of normal power supply within this timeframe) in agreement with the assumption of the SSTC. So the emergency diesel generators should provide power supply in this case for 72 hours.
3. The system of water demineralization in the secondary circuit is conservatively assumed unavailable for 72 hours in agreement with the assumption of the SSTC. This implies that a success state cannot be reached by open loop secondary side heat removal only due to the limited amount of demineralized water. In fact, the water contained in the demineralized water tanks (WP tanks) is the only available source for secondary side make-up. Closed loop secondary side heat removal is also necessary for success. The SSTC relies exclusively on the secondary side decay heat removal system for cooling in a closed loop. However, the normal route of cooling (main condenser relief valves, condensers, main condensate system) is also considered in the PSA model as an alternative way of ensuring a success state through secondary side heat removal in a closed loop.
4. Cold shutdown is not the only success endstate. In line with the general practice of PSAs a success state can be assumed with high level of confidence, if core damage can be prevented in hot shutdown for a certain period of time that is intentionally defined in a conservative way. In our case this time window is chosen to be 72 hours based on the assumptions of the SSTC. The hot shutdown state can be realized by the steam-water operational mode of the secondary side decay heat removal system, so that the emergency feedwater pumps are in operation not the decay heat removal pumps.
5. It is conservatively assumed that once a primary LOCA (small LOCA) occurs, then it can be isolated only by means of closing appropriate main gate valves. Small LOCA can be due to e.g. failure of the valves of the system of organized leakage to close.
6. As a general rule, cooling below 245 oC is not allowed until the primary circuit is borated. Consequently, if boration
cannot be performed for whatever reason, then the only successful endstate can be hot shutdown kept for 72 hours. 7. It is assumed that changing the operational mode of the secondary side decay heat removal system from steam-water
to water-water mode cannot be performed if primary pressure is not decreased sufficiently by means of injecting cold water by the high pressure ECCS into the pressurizer.
In addition to developing the event tree for the SSTC, other transient initiating failures were examined to determine whether plant responses are designed to be the same for random and for seismic-induced events or not. During this examination a single transient initiating failure (induced by the earthquake) was assumed in each case. The major finding of the analysis is that the plant responses and the mitigation process for the events that are included in both the initiating event list of the internal initiator PSA and the list of seismic-induced transient initiating failures are virtually the same for random initiating events and for seismic-induced transients except for the loss of all 6 kV busbars event. The latter, however, has already been included in the event tree for the SSTC. New event trees were developed for the events concerned with inadvertent operation of multiple valves not yet included in the internal events PSA.
the internal initiator PSA. With regards to the type C (post-initiator) operator actions the following assumptions were generally used for the analysis (the concept of type B – initiator type – actions is not meaningful in the seismic PSA):
• For accelerations less than approximately 0.3 g, the normal post-initiator operator error rates from the internal events PSA model are used, except for those cases when specific damages are caused by the seismic induced (mainly structural) failures, e.g. damage to the main control room, or structural failures that prevent access to local equipment.
• For all accelerations higher than approximately 0.3 g, it is assumed that the performance of the operators is strongly affected by the seismic initiator, and there is a loss of reliable short-term cognitive performance. All post-initiator operator actions are conservatively assumed failed for these accelerations.
An important issue has arisen during the examination of the existing event trees and during the development of new ones. This is namely the harmonization between mission times. As it has been mentioned above SSTC assumes several failures prolonged for 72 hours. Loss of offsite power is among them, so from this perspective diesel generators should provide power supply for 72 hours (no recovery is assumed in the SSTC). At the same time the original PSA follows the processes only for 24 hours. Examining the problem two aspects have been found that would increase the core damage risk if mission times were extended.
• The first aspect is the increase in the average failure probability of the safety equipment (e.g. safety pumps or diesel generators) that should run for as long as the mission time. Such an increase is certainly conservative due to the fact that there are usually redundant trains in a safety system that cause a system failure in and AND connection. Simple multiplying of the average failure probabilities of the redundant systems gives in fact a probability that none of the redundant trains is able to fulfil a given safety function alone. It is noted that no repair is considered here. Extending, however, the mission time the likelihood of repairability increases.
• The second aspect is that - in contrary to the existing internal event PSA model - open loop secondary side heat removal cannot lead to ultimate success due to the limited resources. The risk increase due to this aspect appears justified considering the possible effects of an earthquake.
Based on the above it was decided to use the mission time of 24 hours of the original PSA model for the seismic PSA too, but with an assumption that the availability of the open loop secondary side heat removal in itself cannot prevent core damage in the long term.
Development of the Generic Event Tree
The generic event tree was built up for a range of plant transients (with combinations of multiple transient initiating failures) in the final step of event tree modeling. The approach taken to developing the generic event tree was that (1) transient initiating failures appeared as event tree headers making possible their combination, and (2) one generic event tree header was introduced as the last header combining all the core damage event sequences from all the single transient initiating failures.
The development of the generic event tree was not a mechanistic application of the modeling approach. If the generic event tree would have been built up mechanistically then the number of the event sequences would be 2N+1,
where N is the number of potential transient initiating failures (19 in our case) and there is one additional (last) header of mitigating systems mentioned above. This would have resulted in more than one million event sequences. There were, however, some possibilities to reduce the number of event sequences. The most important one was that approach of leaving out unnecessary or meaningless combinations of events (transient initiating failures). Those factors that enabled simplifications are related to the order of transient initiating failures as event tree headers in the event tree. To illustrate this the example of the transient initiating failure loss of all 6 kV busbars is taken (event IDs are taken from the Paks seismic PSA study):
• The transient initiating failure loss of all 6 kV busbars (K1) leads to the trip of all RCPs (F5), MFW pumps (G2) and make-up water pumps (L3), thus their simultaneous occurrence should not be taken into account as long as K1 occurs. Consequently, the event K1 comes first in the event tree, and the tree does not branches off for events F5, G2 and L3 in those sequences where the occurrence of K1 is assumed (lower sequence by K1).
As a result of the simplifications the final version of the generic event tree had 577 event sequences. There are three types of event tree headers in the generic event tree. The first header of the event tree (Screen 1) constitutes the first type. This is not an explicitly specified transient initiating failure or mitigation function. The combination of events occurring in Screen 1 group is such that core damage and containment isolation failure occur with probability 1 given the Screen 1 event occurred. There is no need to model the effects of the Screen 1 event in fine details, it is included as one (the first) header in the generic event tree leading directly to core damage in the case of its failure. To describe this event, a single basic event is put into the first event tree header in the PSA model.
occurrence of multiple transient initiating failures is assumed. This was achieved by assigning the boundary condition set characterizing a given transient initiating failure to all the next first branch points on the lower branches by the given transient initiating failure.
The last event tree header constitutes the third type of headers. It combines the mitigation functions and systems. In principle, it is a large OR connection of all core damage event sequences of the event trees of all single transient initiating failures included. For that reason event trees of interest were converted into fault trees that is illustrated in Fig. 1. on the example of event tree L1. The failures caused by the different seismic groups were modeled in such a way that the seismic-induced failure of a piece of equipment was put in an OR connection with the independent failure of that. In order to be able to run the model with or without seismic failures they were built into the model using a specific boundary condition. By turning it on (to true) seismic failures are connected to the fault trees of the original PSA model, while in the opposite case the model is run without taking them into account.
EVENT TREE L1 Loss of Intermediate Cooling to RCPs
PPSA1_L SEISMIC_PSA
@PPSA1_L1-1 L1 Loss of Intermediate Cooling to RCP Likely IE L1
L1 Initiating Event
MIT L1 L1 Mitigation
@PPSA1_L120 L1_TRUE IE L1 True
L1_CD_SEQ_3
SHR_EQ Failure of Secondary Side Heat Removal - Seismic or Other
L1_CD_SEQ_4
SHR_EQ Failure of Secondary Side Heat Removal - Seismic or Other
L1_CD_SEQ_5
MCP_OUT_(6/6) Automatic or Manual Outage of MCPs (6/6)
MIT E3 E3 Mitigation
ECCS_HETL No ECCS Heat Exchanger Tube Leakage
P_B&F Primary Circuit Bleed & Feed
MCP_OUT_6
@PPSA1_L1-2 @PPSA1_L1-3
L1 Loss of Intermediate Cooling to RCPs
SEISMIC Seismic Initiating Event
L1 Loss of RCP Intermediate Cooling Circuit Induced by Earthquake
SEISMIC Seismic Initiating Event
Fig.1 Example of event tree – fault tree conversion
Version 1.20 of the Risk Spectrum PSA Professional for Windows was used as a basic tool for model development. Basic events were built into the model that describe the occurrence of a seismic-induced failure (group). The number of newly built in basic events corresponds to the number of seismic-induced failures (groups). There had to be different basic events for the same seismic-induced failure in different ranges of earthquakes defined by the level of peak ground acceleration. This is due to the fact that the probability of seismic-induced failure increases with increasing peak ground acceleration. This means that the number of the basic events was finally N times as many as the number of the seismic-induced failures identified, where N is the number of the ranges defined for the purposes of the seismic PSA (N=7 in our case).
Modeling Containment Performance
inclusion of containment functions in the generic event tree can be straightforward based on the success criteria definitions for the plant damage states being developed in a separate (level 2 PSA) analysis effort for Paks.
Since success criteria definitions were not yet developed during the seismic PSA, the effects of seismic failures on containment systems were evaluated by the Attribute function of the Risk Spectrum code. Seismic failures (groups) that cause a failure of the containment functions are assigned a specific attribute. After performing calculations for the core damage risk due to seismic initiating events the contribution of the events bearing the above attributes could be explicitly identified.
QUANTIFICATION OF SEISMIC MODELS
Seven acceleration ranges were selected to define the seismic initiating events for the PSA model quantification process. The lower bound of the first acceleration range is 0.07g. This value corresponds to the lowest seismic HCLPF capacity for all structures and equipment, based on the plant-specific fragility analyses. The upper bound of the seventh acceleration range is 1.0g. This value corresponds to the highest acceleration that was evaluated in the seismic hazard analysis.
The seven ranges are designated as initiating events SEIS1 through SEIS7. The bounds of the acceleration range for each initiating event were selected to ensure that the seismic hazard curves remain approximately linear throughout the range. The intervals are progressively larger to account for the fact that the frequencies change more slowly at higher accelerations. Table 2. lists each seismic initiating event, its associated acceleration range, and the corresponding mean frequency for that range.
Table 2. Seismic initiating event acceleration ranges
Initiating Event Acceleration Range (g) Mean Frequency (event per year)
SEIS1 0.07 - 0.10 2.69E-03
SEIS2 0.10 - 0.15 1.08E-03
SEIS3 0.15 - 0.22 3.16E-04
SEIS4 0.22 - 0.32 8.71E-05
SEIS5 0.32 - 0.48 2.35E-05
SEIS6 0.48 - 0.70 4.76E-06
SEIS7 0.70 - 1.0 8.99E-07
Quantification Codes
The baseline seismic PSA model was developed and extended using the Risk Spectrum PSA Professional computer code. It is not able, however, to convolute seismic hazard and fragility curves, thus to calculate seismic failure fractions. Due to this problem with Risk Spectrum it cannot be used to perform uncertainty calculations for the seismic PSA either. For this purpose a computer code was developed at VEIKI. This code calculates the failure fraction point estimates (mean values) that are put then into the Risk Spectrum database manually. This allows point estimate and importance calculations to be performed by Risk Spectrum. In addition to calculating failure fraction point estimates, the VEIKI code is capable of calculating uncertainties in the failure fractions using Monte Carlo simulation, and also point estimates and uncertainties on minimal cutset, thus on core damage frequency level. The minimal cutsets generated by the Risk Spectrum are used as input for the latter. Both the point estimate and the Monte Carlo options use a piecewise integration algorithm that discretizes the range of acceleration values defined for a given initiating event into a pre-defined number of subintervals, and computes a representative failure fraction/cutset frequency for the range by weighting the failure fractions of each of the subintervals by the fraction of the initiating event frequency corresponding to the subinterval. It is noted that this code has been benchmarked with a QA qualified software RISKMAN. The results of the benchmark showed good agreement so it was concluded that the calculation methodology used in the VEIKI code was very reasonable.
Quantification Process
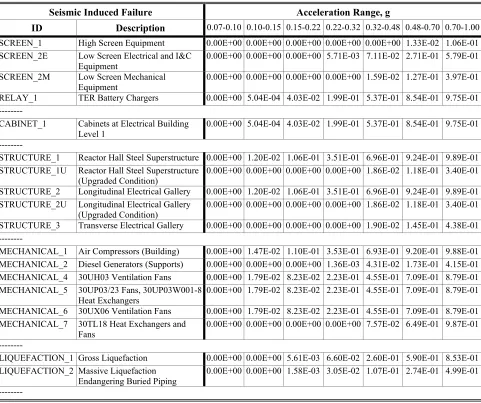
Table 3. Extracts from the results of the point estimate failure fraction calculations
Seismic Induced Failure Acceleration Range, g
ID Description 0.07-0.10 0.10-0.15 0.15-0.22 0.22-0.32 0.32-0.48 0.48-0.70 0.70-1.00
SCREEN_1 High Screen Equipment 0.00E+00 0.00E+00 0.00E+00 0.00E+00 0.00E+00 1.33E-02 1.06E-01 SCREEN_2E Low Screen Electrical and I&C
Equipment
0.00E+00 0.00E+00 0.00E+00 5.71E-03 7.11E-02 2.71E-01 5.79E-01
SCREEN_2M Low Screen Mechanical
Equipment 0.00E+00 0.00E+00 0.00E+00 0.00E+00 1.59E-02 1.27E-01 3.97E-01 RELAY_1 TER Battery Chargers 0.00E+00 5.04E-04 4.03E-02 1.99E-01 5.37E-01 8.54E-01 9.75E-01 ---
CABINET_1 Cabinets at Electrical Building
Level 1 0.00E+00 5.04E-04 4.03E-02 1.99E-01 5.37E-01 8.54E-01 9.75E-01
---
STRUCTURE_1 Reactor Hall Steel Superstructure 0.00E+00 1.20E-02 1.06E-01 3.51E-01 6.96E-01 9.24E-01 9.89E-01 STRUCTURE_1U Reactor Hall Steel Superstructure
(Upgraded Condition)
0.00E+00 0.00E+00 0.00E+00 0.00E+00 1.86E-02 1.18E-01 3.40E-01
STRUCTURE_2 Longitudinal Electrical Gallery 0.00E+00 1.20E-02 1.06E-01 3.51E-01 6.96E-01 9.24E-01 9.89E-01 STRUCTURE_2U Longitudinal Electrical Gallery
(Upgraded Condition) 0.00E+00 0.00E+00 0.00E+00 0.00E+00 1.86E-02 1.18E-01 3.40E-01 STRUCTURE_3 Transverse Electrical Gallery 0.00E+00 0.00E+00 0.00E+00 0.00E+00 1.90E-02 1.45E-01 4.38E-01 ---
MECHANICAL_1 Air Compressors (Building) 0.00E+00 1.47E-02 1.10E-01 3.53E-01 6.93E-01 9.20E-01 9.88E-01 MECHANICAL_2 Diesel Generators (Supports) 0.00E+00 0.00E+00 0.00E+00 1.36E-03 4.31E-02 1.73E-01 4.15E-01 MECHANICAL_4 30UH03 Ventilation Fans 0.00E+00 1.79E-02 8.23E-02 2.23E-01 4.55E-01 7.09E-01 8.79E-01 MECHANICAL_5 30UP03/23 Fans, 30UP03W001-8 0.00E+00 1.79E-02 8.23E-02 2.23E-01 4.55E-01 7.09E-01 8.79E-01
MECHANICAL_6 30UX06 Ventilation Fans 0.00E+00 1.79E-02 8.23E-02 2.23E-01 4.55E-01 7.09E-01 8.79E-01 MECHANICAL_7 30TL18 Heat Exchangers and
Fans
0.00E+00 0.00E+00 0.00E+00 0.00E+00 7.57E-02 6.49E-01 9.87E-01
---
LIQUEFACTION_1 Gross Liquefaction 0.00E+00 0.00E+00 5.61E-03 6.60E-02 2.60E-01 5.90E-01 8.53E-01 LIQUEFACTION_2 Massive Liquefaction
Endangering Buried Piping 0.00E+00 0.00E+00 1.58E-03 3.05E-02 1.07E-01 2.74E-01 4.99E-01 ---
Heat Exchangers
These failure fractions as well as the frequencies of the seismic initiating event were built into the Risk Spectrum based seismic PSA model, and the point estimate core damage frequencies were calculated for each range separately. In principle, the core damage frequency could be calculated for all the acceleration ranges together, but these calculations required a new type of calculation as compared to the internal initiator PSA: in many cases, in particular, for high acceleration ranges, the conditional core damage probability was calculated (given the seismic initiator occurred) instead of the core damage frequency. The reason for that was that the frequency calculation gives incorrect results for high failure probabilities that frequently appear in the high acceleration ranges. In those ranges the conditional core damage probability is close to unity. It is obvious, that the conditional core damage probability cannot be calculated for all the ranges together, because the initiating event frequency is changing from range to range. Final results for core damage frequency were derived by multiplying the conditional core damage probabilities for the ranges with the corresponding frequency of the seismic initiator. In addition to calculating the core damage frequency and generating minimal cutsets for ranges, importance calculations were also performed by Risk Spectrum.
It should be emphasized here that the importance measures calculated by Risk Spectrum are useful for general information and for high-level engineering insights. However, they may not provide an accurate estimate of the total contribution from seismic-induced failure due to the appearance of high probabilities. For example, the real risk decrease factor may be much less when the rare event approximation cannot be considered acceptable.
Uncertainty calculations were performed using the VEIKI convolution code. It is noted that this code was used for generating samples and the main uncertainty parameters, i.e. mean, median and the 5th and 95th percentiles. Detailed statistical evaluation of the data was performed by using the computer code STATISTICA. Samples were generated for the different ranges separately due to the same reason described for the core damage frequency calculation. Random samples for the ranges were then added up to get samples for the total core damage frequency.
CONCLUSIONS
As a last stage of a comprehensive program that has been performed for the four VVER-440, type 213 reactors of the Paks NPP in Hungary to re-evaluate and improve the resistance of the plant against earthquakes a probabilistic safety assessment for seismic events has been carried out with the objectives to (1) determine the seismic-induced core damage frequency for NPP Paks, (2) identify plant vulnerabilities and (3) provide feedback to further improvements, if necessary. The study covered plant operation at full power and a given unit (unit 3) was selected as a reference unit for the analysis. In addition to the risk of core damage, containment performance was also evaluated to enable future extension to a level 2 PSA.
The fundamental parts of the analysis process were identical to the traditional steps of a seismic PSA including assessment of seismic hazard, development of seismic fragilities for safety related structures and components, development of accident sequence and system models for seismic-induced plant transients, and computation of core damage frequency. Each analysis step was a considerable challenge due to the fact that hardly any detailed seismic PSA has ever been performed for a VVER plant.
For the purpose of developing accident sequence and system models for seismic-induced plant transients the identified seismic failures of safety related structures and components were grouped. Screening groups (high and low), liquefaction groups and a number of structural, mechanical, and I&C and electrical groups were defined. A detailed generic event tree was constructed to describe the seismic-induced accident sequences. Use was made of the available PSA model for internal initiating events to the greatest possible extent. In addition to the incorporation of seismic failure events, definition and quantification of post-initiator human errors were reconsidered to take an account of mental and physiological factors associated with a seismic event.