Soil-Structure Interaction Analysis of RBMK-1000 M W Type NPP for Seismic
Event
Marin J.Jordanov ~, Krasimir T.Karparov ~, Alejandro P.Asfura 2 1) EQE Bulgaria, Sofia, Bulgaria
2) EQE International, Oakland, CA, USA
ABSTRACT
This paper presents the results of study of the structural response of Leningradskaya Nuclear Power Plant (LNPP) RBMK-1000 MW Reactor Building to seismic excitation motion. A 3-D detailed structural model was developed for the seismic response analyses of the building. The structure was assumed surface founded at the basemat level. Seismic response soil-structure interaction (SSI) analyses were carried out considering shear wave propagation pattern for the input motion. The in-structure time histories and response spectra were generated in referenced locations. Conclusions are drawn for the reliability of the structural response evaluation considering the soil-structure interaction effects.
I N T R O D U C T I O N
The scope of the paper is to present the results obtained under a project as part of the Coordinated Research Program (CPR) carried out by International Atomic Energy Agency (IAEA) on Safety of RBMK Type Nuclear Power Plants (NPP) in Relation to External Events. The objective of the project carried out by EQE is to assess the structural behavior and safety capacity of RBMK-1000 MW Main Building Complex under critical combination of loads including seismic event. The nuclear power plant considered for this study was LNPP located near St. Petersburg, Russian Federation.
The Soviet standard design RBMK-1000MW units installed in LNPP were originally designed for a Safe Shutdown Earthquake (SSE) with peak ground acceleration (PGA) of 0.1g. As the Review Level Earthquake (RLE) spectrum is not available, a spectrum specified in accordance with the NUREG/CR-0098 spectrum and anchored to PGA=0.1 g is used in the study. This representative spectrum is intentionally chosen for seismic evaluation of safety related equipment in referenced plan by comparison of generated floor response spectra with the Russian seismic design requirements.
Description of the RBMK-1000 ~ Reactor Building
The Reactor Building "A" (RB) in LNPP is arranged between axes 13-28 and axes A-M in the general layout of the twin RBMK-1000 MW units. There are 5cm gaps between axes M and H and along axis 28, which go through the foundation slabs and separate the Reactor Building from Electrical Building 1 and Deaerator Building. This type of separation allows performing a seismic response analysis of the Reactor Building without considering an interaction with the neighboring buildings. General layout and principal cross-sections of the RB are presented on Figures 1-3.
RB is a monolithic reinforced concrete structure with different thickness of walls and slabs up to the Elevation 36.92m,. Vertical carrying elements along axes 13 and 28 from Elevation-0.15m to Elevation-30.00m are pre-cast reinforced concrete columns. Floor structures at Elevations 18.30m, 23.70m and 30.00m between axes 13-15, and axes 26- 28 consist of pre-cast girders, placed over the cantilevers of pre-cast columns and monolithic reinforced concrete walls, and roof panels, fixed to the girders by welds and reinforced concrete topping. All outside walls from Elevation-0.15m to Elevation 55.20m are covered with reinforced concrete cladding panels except those along structural gaps.
Above Elevation 36.92m a steel frame structure is arranged. Frame columns have 2T cross-section with a depth of 1400mm. The columns are fixed in the massive reinforced concrete walls by heavy anchors. A truss with a height of 3400mm is mounted on the top of the columns. The truss-to-column connection is rigid. In longitudinal direction the forces are carried by vertical X-braces between axes E-K. Horizontal braces along the upper and lower truss chord stiffen the roof structure. Pre-cast reinforced panels are used for roofing.
A new so-called "confinement" is implemented around the steel structure. Steel cantilevers extend form the massive reinforced concrete walls near the main columns' base anchoring. Outside steel frames with perforated columns and 2T girders are placed over the cantilevers and roof panels. Similar outside frames are arranged along the both ends of the steel structure. New purlins are placed over the girders as well as new collectors outside the columns. Steel sheets 4ram thick ribbed with L75x6 profiles are mounted as a shielding of the second structure.
Five steel stacks 23m high with 2.0m diameter are constructed between axes M - H above Elevation 37.00m. Stacks are fixed to the end columns along axis M by a horizontal bracing at elevation 51.00m.
The RB structure is founded on a common foundation slab with an average depth of 1.5m, which increase up to 2.0m under the reactor. The foundation is 8.30m below the grade. The outside dimensions of the foundation slab are 67.60m by 60.70m.
SMiRT 16, Washington DC, August 2001 Paper # 1393
Analysis Steps
A substructure method of SSI analysis was applied to evaluate the seismic response of the Reactor Building using the CLASSI chain of programs [ 1]. The substructure approach separates the SSI problem into a series of simpler problems, solves each independently, and superimposes the results. The building foundation is assumed to be on the top of the soil deposit and to be rigid. Full bonding is assumed between the foundation and the soil. The nonlinear soil behavior was considered by development of high strain soil properties under seismic excitation. Impedance and scattering functions were obtained using a detailed foundation model. Frequency independent equivalent soil springs and dampers were developed and applied to the basement of the model for the time domain seismic response analysis. In-structure response spectra were finally generated at referenced locations for seismic evaluation of equipment and commodities.
R E A C T O R BUILDING M O D E L
A 3-D detailed model was developed for the RB structure. The model of RB structure is based on the available input data distributed officially by IAEA between participants in the Coordinated Research Program. Drawings of the concrete structure and steel superstructure as well as data for the new "confinement", and the equipment were found and used.
Mesh of the model follows the main structural axes. The size of mesh is set to 3 x 3m. The mesh in vertical direction is consistent with the arrangement of the slabs. The reinforced concrete walls and slabs are modeled with SHELL elements with 6 DOF per node. Cladding wall and roof panels are modeled with membrane elements with 3 DOF per node. The SHELL elements modeling the walls are located in their middle surface. The SHELL elements for the slabs are located at the upper edges of the slabs. General view of the model and typical cross-section are presented on Figures 4-7.
The steel superstructure is modeled with BEAM elements with 6 DOF per node, Figure 8. Geometric characteristics of the members are developed according to the specifications in the drawings and relevant Russian standards. Wall panels are connected with the primary structure by short, rigid beam elements. The attachment of roof panels to the primary roof masses is modeled in the same way. In modeling of "confinement" a special attention is paid to the detailed modeling of the anchorages, which helps in estimation of resulting reaction forces, Figure 9. The steel sheeting is modeled as masses only.
Masses of the equipment and structural elements with low stiffness are lumped in the corresponding mass centers. Mass of the reactor is distributed over the height to the surrounding structural walls according to the scheme provided by the plant.
Model consists of 4250 nodes, 2634 BEAM elements and 3726 SHELL elements. The total mass of the structure including the equipment is assessed to 111370 tons.
Two models were investigated- fixed base model and soil supported model (with springs and dampers). Dynamic characteristics of the models were extracted. Tables 1 and 2 present the dynamic modal characteristics of both models.
FREE FIELD SEISMIC M O T I O N
Free field seismic motion was developed as part of the CRP [2]. A spectrum specified in accordance with the NUREG/CR-0098 spectrum and anchored to PGA=0.1g was used. Three independent sets of time histories were generated and checked for correlation. The time histories in the selected set are shown to be uncorrelated. The selected time histories have response spectra overlapping the target spectra. The vertical component spectrum is scaled from horizontal spectrum with 2/3. The duration of time histories is 20sec with a time step of 0.01sec. Figures 10 and 11 show the plots of the free field acceleration time histories and the corresponding response spectra.
D E V E L O P M E N T OF SSI P A R A M E T E R S
The SSI parameters refer to the foundation input motion and impedance functions that characterize the kinematic and inertial behavior of the soil-foundation system. The impedance and scattering functions are calculated using the best- estimated soil properties of the LNPP soil deposit. Frequency dependent soil characteristics were developed using CLASSI [ 1 ]. For structure seismic response analyses the soil-structure interaction was modeled with equivalent frequency independent springs and dampers, evaluated by impedance functions.
Low-Strain Soil Properties
Deconvolved Seismic Motion
The foundation level input motion was developed by deconvolution of the free surface ground motion. A cut-off frequency of 25.0Hz and a material damping of 0.5% were chosen for the deconvolution analysis. Figure 11 presents a comparison of the response spectra of the free surface ground motion and foundation-level motion.
Impedance and Scattering Functions
A foundation model was developed for the RB basemat with outer dimension 67.60m by 60.70m and slab thickness of 1.50m, Figure 12. Due to the relatively soft backfill material, the embedment was neglected and a surface-founded foundation at the elevation of the contact surface was assumed for the impedance and scattering function calculations. 36 frequencies, which cover the frequency domain of interest (0.05-40.0Hz), were used in the CLASSI runs. The impedance functions are presented in Figures 13-16. All impedance and scattering functions were calculated for the Foundation Reference Point (FRP).
Frequency independent equivalent soil springs and dampers for the best estimate soil were developed based on the impedance functions. SSI seismic response analyses in time domain were performed for simplification of the calculations and for direct generation of the structural response forces, moments, acceleration time histories and response spectra. Program SAP2000 Nonlinear was used in these analyses [4].
SEISMIC RESPONSE ANALYSES RESULTS
The SSI seismic response analyses of the RBMK-1000 MW Reactor Building were performed with both structural models to obtain in-structure acceleration time histories at few referenced locations. 4% structural modal damping was used in the calculations. The output acceleration time histories were calculated with 20sec duration.
Seismic response spectra were generated from the acceleration response time histories using 2%, 5%, 7%, and 10% damping. On Figures 17 and 18 are presented the referenced locations in which the in-structure response spectra are generated. Response spectra for the fixed based model for Elevations -8.30, 19.20 and 36.92 are presented on Figures 19-21. On Figures 22-24 are presented the response spectra in same locations for the soil supported model. These response spectra are broadened 15% according to NRC RG 1.122 [5]. The comparison between the response spectra for the fixed base and soil supported models shows that
• At Elevation -8.30m the soil supported model gives higher responses due to the excitation of the masses of the
structure and equipment located in the bottom of the structure. Amplification in vertical direction is more significant.
• At Elevation 19.20m the fixed base model gives higher responses due to the higher amplification in horizontal
directions. Damping of the motions in the soil supported model results in shift of frequencies toward lower frequency range and reduction of the response accelerations.
• At Elevation 36.92m the fixed base model gives 2 times higher responses then soil supported model. The
spectral values of vertical component spectra are almost equal, but frequency ranges are different.
CONCLUSIONS
The seismic SSI response analyses of the Leningradskaya NPP RBMK-1000 MW Reactor Building showed that the SSI effects are significant and should be considered for realistic assessment of seismic behavior of this type of structures.
The floor response spectra generated with the soil supported model can be used for seismic evaluation of the equipment and commodities in the Reactor Building.
Seismic forces in the main structural elements generated by soil supported model should be used for further evaluations and for structural strengthening measures where applicable.
REFERENCES
1. Wong, H. L. and Luco J. E., Soil-Structure Interaction: A Linear Continuum Mechanics Approach (CLASSI), CE 79-03, University of Southern California, Los Angeles, CA, 1980.
2. Acceleration Time Histories for Seismic Analysis of Leningrad NPP, EQE International report prepared for IAEA CRP
on Safety of RBMK Type NPP's in Relation to External Events, St. Petersburg, Russia, June 26-30, 2000
3. Data on Structural and Equipment Design Provided by LNPP and VNIPIET, Working Material of IAEA CRP on Safety
of RBMK Type NPP's in Relation to External Events, St. Petersburg, Russia, June 26-30, 2000
4. SAP2000 Nonlinear Version 7.40, Three Dimensional Static and Dynamic Finite Element Analysis and Design of
Structures, CSI, Berkeley, California
T a b l e 1. N a t u r a l F r e q u e n c i e s a n d M a s s P a r t i c i p a t i o n o f F i x e d B a s e M o d e l
Mass participation coefficient Cumulative Mode Freq Damping [%]
[Hz] ratio
X Y Z X Y Z
1 1.298 0.040 0.000 0.292 0.000 0.000 0.292 0.000
9 3.438 0.040 2.965 0.002 0.000 5.264 0.400 0.000
27 4.430 0.040 2.689 0.002 0.000 9.521 5.448 0.477
50 5.862 0.040 0.110 5.638 0.002 11.748 11.863 0.545
51 5.968 0.040 6.240 0.502 0.000 17.988 12.365 0.545
53 6.084 0.040 0.052 40.863 0.006 18.041 53.228 0.554
55 6.380 0.040 0.007 4.172 0.002 18.054 57.908 0.559
57 6.612 0.040 20.397 0.213 0.000 39.383 58.881 0.560
58 6.730 0.040 0.319 8.312 0.002 39.702 67.193 0.562
60 7.158 0.040 3.078 0.358 0.002 43.224 67.637 0.564
61 7.214 0.040 3.918 0.169 0.001 47.142 67.805 0.565
74 10.128 0.040 5.917 0.011 0.001 61.086 71.341 1.914
75 10.422 0.040 0.001 7.151 0.080 61.087 78.492 1.994
77 11.166 0.040 0.045 3.255 0.223 63.395 81.788 2.243
80 12.778 0.040 0.003 5.090 2.160 63.424 88.429 7.763
81 13.374 0.040 4.131 0.006 0.047 67.555 88.435 7.810
83 14.362 0.040 0.096 0.122 7.983 67.733 89.806 17.220
84 14.644 0.040 10.290 0.006 0.039 78.022 89.812 17.260
85 15.719 0.040 0.001 0.058 42.545 78.024 89.870 59.805
87 18.812 0.040 0.288 0.091 5.710 78.398 90.914 65.549
88 19.015 0.040 5.312 0.001 0.433 83.710 90.915 65.982
89 21.651 0.040 6.183 0.050 0.021 89.893 90.965 66.003
91 23.245 0.040 0.007 0.096 12.193 90.021 93.469 78.311
93 29.930 0.040 5.105 0.011 0.146 95.162 95.872 78.578
94 31.379 0.040 0.103 0.011 5.730 95.265 95.883 84.309
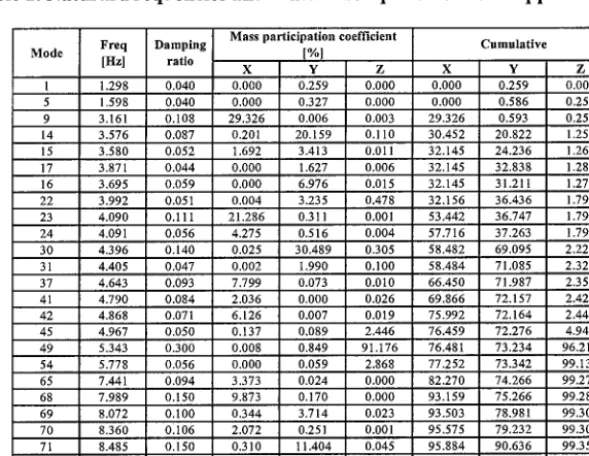
T a b l e 2. N a t u r a l F r e q u e n c i e s a n d M a s s P a r t i c i p a t i o n of Soil S u p p o r t e d M o d e l
Mass pa~icipation coefficient Cumulative Mode Freq Damping [%]
[Hz] ratio
X Y Z X Y Z
1 1.298 0.040 0.000 0.259 0.000 0.000 0.259 0.000
5 1.598 0.040 0.000 0.327 0.000 0.000 0.586 0.252
9 3.161 0.108 29.326 0.006 0.003 29.326 0.593 0.255
14 3.576 0.087 0.201 20.159 0.110 30.452 20.822 1.253
15 3.580 0.052 1.692 3.413 0.011 32.145 24.236 1.264
17 3.871 0.044 0.000 1.627 0.006 32.145 32.838 1.285
16 3.695 0.059 0.000 6.976 0.015 32.145 31.211 1.279
22 3.992 0.051 0.004 3.235 0.478 32.156 36.436 1.790
23 4.090 0.111 21.286 0.311 0.001 53.442 36.747 1.790
24 4.091 0.056 4.275 0.516 0.004 57.716 37.263 1.795
30 4.396 0.140 0.025 30.489 0.305 58.482 69.095 2.225
31 4.405 0.047 0.002 1.990 0.100 58.484 71.085 2.325
37 4.643 0.093 7.799 0.073 0.010 66.450 71.987 2.351
41 4.790 0.084 2.036 0.000 0.026 69.866 72.157 2.423
42 4.868 0.071 6.126 0.007 0.019 75.992 72.164 2.442
45 4.967 0.050 0.137 0.089 2.446 76.459 72.276 4.943
49 5.343 0.300 0.008 0.849 91.176 76.481 73.234 96.213
54 5.778 0.056 0.000 0.059 2.868 77.252 73.342 99.139
65 7.441 0.094 3.373 0.024 0.000 82.270 74.266 99.273
68 7.989 0.150 9.873 0.170 0.000 93.159 75.266 99.284
69 8.072 0.100 0.344 3.714 0.023 93.503 78.981 99.307
70 8.360 01106 2.072 0.251 0.001 95.575 79.232 99.308
71 8.485 0.150 0.310 11.404 0.045 95.884 90.636 99.354
72 8.567 0.125 0.328 3.365 0.037 96.213 94.001 99.390
95 31.761 0.150 0.000 0.186 0.000 99.901 99.964 99.946
T a b l e 3. L o w S t r a i n Soil P r o p e r t i e s P r o f i l e o f L N P P site
No. 1 2 3 5 6
E H S
From-To [ml
0 . 0 - 2 . 0
2 . 0 - 6 . 0
6 . 0 - 1 0 . 0
1 0 . 0 - 3 0 . 0
3 0 . 0 - 6 0 . 0
6 0 . 0 - 1 8 0 . 0
Depth [m]
2 . 0
4 . 0
4 . 0
2 0 . 0
3 0 . 0
1 2 0 . 0
1 8 0
Density [t/m^3]
1.70
1.80 1.90
2 . 2 0
2 . 3 0
2 . 4 0
3 . 0 0
3 . 0 0
Sh.Velocity [m/s]
1 8 0
2 5 0
3 5 0
3 5 0
4 5 0
6 5 0
3 4 0 0
> 3 4 0 0
P.Velocity [m/s]
4 0 0
1 1 0 0
1 5 0 0
2 0 0 0
2 2 0 0
2 5 0 0
5 8 0 0
> 5 8 0 0
Poisson's
0 . 3 7 3
0 . 4 7 3
0 . 4 7 1
0 . 4 8 4
0 . 4 7 8
0 . 4 6 4
0 . 2 3 8
G-modulus
[ k P a ]
5 5 0 8 0
1 1 2 5 0 0
2 3 2 7 5 0
2 6 9 5 0 0
4 6 5 7 5 0
1 0 1 4 0 0 0
LAYOUT OF ELEVATION 2 . 7 0 0 . 7 . 2 0 0
%°o%°oo%0°? .... ? .... % o # .... %oo? .... ? .... ~o~?
I I I I I I I I I I I L I
P-~ F-i
DI
I'-'
- ~ - - ~ i ~ - - ~
II
;oooo; ,~ooo $ ~,ooo
i
,@,-@
,-@
,-@
,-@
,--@
.-@
-.@
-G
-@
Fig.1. Reactor Building- Layout
SECTION 2 - 2
_
+29.700
+19.200
E
~ 0 0 ~ 6 0 0 0 L 6 0 0 0 L 6 0 o 0 ~ 6 o o o ~ 6 0 0 o ~ 6 o o o L 6 0 0 0 L 6 0 0 0 L 6 0 0 0 ~ 6 0 o 0
6)@ ® © ® ® ® ® @ @ ® ®
Fig.3. Reactor Building- Elevation 2-2
• ....
Fig.5. Reactor Building M o d e l - Section 1-1
SECTION 1 - 1
+ . ~ 5 . 2 0 0
+ 4 7 . 2 C O
*..t) l I o n
+.3e.~2o
+v~o.oo.o
+.,,?.e~
.,2 . ~
-o1~o _;.aoo -,v,
Fig.2. Reactor Building- Elevation 1-1
Fig.4. Reactor Building 3-D Model
Fig.7 Reactor Building Model- Basement
l . ~ ._.---~--4 ... i ... :_%~--li--7~-~-=---:~:!~T --_--7, i H~:-~
%!-~ ...
,'\
%~/i\ | ~%-.::k--- 4
){
N\ t
i
i
i /I,'
, , I~ i ' ' 7~ ~
Fig.9. Superstructure Model- Detail
x 161 X-Direction Component 3 0
~,o fit /i"['i4 ,.;lq~ i
5 ---i~ -~ . . . . ; fi-it i ... H i ii
0 161 --=:.:-- 1 . . . =N_ill __ LJi ,iL~ Frequency (Hz) X 161 Z-Direc~on Component
. . . i ~ , -- - r - N ~ i l - - - T - - ~ m
~1o _N . . . l . . . L~il _i-J iii
~ ! !!iii i!i
x 161 Y-Direction Component
o
f, ilt tIIltl
~' i -i-!-kiil ... iliii~ ... ii
i i ilitl .i'd~, ~ i i
E 2 o i . . . . - d . : - k F k i q - ,-. '-'i-~k1~ . . . ,~ ~115 i i[ !ii f-~ ii\ i}
~,o
N
it~
![ii
IHJ
5 - - - i ' g i i i i !
_ L i '..__LU .... L j if_ jj o
10' ~o- ~ lO"
Frequency (Hz)
Legend:
FF Response Spectra
T/H Resp Spec LAY._3
Notes:
5% Spectral Damping Acceleration in g's
V~thin Site Motion 25 0 Hz Cut-off Freq
Fig.ll. Free Surface Response Spectra vs. Deconvolved Response Spectra
="b4
/i
,/(
\ ~ g~ ~ ~ -.--
i
',,[ i ! q. ... %
"\} ... £ i
"4 ' ' \k...i/
z i
4
k
Fig.8. Reactor Building Model- Superstructure
X-dir T i m e History
0.15 . . .
.o,1 T;;i;i; i
.... I _ . m $ ~ l l l l l ~ l l ~ l l l t l l ~ L__
.... ~]1~i,l!!/!,.~!Nil~,r._
-o,o5 l ' " I I t
-ol f
-015
0 5 10 15 20 25
Time ( s e c )
Y-dlr T i m e History
0.15 . . .
.... I.,I . . . .
-0.05
5 10 15 20 25
Time ( s e c )
Z-dir T i m e History
0 0 8 ] . . .
0.06
0.04 ,I . J . I , I . I 0.02 I Iilit, I.IIIIL,K,Ill II .,.i
L ~ lllllJIilllllll~lll~l~F, I IJJL . . . . o
I" N~IliiI~III' l'rlHl~lll ~llP r "--
.... j .l'~f" ',! 11.!. ,r"
-o 0 4 [
-0.06 .o 08
0 5 'to 15 20 25
Time (see)
Fig.10. Free Field Seismic Time Histories
X 102
i;24/¸ !
[ I
-1.0 -.5 .0 .5 1 0
X 102
X 1010 Stiffness Coefficient K( 1,1) X 10 9 Damping Coefficient C( 1,1) 1.0
£
I \ I \ l ; l ' \\,, i \ I ~ I \
i t i ~ i k .
t! t i t i\
",~ i t , l \
V
. - , \ , ;\ ,~ ,\ ...
/ " - - \ J ,~.~vJ \ ... / . . .
-1.0.0
X 101 1 Stiffness Coeffdent K( 3, 3) 8 i
.6 L
i
.4 i-
!
"~.,
- 2 -
/
/
i
/ I / /
/ \ i
;,/\/
/
-4 ,-
-.6 L
-.8.0 i
X 1010 Damping Coefficient C( 3, 3) .2
. j / /
lOO 2 0 0 3o.d -.2 o lOO 2 0 0 3o~
Frequency (Hz) Frequency (Hz) Frequency (Hz) Frequency (Hz)
Fig.13. Horizontal Impedance Function
X 1015 Stiffness Coefficient K( 4, 4) X 1014 Damping Coefficient C( 4, 4)
/
/
.1
"-\
.. /=\- .... _/_.__.\,vv_~/" ~ I \\,/--"
.0
-.I
-.2 0 10.0 20.0 30.0
Frequency (Hz)
- 6 o lO.O 20 d 3 o ~
Frequency (Hz)
Fig.15. Rotational Impedance Function
Z
~ o:~o/~_, ,_:~mJ
il ...
li L..'i
,-°
~
lioL;,211
~ . _
Fig.17. Referenced Locations of Response Spectra Generation- Elevation
Fig.14. Vertical Impedance Function
X 101 4 Stiffness Coefficient K( 6, 6) 1.0 ,
M
'l i\
h , ! \ / ,,
i \ , \ , ~ i \ /\ ,
, \ I V t i i i\ ~\
~# ' I i !,
;I 1 I ~ I \
v
t / ! i \.0 ! ! ~! \
t F-T,r-7,
tl I / \
,'ti
t/-~r t!
V
i
-1.0.0 10.0 20.(~ 30.0
X 1013 Damping Coeffident C( 6, 6) .8
-.8.0 10 0 20 0 30.()
Frequency (Hz) Frequency (Hz)
Fig.16. Rotational Impedance Function
3398 2265 1766
I IIIII1~ItlI 11
rllllrll~ ~ III
I1~~
~ III11 t W~
. . . . =o
IIII k~ III
, , o ,oo
II I L~II~
]111 Mtt]% II
III 1~~ I+
I1~11 ll~m~
rlillt [
. . . . oo. . . t . , i
Fig.19. Fixed Base Model FRS at E l . - 8 . 3 0
I]1 IJ]l J]llll
, , o ,oo . , . , , . . . + . c . . i
III II
J]
III
i
I
I
~ I
Illll Jl[JJ IIII
]11 L~
I
+ Ill
I i
I
Ill Ill[+
I,,I
o , , , o , o o
Fig.20. Fixed Base Model FRS at El. 19.20
+ I IJ II 11 I tl II I II I1~ I
IIIII It1~1 IIII
t~,~ I Itl!!l~ I
~1~ I
~111 TTIT . . . . o
II I IIII
I I
I I I
II II IIII II
I I~
I [! I
I ~
~;~1 ?'-
, , 0 ,+o
I IJ
II
III
II
IlL
L+ ~111
+ + I
, oo+
,+ ooM
,++ ooFig.21. Fixed Base Model FRS at El. 36.00
IN IJJ ~ l l l
Nil
II
l,ll II
++3 ~J'
. . . . o , o o
0 ,
IILHll II1~1[I IIIIII
IIIIIII ~tlll ill]ll
Illllll [llllll Illlll
IIIIIII ~
Llllll
Itlllll~~
IIIIII
~t + IIIIIIII Illlll
0 . . . . . O0
e,*qu*acy IX=l
Fig.22. Soil Supported Model FRS at E l . - 8 . 3 0
IIIII III
I,
, , 0 , 0 0
+ II
I Jll
L+l I
Illl F~tlII IIIII
. . . . oo
llr+~ rr ~ irll
.++
, , o , o o
Fig.23. Soil Supported Model FRS at El. 19.20
Spectrat A c c e l e r a t i o n in X D i r e c t i o n at . 3 6 6 0 0 m
" IIIIIII gTI IIIIII IIIIII IIIIIII III1~11111 IIIIII
L I IIIIJ itill IIIIII II III IIIIII
ll] IIIIIII IIIIII
IIIIIII l~l~Jllll IIIIII IIIIIII ~111~= IIIIII IIIII [l~l IIIlll ~ITI~ IIIIII IIIIIII I1~1 IIIlll~ IIIIII IIIII1~ I I IIIIII ~T 1-1111111
I I Illlill Illlll
~ , , , o , 0 o
I I I I I I I I I I I I I I I I I I I I I
IIIII IIIIII IIIII IIIII IIIIII IIIIIII Illll IIIII J WIIIII lllllll iiiii ~111111
iiiii i iltlllll iiillll
IIlll ~A~lllll IIlll IIlll [~lll []lllll Illll V#+l~l I llllllll Illl[~ I I ~ l l l l l ++Prl II IJIII I Illllll!
, , o , o o