Division IX (include assigned division number from I to X)
STRESS IN PRESTRESSING STRANDS
AT FLEXURAL FAILURE OF A PSC MEMBER
Jae-Hyun Park1, Jun-Long An2, and Jae-Yeol Cho3
1
Ph.D. Course Student, Civil and Environmental Engineering, Seoul National University, Korea
2
Master Course Student, Civil and Environmental Engineering, Seoul National University, Korea
3
Professor, Civil and Environmental Engineering, Seoul National University, Korea
ABSTRACT
The PS strand which has a tensile strength of 1,860 MPa was commercialized in the 1980s, and the tensile strength of strand had not been increased for about the past 30 years. Recently, 2,160 MPa and 2,400 MPa high-strength PS strands were developed by Korea government in 2008 and 2011, respectively. Also, net tensile strain concept has been introduced in recent version of ACI 318. However, simple equations for designers to predict the stress in PS strands at flexural strength proposed at existing design codes such as ACI 318 and CSA A23.3 do not reflect the influence of these trends. This study examined the applicability of high-strength PS strands to existing design equations of stresses in PS strands at flexural strength proposed in ACI 318-14 and CSA A23.3-14. The results show that the existing equations over-estimate the stresses for flanged sections and high-strength PS strands. With the based on the results, modified equation was proposed.
INTRODUCTION
Recently, high-strength PS strands were developed, which have more increased tensile strength than that of existing PS strand. The 1,860 MPa PS strand was commercialized in the early 1980s, and there has been no increase in tensile strength for about the past 30 years. In Korea, 2,160 MPa high-strength PS strand was developed in 2008, and 2,400 MPa high-high-strength PS strand was developed in 2011 by Super Long Span Bridge R&D center. Use of high-strength PS strands reduces PS strand area and the number of anchorage, and it improves economics and workability. In case of a bridge, extending span range is possible and it makes more slender bridge. So the necessity of introduction of high-strength PS strands in PSC structures is increasing.
To apply the newly developed 2,160 MPa and 2,400 MPa high-strength PS strands in practice, standardization of the material, development of new anchorage system suitable for high-strength PS strands, and evaluating applicability of the design standards for high-strength PS strands are needed. As results of the effort, 2,160 MPa PS strand (SWPC7CL) and 2,400 MPa PS strand (SWPC7DL) were added in the KS D 7002 revised in 2011. Also, new anchorage systems for high-strength PS strands were developed by Super Long Span Bridge R&D center. However, current local and global design standards such as KCI, ACI, and CSA do not reflect properties of the high-strength PS strands. So, an evaluation of the applicability of the design standards for high-strength PS strands and revision of the design equations for the PS strands are needed.
Another change was the introduction of net tensile strain concept in ACI 318. The concept of a reinforcement index in the design code changed into concept of net tensile strain, and there is no limitation for the PSC members. Thus, for the heavily reinforced flanged sections, the existing equation does not prevent the unconservative results.
and it needs a lot of time and money. Thus, theoretical evaluation is needed instead of test and it is able to evaluate lots of things that the test does not cover.
This study evaluated the applicability of the existing design strand stress equations proposed by design standards such as ACI 318 and CSA A23.3 for flanged section and high-strength PS strands. The study analysed flexural strength of members and strand stress at the flexural strength for high-strength PS strands comparing with the approximate equations for PS strand stress. Through the evaluation of the applicability of the equations, the study proposed a revised approximate equation for PS strand stress reflecting flanged section and high-strength PS strands.
EQUATIONS FOR PS STRAND STRESS
When getting a PS strand stress at the flexural strength, compatibility analysis-based sectional analysis is needed to get the accurate stress. However, in practice, sectional analysis is hardly used because it needs accurate material behaviour and iterative analysis. As an alternative to sectional analysis, approximate equations for PS strand stress at flexural strength is used in practice. Through the approximate equations, PS strand stress at flexural strength can be obtained using more simple calculations with less design parameters.
In Korea, an approximate equation for PS strand stress proposed in ACI 318 is used at KCI. In CSA A23.3, meanwhile, a different approximate equation for PS strand stress is proposed. Through the approximate equations for PS strand stress proposed in various design standards, understand factors affecting behaviour of PS strand at flexural strength.
ACI 318-14
In ACI 318-14, PS strand stress at flexural strength for fse > 0.5fpu is defined as following.
1
1 p pu y
ps pu p
c p c
f d f
f f
f d f
(1)
fpu is a tensile strength of PS strand, β1 is a coefficient related to the equivalent rectangular stress block, and ρp is prestressing reinforcement ratio. γp is a coefficient related to yield ratio and the value is 0.55 when fpy / fpu ≥ 0.80, 0.40 when fpy / fpu ≥ 0.85, and 0.28 when fpy / fpu ≥ 0.90. d is effective depth of member, and dp is a distance from extreme compression fiber to centroid of prestressing reinforcement. fy is yield strength of steel reinforcement, and fc’ is compressive strength of concrete. ρ is reinforcement ratio of tensile steel, and ρ’ is reinforcement ratio of compressive steel.
As factors affecting PS strand stress at flexural strength in the equation (1), effect of yield ratio is reflected in the equation as the coefficient γp. Also, effect of compressive strength of concrete is reflected in the equation as the coefficient β1, and effect of steel reinforcement is reflected as ρ and ρ’. However, effect of sectional shape is not reflected because a section which has flange like I-type section or T-type section is treated as rectangular section.
The equation (1) was first proposed by Mattock and adopted in ACI 318-83 in 1983. In the ACI 318-83 equation, the upper limit on the reinforcement index was defined as 0.36 β1. The equation shows unconservative results for flanged sections with heavily reinforced member. Mattock ignored these unconservativeness because upper limit on the reinforcement index can restrict the amount of PS strands. However, the concept of upper limit on the reinforcement index was changed into the concept of net tensile strain, though this equation is still used in ACI 318-14, the latest revision of ACI 318. Therefore, proper investigation is needed for the approximate equation in the current version of ACI 318.
In CSA A23.3-14, PS strand stress at flexural strength for fpe > 0.6fpy and c / dp ≤ 0.5 is defined as following.
1 ps pu p
p c
f f k
d
(2)
2 1.04 py p pu f k f
(3)
Distance from extreme compression fiber to neutral axis can be calculated as following.
p s s f pu ps sf p p p p p p pu p
c c c c c f c
c
d d d d d d f d
(4)
fpu is a tensile strength of PS strand, c is distance from extreme compression fiber to neutral axis, and dp is a distance from extreme compression fiber to centroid of prestressing reinforcement.. kp is a coefficient related to yield ratio, and it can be calculated with the equation (3). cp is a portion of c that indicates distance from extreme compression fiber to neutral axis except flange corresponding to tension force by prestressing reinforcement. cs is a portion of c that indicates distance from extreme compression fiber to neutral axis except flange corresponding to tension force by tensile steel reinforcement. cs’ is a portion of
c that indicates distance from extreme compression fiber to neutral axis except flange corresponding to compression force by compressive steel reinforcement. cf is a portion of c that indicates distance from extreme compression fiber to neutral axis corresponding to flange.
As factors affecting PS strand stress at flexural strength in the equation (2), effect of yield ratio is reflected in the equation as the coefficient kp. Also, a change of neutral axis due to steel reinforcement and sectional shape is reflected. However, effect of compressive strength of concrete is not reflected.
The equation (2) was first proposed by Loov and adopted in CSA A23.3 in 1994. This equation is still used in CSA A23.3-14 which is the latest revision of CSA A23.3.
VALIDATION OF DESIGN CODES
The approximate equations for PS strand stress at flexural strength were proposed prior to when the high-strength PS strands were developed. So, it needs to examine the applicability of the existing approximate equations for the high-strength PS strands stresses. To verify the approximate equations, compatibility based sectional analysis was conducted, and the results of analysis and the approximate equations were compared.
Sectional Analysis
Sectional analysis was performed with strain compatibility condition and force equilibrium condition, and PS strand stress at flexural strength can be obtained through the sectional analysis. To get the exact PS strand stress at flexural strength, accurate material properties of PS strand, concrete, and steel are needed. Thus, parameters of analysis and material models were determined to get the PS strand stress for high-strength PS strands and the sectional analysis was conducted.
Table 1: Properties of strand type as a parameter
Strand
type
fpu
[MPa] fpy / fpu
A 1,860 0.85
B 1,860 0.90
C 2,160 0.94
D 2,400 0.94
Material models of concrete and PS strands as following were used at sectional analysis. The Thorenfeldt et al. (1987) was used as the material model of concrete. The stress-strain relationship of concrete is defined as equation (5).
/ 1 / c o c nk ck c o
n f f n
(5)
The modified Ramberg-Osgood models recommended by Michael P. Collins (1991) and Eu-Jeong Choi (2015) were used as the material model of PS strands. The stress-strain relationship of PS strand is defined as equation (6) and the coefficients for each PS strand are indicated in Table 2.
1/1
1
ps pf c pu c pf A
f E A f
B (6)
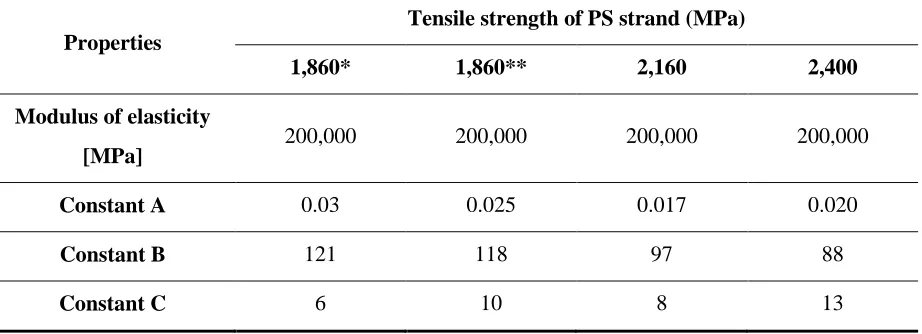
Table 2. Constants for Modified Ramberg Osgood model by PS strands
Properties
Tensile strength of PS strand (MPa)
1,860* 1,860** 2,160 2,400
Modulus of elasticity
[MPa] 200,000 200,000 200,000 200,000
Constant A 0.03 0.025 0.017 0.020
Constant B 121 118 97 88
Constant C 6 10 8 13
* Stress relieved, ** Low relaxation
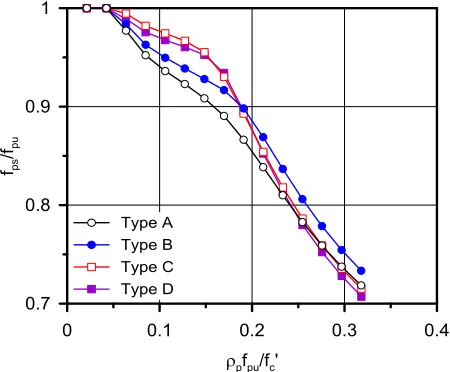
Effective prestressing stress is 50% of tensile strength of PS strand. The analysis was conducted with total 15 cross sectional area of PS strand, and fps / fpu is plotted on the y axis and ρp (fpu / fck) is plotted on the x axis. The results for the type A, B, C, and D were plotted in Figure 1.
For 1,860 MPa PS strands, Stress relieved PS strand has a yield ratio 0.85, and low relaxation PS strand has a yield ratio 0.90. Yield ratio of 2,160 and 2,400 MPa PS strands is 0.94. As yield ratio increases, PS strand stress at flexural strength in post-yielding range increases as shown in Figure 1. That is, yield ratio of PS strand influence the stress behavior of PS strand at flexural strength in post-yielding range. But, yield ratio does not influence the PS strand stress as the amount of PS strand increases. This is because yield ratio has no effect in pre-yielding range of PS strands.
Meanwhile, as the area of PS strand increases, PS strand stress at flexural strength decreases. At some point, the stress starts to decrease rapidly. This is because sectional shape of the member is I-type. As distance from extreme compression fiber to neutral axis get longer than thickness of upper flange, width of concrete section receiving compression rapidly decrease and it causes rapid increase of distance from extreme compression fiber to neutral axis. It means rapid decrease of PS strand strain, thus PS strand stress decrease rapidly.
As the area of PS strand increases, stress behavior of 1,860 MPa, 2,160 MPa, and 2,400 MPa PS strands get similar because all strands have similar modulus of elasticity. As the amount of PS strand in the member increases, PS strand stress at flexural strength shifts to pre-yielding range and stress behavior gets similar regardless of PS strand type.
Figure 1. Result of sectional analysis of PS strand stress at flexural strength
Validation of ACI 318-14
Figure 2 is a graph that compares the results of sectional analysis and an approximate equation for PS strand stresses proposed in ACI 318-14, for type A, B, and C. For type A and B which indicate 1,860 MPa PS strands, ACI predicts the increase in strand stress as increasing yield ratio of strand. This is because the equation reflects the effect of yield ratio by the coefficient γp. However, ACI does not predict the increase in strand stress at post-yielding range as increasing yield ratio of strand. This
is because the equation cannot reflect the increase in yield ratio. For fpy / fpu ≥ 0.90, the coefficient γp is all the same so that the coefficient cannot reflect increase in yield ratio of high-strength PS strands.
Figure 2. Comparison of the result of sectional analysis and ACI 318-14
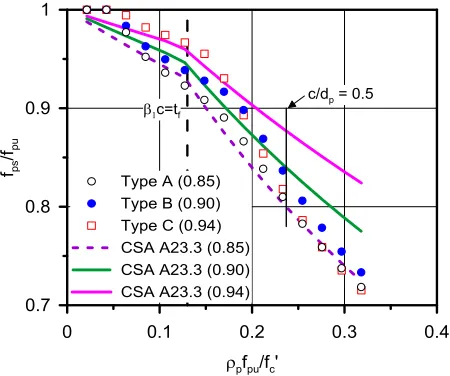
Validation of CSA A23.3-14
Figure 3 is a graph that compares the results of sectional analysis and an approximate equation for PS strand stresses proposed in CSA A23.3-14 which are type A, B, and C. CSA predicts the increase in strand stress as increasing yield ratio of strand. This is because the equation reflects the effect of yield ratio by the coefficient kp. Also, the equation reflects the effect of sectional shape on neutral axis. Therefore, the Loov predicts the rapid decrease in strand stress and predicts strand stress more precisely than ACI-318-14.
However, CSA does not predict the similarity of stress behaviour at pre-yielding range regardless of strand type. The decrease of coefficient kp at the high-strength PS strand increases strand stress in not only post-yielding range but also pre-yielding range. So, the equation predicts PS strand stress non-conservatively as the amount of PS strand increases. Figure 4 indicates that CSA does not accurately approximate PS strands stresses at pre-yielding range for strand type C and D. Therefore, the equation is not available at high-strength strands. The results imply that existing design codes need to be revised to indicate the stress behavior of high-strength PS strands well.
Figure 4. Stress-strain relationships of strands for CSA A23.3-14
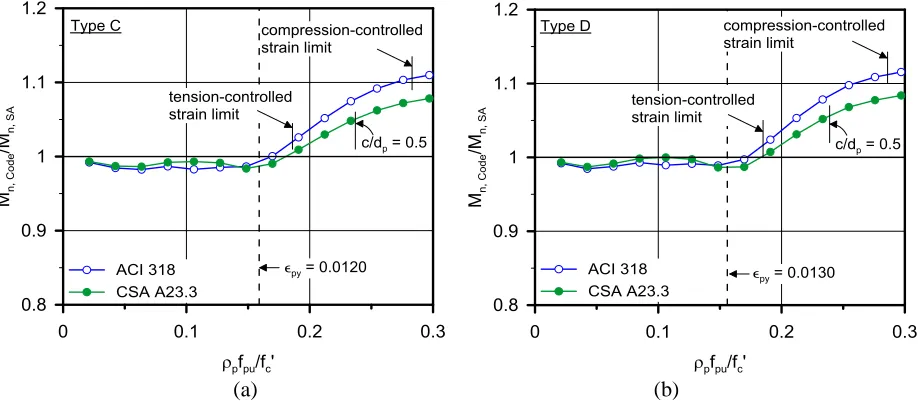
Validation of Flexural Strength
Figure 5 indicates the ratio of flexural strength obtained by design codes to flexural strength obtained by sectional analysis. For strand type C and D indicating high-strength PS strands shown in Figure 5, both design codes over-estimate flexural strength at pre-yielding range.
(a) (b)
Figure 5. Ratio of flexural strength for sectional analysis and design codes
PROPOSAL OF AN APPROXIMATE EQUATION FOR PS STRAND STRESS
Consideration of Pre-yielding Behaviour
Figure 1, the graph shows that the stress behaviour is similar at pre-yielding regardless of yield ratio. Using these properties, a revised approximate equation for PS strand stress is proposed in following chapter.
Proposal of an Approximate Equation
PS strand stress for post-yielding, εpy≤εps≤εpu, is as following with kp=2[1.04 - ( fpy/fpu )].
1 ps
p pu p
f c
k
f d
(7)
PS strand stress for pre-yielding, εprop≤εps≤εpy, is as following with ke=0.58.
2 1
3
ps py
e e p
pu p p
f c c
k k k
f d d
(8)
Where, cpy/dp =0.003/(εpy-εpe+0.0027). ke is an average of 4 optimized coefficients for each strand type obtained by non-linear regression.
The second term in equation (8) is introduced to eliminate the discrepancy between equation (7) and equation (8). cpy/dp is derived by substituting εpy for εps in the equation of εps used by Loov.
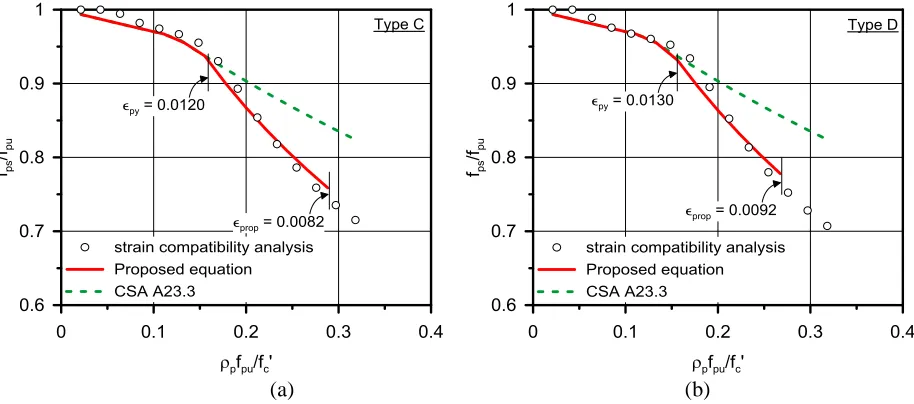
Validation of the Proposed Equation
To validate the proposed approximate equation for PS strand stress, the result of CSA A23.3-14 and the proposed equation for PS strand type C and D were compared as shown in Figure 6. The results show that the proposed equation predicts high-strength PS strand stresses more accurate than CSA A23.3-14 at the range of εprop≤εps≤εpy.
(a) (b)
The flexural strength of member with the proposed equation was compared with the results of ACI 318-14 and CSA A23.3-14. As shown in Figure 7, the proposed equation predicts flexural strength for high-strength PS strands at pre-yielding range more accurate than ACI 318-14 and CSA A23.3-14.
(a) (b)
Figure 7. Ratio of flexural strength for the proposed equation and design codes
CONCLUSIONS
This study analysed the applicability of approximate equations for high-strength PS strands stresses used in ACI 318-14 and CSA A23.3-14. ACI 318-14 does not predict the increase of stress at post-yielding due to an increase in yield ratio. Also, it overestimates the strand stress at pre-yielding because it does not consider sectional shape. CSA A23.3-14 reflects the influence of yield ratio and sectional shape, but it does not predict stress behaviour of high-strength PS strands at pre-yielding as well as ACI 318-14. Thus, an approximate equation for PS strand stress that presents the stress behaviour at pre-yielding range is proposed. Pre-yielding and post-yielding range is classified by yield strain of each type of strand, and different approximate equation is proposed for each range to predict stress behaviour for all range. Through the proposed equation, error of flexural strength for high-strength PS strand is able to be reduced.
ACKNOWLEDGMENTS
This research was supported by the BK21 PLUS research program of the National Research Foundation of Korea.
REFERENCES
ACI. (2014). American Concrete Institute Building Code Requirements for structural concrete (ACI
318-14) and Commentary. Farmington Hills, Michigan, USA.
CSA. (2014). Canadian Standard Association Design of concrete structures (CSA A23.3-14). Canadian Standard Association , Mississauga, Canada.
Choi, E. J. (2015). “Code Validation for Flexural Strength of PSC Members with High-Strength Strand,”
Seoul National University, Seoul, Korea.
Loov. R. E. (1988). “A General Equation for the Steel Stress for Bonded Prestressed Concrete Members,”
PCI Journal, 33(6): 108-137.