Analysis of Conditional Genetic Effects
and
Variance
Components
in
Developmental Genetics
Jun
ZhuAgronomy Department, Zhejiang Agricultural University, Hangzhou 31 0029, China Manuscript received March 13, 1995
Accepted for publication September 5, 1995
ABSTRACT
A genetic model with additivedominance effects and genotype X environment interactions is pre- sented for quantitative traits with timedependent measures. The genetic model for phenotypic means at time t conditional on phenotypic means measured at previous time ( t - 1 ) is defined. Statistical methods are proposed for analyzing conditional genetic effects and conditional genetic variance compo- nents. Conditional variances can be estimated by minimum norm quadratic unbiased estimation (MINQUE) method. An adjusted unbiased prediction (AUP) procedure is suggested for predicting conditional genetic effects. A worked example from cotton fruiting data is given for comparison of unconditional and conditional genetic variances and additive effects.
U
NDERSTANDING gene expression is one of themajor goals in developmental genetics. The in- fluences of a single gene or several major genes on qualitative traits have been extensively studied in devel- opmental genetics. The phenotypic variation for many important traits is essentially continuous and is influ- enced by both quantitative genes and environment ef- fects. Therefore quantitative variation for timedepen- dent measures is difficult to interpret in developmental genetics.
For quantitative traits of developmental behavior, the genetic effect (G,,) at time t is the sum of the genetic effect (G(,-,)) at time ( t
-
1) and the extra genetic effect ( G(4), which is most likely to be correlated with( G ( t - l ) ) . Quantitative variation of a population is usually analyzed by genetic variance components for traits mea- sured at different times. Genetic covariances or correla- tions between traits at time ( t - 1) and time t are also estimated sometimes. These analyses can provide infer- ences for the cumulative gene effects from initial time to t but not for the independent effects of gene expres- sion in the period ( t - I ) to t.
By univariate or multivariate analysis, conditional ran- dom variables with conditional variances have been used for detecting effects conditional on specific situa- tions. Estimation methods for conditional variances were proposed for analyzing autoregressive conditional heteroscedastic (ARCH) model in economics (ENGLE
1982) and also for estimating genetic variances condi- tional on selected base populations in animal breeding
(HENDERSON 1985, 1988). ENGLE’S method, which ex-
plicitly parameterizes the time dependency of the con- ditional variance for the error process of time series models, cannot estimate conditional variance compo- nents due to random genetic effects other than noise. Although HENDERSON’S method can estimate condi-
Genetics 141: 163S-1639 (Decernher, 1995)
tional genetic variance given selected base populations, it is not applicable to estimating conditional genetic variance components for timedependent measures in developmental quantitative genetics.
In this paper statistical methods are proposed for analyzing conditional genetic effects and conditional genetic variance components based on genetic models for quantitative traits with timedependent measures. Cotton data for fruiting behavior within the whole blooming period in 2 yr is analyzed as an example to illustrate the use of these new methods.
GENETIC MODEL FOR QUANTITATIVE TRAITS WITH TIME-DEPENDENT MEASURES
Among various genetic mating designs, the diallel design (HALLAUER and MIRANDA 1981) is the one widely used by plant and animal breeders for analyzing quanti- tative traits and also for developmental behavior studies
(HENDERSON 1990; ZHU et al. 1993a, 1993b).
Based on the diallel model with additive-dominance effects and genotype X environment interactions, the phenotypic mean of a trait measured at time t for the cross between inbred lines iandjin the kth blockwithin environment h can be partitioned as
y h i j k ( t ) = & ( f )
+
A t ( t )+
Aj(f)+
oQ(t)
+
m h t ( t )+
m h j ( t ) -k D&ij(t)+
B h k ( l )+
c h i j k ( t ) , (1)where y h i j k ( l ) is the phenotypic mean at time t for genetic
entry i X
j
in block k within environment h; & ( t ) is afixed effect at time t for environment h, A,,, is the addi- tive effect of genes from parental line i at time t, Ai(r)
1634 J. Zhu
of A,(,) X & ( t ) at time t, m h i ( t )
-
(0, M h j ( 1 ) is theinteraction effect of
x
E,,, at time t,-
( 0 ,& ; ( l ) ) ; DEhi](t) is the interaction effect of Dij(t) X Eh(,) at time t, DEhQ(1)
-
(0, a;;,o); & ( l ) is random effect ofblock k within environment h at time t, Bhk(,)
-
(0,u & ~ ) ) ; and fJ,qkk(t) is a residual effect at time t, t q " r ( l )
-
The additivedominance model can be written in a
(0, a:(/)).
matrix form of the mixed linear model,
y(1) =
m(0
+
U A e A ( t )+ us,(,)
+
UAheAe(t)+
UDAE(C+
U,+B(~)+
6
=
mu,
+
z
Uueu(,,, (2)u= 1
where y(,) is the vector of phenotypic mean for all en- tries of the mating design; b(t) is the vector of fixed environment effects at time t; X is the known incidence matrix with coefficients 1 or 0 relating to the fixed environment effects; e,(,, is the vector of random effects at time t, e,(,)
-
(0, 0:(~)1); U, is the known coefficient matrix relating to the random vector eu(l); U: is the transpose of U,; U6 = I is an identity matrix.The vector of random variables
y(,)
has variance-covar- iance matrixVar(y(t)) = d(t)uAUk
+
&(t)ULJU;>+
dE(c)UA&h+
&<(t)UDEUh+
dI(,,U*U6+
&IA
=
c
& 3 - J u U L= V(t). 71= 1
For developmental behavior traits, quantitative ge- netic effects at time t are not independent of those at time ( t
-
l ) , Cov(e,(l-l), = O , ( ~ - ~ , ~ ) U ~ U L . There- fore, phenotypic means of quantitative traits measured at time twill be correlated with the means measured at time ( t - l ) ,COV(Y(,-I), y[t)) = o~(t-l,t)uAUX
+
ou(t-l,gUnUb+
gAE(1-1,t)UM;uh.+
oDE(t-I,1)uL)EubE+
oB(t-l,t)UBu6+
04-1,t)Iti
=
c
~u(l-I,l)uuu:= C(1-1,1), 11= 1
where C ( [ - I , ~ ) is symmetric (C(l-l,l) = Ci,-l,t)) and identi- cal to C ( l , , - l ) .
Differences between observed means at sequential times (y(4 =
y(t)
- Y ( ~ - ~ ) ) are sometimes used for study-ing quantitative genetic effects on developmental be- havior during time ( t
-
l ) to t. Analyses based on y ( mwill not give net genetic variation within the period ( t
- 1) to t, since
6
Var(y(,) =
c
d(d&U:,,=1
ti
=
c
( d ( 1 ) - Z o u ( t - l , t )+
d(1-l))uJJ;= V(t)
-
2C(t-,,t]+
V(/-I),u= 1
and y(m is not independent to
y(,-,),
C O V ( Y ( ~ , =Instead of using differences between two random variables, conditional random variables can be used for detecting conditional genetic effects as well as condi- tional variance components. The genetic model for phenotypic means at time t conditional on phenotypic means measured at time ( I - l ) ,
(y(,)
/ Y ( ~ - ~ ) ) , is defined asC(1-1.1) - V(1-1).
y(t)/y(t-l) = m ( l l t - l )
+
UAeA(rl1-1)+
u I ~ O ( t j 6 - l )+
U,%E( t I t- I )+
U,,enfi;, 1 I 1- 1 )+
U H ~ B ( , I ~ - ~ )+
e c ( l l l - l )fi
= =yLIl-l)
+
c
U u e u ( t l 1 - I )71= 1
with the conditional variance-covariance matrix
Var(y(tI1-1)) = ~A(IIf-l)UAUk 2
+
&(1l/-l)U,AJ;~+
&(tlt-I)UAdJXE+
~ ~ ~ ~ ~ ( 1 1 1 - l ) U ~ ~ ~ ; u ; ~ ~ ;+
o;(,,,-l)uBu6
+
D:(t,l-uI6
=
c
d(tlr-l)uuu:,
- V(tll-l), u= 1
-
where b(tl,-l) is the vector of conditional environment effects at time t, and e,(llt-l) is the vector of conditional random effects at time t,
-
(0, o ~ ~ l ~ t - l ~ I ) .Conditional genetic effects at time tare independent of the genetic effects at time ( t - l ) , Cov(e,(lll-l),
e;(,-l)) = 0. Conditional genetic effects eu(lll-l) and the conditional variance o:(lll-l) can be used in develop- mental genetic analyses for illuminating the indepen- dent effects of gene expression within the period ( t -
1) to t.
METHODS FOR ANALYZING CONDITIONAL GENETIC EFFECTS AND VARIANCE COMPONENTS
The conditional variance-covariance matrix can be directly estimated by the following equation
( m o w -
SKI 1988;
Box
et al. 1994) :V ( t l 1 - I ) = V ( 1 ) - c : ( r - l . t l ~ ~ ~ l l c ~ , - l . t ~ . (3) Estimated variance components 6; in V ( t ) and V ( l - l ) can
and THOMPSON 1971; CORBEIL and S ~1976). Esti- E mated covariance components 3u(t-l,t) in C ( t - l , t ) can be calculated by the method suggested by ZHU and WEIR
(1994a, 1995).
Estimation of conditional genetic variance compo- nents ( a : ( t l l - l ) ) or prediction of conditional genetic effects (eu(rlt-l)) cannot be derived directly from the estimate of conditional variance-covariance matrix
( V ( t l The indirect approaches are suggested for analyzing conditional genetic effects and their variance components. For experiments on developmental quan- titative behavior with phenotypic means measured at time series ( t - 1) and t, a new random vector y* is
defined as
y* = Y ( t ) - c(f-l,tF&)(y(f-l) - X b ( t - 1 ) ) . (4)
Random vector y* has variance Var(y*) = V ( t ) - C ( t - l , t )
x
VG/l-,)C(t-l,t), which is identical to the conditional variance-covariance matrix V(,I /- ,). In practice, un-known parameters in Equation 4 can be replaced by their unbiased estimates.
If random vector y* is fitted to the additive-domi- nance model as in Equation 2,
y+ = Xb,
+
U,4eA*+
U s p+
U&efi2*+
U/M?%?+
UHeW+
ee*6
=
~
b
+
,
C
Uueu* ( 5 )u= 1
with variance-covariance matrix
Var(y,) = &UAUk
+
O & U J J ~+
aLxUA&~R+
u;)~,%U[)JJ;~+
a&u,ug
+
a:*16
=
a:*uuu:,
=
v,,
u= 1
which turns out to be the conditional variance-covari- ance matrix V(tlt-,).
Unbiased estimations for variance components o$
are obtainable by using the mixed model approaches
(ZHU et d . 1993c; ZHU and WEIR 1994a, 1995). There- fore, can be regarded as unbiased estimates for the conditional variance components o:(tlt-l). Since at* are equivalent to
ut(tlt-l),
genetic effects eu* also have an equivalency to the conditional genetic effects eu(tlt-l).Conditional genetic effects eu(tlt-l) (or eu*) can be pre- dicted by analyzing y* with several methods. The best linear unbiased prediction (BLUP) (HENDERSON 1963) and linear unbiased prediction (LUP) (ZHU et al. 1 9 9 3 ~ ; ZHU and WEIR 1994a) tend to give unbiased estimates for means but underestimated variances for predicted genetic effects (ZHU 1993; ZHU and WEIR 1995). An
adjusted unbiased prediction (AUP) is therefore sug-
gested for predicting the conditional genetic effects
(ZHU 1993; ZHU and WEIR 1995).
WORKED EXAMPLE OF DEVELOPMENTAL ANALYSES FOR COTTON FRUITING BEHAVIOR
Number of bolls per plant is one of the major yield components of Upland cotton (Gossypium hirsutum L.)
.
There is a high correlation between number of bolls and lint yield for cultivars and selected lines of Upland cotton (WOODWARD and MALM 1976). It was indicated, by comparing obsolete and modern cultivars, that mod- ern cultivars produced more bolls during the early growth season (WELLS and MEREDITH 1984). The final number of bolls depends on the number of bolls per plant setting in different stages of the blooming period (from early July to early September).A genetic analysis was conducted for fruiting behavior of Upland cotton within the whole blooming period. Four parental lines were used for diallel mating in 1981 and 1985. Four parents and their six F1 hybrids and six reciprocal crosses were included in 1981. But only four parents and their six F1 hybrids were included in 1985. Randomized complete block design with three replica- tions was used for both years. From July 1 to September 3 in each year, bolls per plant were counted for every 5 days in IO plants from each plot. Cell means of these 2-
yr data were analyzed by the additive-dominance model including genotype X environment interactions. Un- conditional analyses were conducted for genetic effects and their variances with observed mean
yt
and differ- ence between observed means at sequential times y(.n= y(t) - Y ( ~ - ~ ) . The gap from time ( t - 1 ) to time tis 5
days. Two kinds of conditional data, y(tIt-l) for pheno- typic means at time t conditional on means at time ( t
- 1) and y u A for final observation means conditional
on means at different previous time t, were analyzed. Variances were estimated by MINQUE(1) method, and genetic effects were predicted by AUP method
(ZHU 1993; ZHU and WEIR 1995). Jackknifing over blocks within year was used for estimates and standard errors of variances and also for predictors and standard errors of genetic effects (MILLER 1974; ZHU 1989). There were six blocks for
2
years, and the degrees of freedom were 5 for the jackknifing. A t-test was em- ployed for testing significance of genetic parameters studied. When estimated unconditional variances 3;were obtained, unconditional genetic variance compo- nents were estimated by
PA
= 26;,GJ
=&
$'Ab: =28;, and
GJb;
= Estimates of genetic variance com-ponents for difference and conditional variables were also calculated in the same way. All the data analyses were conducted by a PC computer with programs writ- ten in C.
1636 J. Zhu
A
B
c v)
C
Q)
C 0
E
8
8
9
C
m
‘e
14
12
10
8
6l
4
2 h
0
Date (MID)
0.6
0.4
0.2
0.0
Date (M/D)
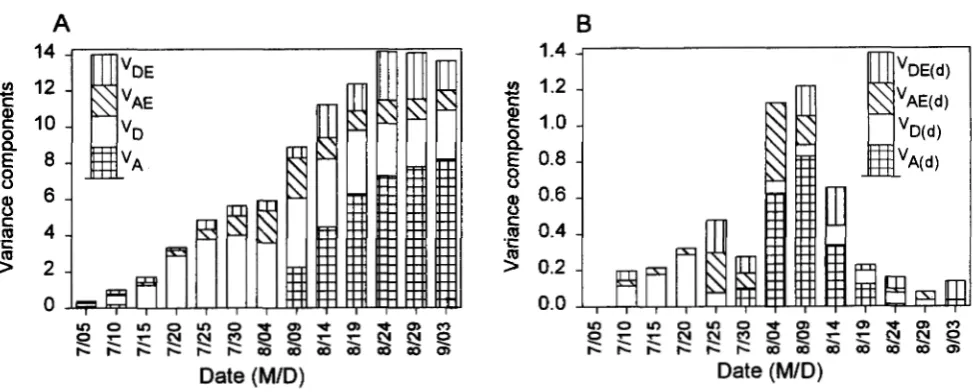
FIGURE 1.-Variance components for bolls per plant of Upland cotton. (A) Estimates of variance components for cumulative data yf: VA = additive variance, V, = dominance variance, V, = additive X environment interaction variance,
K,,;
= dominance X environment interaction variance. (B) Estimates of variance components for difference between observed means at sequential times y ( m = y(*) - Y ( ~ - , ) : VAcm = additive variance, VD(m = dominance variance, VMcm = additive X environment interaction variance, VDficm = dominance X environment interaction variance.per plant in different developmental stages. Compared to genotypic variance (V, = VA
+
K1)
genotype X envi- ronment interaction variance (V,, = V,+
VDE) was relatively small.At the initial stage 7/05, VD (0.17 -+ 0.04) and VA
(0.11 2 0.03) were two major components to the total
variation. VA was then decreased rapidly to zero on
7/
15. Additive variation was not detected during the pe- riod from 7/15 to 8/04. Additive variation increased steadily later on. V, increased up to 7/30 (4.00 2 1.04) and then decreased slowly. The major contribution of genetic variation for number of bolls per plant was due
m A
c,
1.4
C
g
1.2
8
1.0
E
0.8
5
0.6
2
0.4
.-
m
-
0
.-
.+j
0.2
8
0.0
C
Date
(M/D)
to dominance variance component in early period of blooming but due to additive variance component in late period of blooming.
Figure 1B showed genetic variance components for
bolls per plant setting in 5 days between times t and t - 1. Additive variation VA(4 was not detected from
7/
10 to 7/25 but was found during 7/30 (0.10 -+ 0.03)
to 8/19 (0.12 2 0.02) with peak at 8/09 (0.83 2 0.00).
Dominance variation VD(4 was the major component and increased until 7/20 (0.29 2 0.01). Large interac- tion variances V,,,, and/or &lb;(d) were observed from
7/25 to 8/14. Since variance of differences between
v)
C
Q)
C
c
8.
8
8
5
E
C
m
>
m
C0
-0
c
0
.-
-
.-
c
.-
R
14
12
10
8
6
4
2
0
Date
(M/D)
sequential random effects consists of components for both variances and covariance, it does not show the real variation due to the net effects within time t and time
t - 1. Therefore, the changes in genetic variance com- ponents cannot be appropriately explained by the re- sults of unconditional analysis for developmental behav- ior of cotton fruiting.
The analysis results for conditional variance compo- nents
V,,,
,-1) was presented in Figure 2A. After the initialstage (7/05), conditional variation was not detected for conditional additive effects A(tjt-l) but was significant for conditional dominance effects D(tlt-l) from 7/10
0.02). These induced the increase of dominance varia- tion but the decrease of additive variation of cotton bolls in the early developmental stages. No significant
V & t I t - l ) was detected since 7/20, which indicated the
turning off of the gene expression for dominance ef- fects. But unconditional dominance variances for both cumulative effects V, and difference effects Vu(& were still large and significant at
7/20.
Conditional additive variancesVA(t~l--l)
were found significantly for number of bolls per plant from 7/30 (0.11 ? 0.06) to 8/19 (0.07 2 0.03), indicating the turning on of the gene expression for additive effects for this period. The most dramatic increase ofVA(rlt-l)
was found at 8/04 (0.60 20.12), when unconditional V, was not even detectable and VA(& was not the largest one. The dynamic changes of gene expression resulted in the decrease of domi- nance variation and the increase of additive variation for boll setting during later developmental stages.
Conditional additive variation was observed 10 days before unconditional additive variances V, were detect- able. This implies that expression of quantitative genes might start several days before the accumulated genetic effects for developmental behavior can be detected by unconditional genetic analysis.
Conditional variance
VA(tlt-l)
and Vm(tlt-l) accounted for -70% of total variation for number of bolls per plant on 8/04. But no significance was observed for these unconditional variance at that time.VM.,l,-l)
was found to be significantly large on 7/25 (0.20 ? 0.08), 8/04 (0.44 ? 0.17) and 8/09 (0.17 ? 0.07). The differ- ence of environment effects in 2 yr could influence the gene expression for additive effects of parents and Flhybrids in these two stages.
Analysis results were presented in Figure 2B for con- ditional genetic variances ( Vu e ) of the final number of bolls per plant (f = 9/03) conditional on observed number of bolls per plant at different previous time t.
As compared with the cumulative variance components in Figure 1A on 9/03, conditional variance components enlarged from 7/05 to 7/30 and then diminished rap- idly. After 8/14 conditional variances V,9/0818/14"29) were very small. It was implied that gene expression contrib- uted to the final number of bolls was negligible after 8/14. It was also suggested by the largest conditional
( ( K > ( l l l - l ) 0.03 5 0.01) to 7/15 ((VD(LlL-1) = 0.06 2
variances y9/0317/30) that gene expression in later July (7/25
-
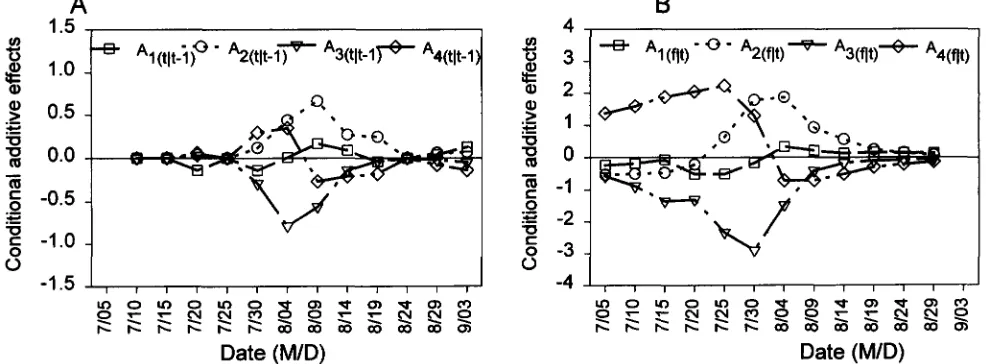
7/30) had little influence on genetic variation of final number of bolls per plant. It was found by the conditional analysis that the period from 7/30 to 8/09 was a critical time for bolls setting with lots of new gene expression (large V , , l t P l ) ) and enormous influence on final number of bolls (small V u l n ) .Predicted unconditional and conditional additive ef- fects for four parents were presented in Figures 3 and 4, respectively. As compared to the other three parents, the early-season parent
(e7)
had more bolls per plant in early July but less later on. Both P, and P4 belonged to the later-season parents with similar phenotypic means during whole developmental stages.Unconditional additive effects were positive for A3
but negative for A2 until 7/10. Additive effects were not found for all the parents from 7/15 to 8/04, but later on decreased AS and increased A, and
&
were detect- able while Al still remained near zero. Unconditional additive effects of 5-day bolls setting ( A ( & ) and condi- tional additive effects ( A ( , I ~ - ~ ) ) for three parents were already detected on 7/30 and 8/04. Therefore, quanti- tative genes expressed positive additive effects for R2and P4 but negative for P 7 in 10 days before they can
be detected by unconditional genetic analysis for cumu- lative data. The dissimilarity of boll-setting patterns for
P2 and P4 in mid- and later stages of development can be detected by conditional additive effects A ( , I ~ - ~ ) . Both
A2(,1,-,) and & ( t l , - - l ) were positive on 7/30 and 8/04. After that time, A2(t1t-1) continued to have positive ef- fects, but A4(t11-1) had negative effects.
The predicted conditional additive effects A,, t ) could
further reveal that gene expression of parents in the blooming period could have different effects on the final number of bolls per plant. Since conditional addi- tive effects A(g/oq7/30) had similar magnitude as uncon- ditional additive effects of final number of bolls (A(9,,
0 3 ) ) for all four parents, gene expression during 7/25 to 7/30 would not affect the additive variation of par- ents for final number of bolls. For the later-season par- ents, large influence of gene expression was detected for P4 in 8/04
-
8/19 but for P2 before 7/25 and in 8/09-
8/19. For the early-season parent (Z'?), geneexpression had effects on additive variation of final number of bolls in two periods (before 7/20 and in 8/
04
-
8/14).This study shows that conditional analyses of genetic effects and genetic variance components are more pow- erful than unconditional analyses for finding gene ex- pression of quantitative traits of developmental behav- iors.
DISCUSSION
Genetic behavior measured at time t is the con- founded result of genes expressed before time ( t - 1)
FIGURE 3.-Additive effects of four parents for bolls per plant of Upland cotton. (A) Predicted additive effects for cumulative data yt: AI = additive effect of parent one, AP = additive effect of parent two, AS = additive effect of parent three, A, = additive effect of parent four. (B) Predicted additive effects for difference between observed means at sequential times y(<,) = y ( I ) - yi,-l):
= additive effect of parent one, Azo = additive effect of parent two, ABim = additive effect of parent three, A4c,o = additive effect of parent four.
revealed by analyzing developmental behavior at spe- cific stages could provide inference only for accumu- lated genetic effects at that time. Although differences between observed means at sequential times are some- times used for studying quantitative genetic effects on developmental behavior, these analyses are still affected by the variables at previous times. Linear time series models have been proposed for development and age- related changes (EAVES et al. 1990). In these models phenotypic means measured at time t are expressed as linear functions of previous phenotypic means at time
( t - 1 ) and currently expressed genetic and environ-
mental effects. This methodology still encounters the
A
1.5 , I
problem of dependency of the current effects on the previous behavior.
Analysis of conditional genetic effects and their vari- ance components provides a way for exploring gene expression on quantitative traits in different develop- mental stages. Statistical methods proposed in this pa- per are not only suitable for an additive-dominance model presented in this paper, but are also applicable for other genetic models expressed in mixed linear models. For some genetic models with correlated ge- netic factors, such as seed or endosperm models (ZHU
and WEIR 1994a,b), MINQUE(0/1) can be applied for
estimating variance and covariance components (ZHU
- 1 . 5 1 ,
, ,
,
,
, , ,
,
,
,
,
, IDate (M/D)
"
- 4 5 1Date (MID)
and WEIR 1994a). MINQUE(O/l) is a MINQUE method setting 0 for all the prior covariances and 1 for all the prior variances.
Analysis of conditional genetic effects and condi- tional variance components can be used not only for developmental quantitative traits but also for some ag- ronomic traits. For example, the number of bolls per plant, boll size and lint% are three components for lint yield of cotton. Instead of analyzing genetic effects and variance components for lint yield of cotton, we can evaluate extra gene effects and genetic variation of lint yield conditional on any one of its components. For example, estimated genetic variance components for lint yield (LY) were V4(l-n = 79.7
+-
13.6, VD(rr) = 0.0 ? 0.0, VAE(l.n = 25.9 ? 13.0, andG;,(,,n
= 81.0 5 23.9. The conditional variance components of LY given the number of bolls (NB) observed wereVA(,,ylNB)
= 37.5 57.5, G ; , ( ~ , ~ I N ~ ) = 0.0 2 0.0,
VAE(I,Yl,vB)
= 11.1 -+ 4.1, and & I E ( L y l N B ) = 79.3 ? 22.6. The proportion of b ' ( I A y l N B ) /might uncover gene effects without the influence of the given component (NB) on the final lint yield
(LY), and 1.0 - V~r,ylNB)/V(l.n could be used for measur-
ing the proportion of gene effects of NB on lint yield
LY. It was suggested that genetic effects of number of bolls per plant contributed "45% variation of additive effects and additive by environment effects but only
2%
variation of dominance by environment effects for lint yield of cotton.
I am grateful to BRUCE S. WEIR and SHAOBANC ZENG for helpful comments on the manuscript. I also thank two anonymous reviewers for useful comments and suggestions on the earlier version of the manuscript. This research was supported in part by National Natural Science Foundation of China (39170417) and National Institutes of Health grant GM-32518.
LITERATURE CITED
Box, G. E. P., G. M. JENKINS and G. C. REINSEL, 1994 Time Series
Analysis: Forecasting and Control, Ed. 3. Prentice Hall: Englewood Cliffs, NJ.
CORBEII., R. R., and S. R. SEARLE, 1976 Restricted maximum likeli- hood (REML) estimation of variance components in the mixed model. Technometrics 18: 31-38.
EAVES, L., J. K. HEWITT, J. MEIER and M. NLALE, 1990 Approaches
to the quantitative genetic modeling of development and age- related changes, pp. 266-280 in Developmental Behauior Genetics,
edited by M. E. HAHN, J. K. HEWITT, N. D. HENDERSON and R. H. BENNO. Oxford University Press, New York.
ENCI.E, R. F., 1982 Autoregressive conditional heteroskedasticity
with estimates of the variance of United Kingdom inflation. Econometrica 50: 987-1007.
HAILAUER, A. R., and J. B. MIRANDA, 1981 Quantitatiur Genetic5 in Maize Breeding. Iowa State University Press, Ames, Iowa. HENDERSON, C. R., 1963 Selection index and expected genetic ad-
vance, Publication 982, pp. 141-163 in Statistical Cmetics and
Plant Breeding, edited by W. D. HANSON and H. F. ROBINSON. National Academy of Science, National Research Council, Wash- ington, DC.
HENDERSON, C. R., 1985 Best linear unbiased prediction using nn- merator relationship matrices derived for selected base popula- tions. J. Dairy Sci. 68: 443-448.
HENDERSON, C. R., 1988 A simple method to account for selected base populations. J. Dairy Sci. 71: 3399-3404.
HENDERSON, N. D., 1990 Genetic analysis as a route to understand- ing the evolution of animal behavior: examples using the diallel cross, pp. 190-216 in Developmental Behavior CheLics, edited by M. E. HAHN, J. K. HEU'ITT, N. D. HENDERSON and R. H. BENXO. Oxford University Press, New York.
KRZANOWSKI, W. J., 1988 Pnncipks of Multivwiute Analysis: A U t e r ' r
Perspective. Clarendon Press, Oxford.
MILLER, R. G., 1974 The jackknife: a review. Biometrika 61: 1-15.
PATTERSON, H. D., and R. THOMPSON, 1971 Recovery of inter-block
information when block sizes are unequal. Biometrika 58: 545- 554.
bo, C. R., 1970 Estimation of heteroscedastic variances in linear models. J. Am. Stat. Assoc. 65: 161-172.
b o , C. R., 1971 Estimation ofvariance and covariance components MINQUE theory. J. Multivariate Analysis 1: 257-275.
WEI.I.S, R., and W. R. MEREI)ITH, JR., 1984 Comparative growth of obsolet and modern cotton cultivars. 11. Reproductive dry matter partitioning. Crop Sci. 24: 863-868.
WOODWARD, T. W., and N. R. M.4I.M, 1976 Influence of lint percent- age on yield, boll, and fiber characteristics in Acala strains of Upland cotton. Crop Sci. 16: 594-596.
ZHU, J., 1989 Estimation of genetic variance components in the general mixed model. Ph.D. Dissertation, NC State University, Raleigh, NC.
ZHU, J., 1993 Methods of predicting genotype value and heterosis for offspring of hybrids. (Chinese). J. Biomathematics (Chinese),
8: 32-44.
ZHU, J., D. JI and F. Xu, 1993a Genetic analysis for flowering and fruiting of different sites on cotton plant. (Chinese). Acta Gos sypii Sinica, 5: 25-32.
ZHU, J., D. JI, and F. XU, 1993h Genetic analysis for flowering and fruiting behaviors of Upland cotton (Gossypium hirsutum L , ) ,
pp. 302-312 in Proceedingy of Beijing International Symposium for
Cotton Genetics and Breeding, edited by Chinese Society of Cotton. Chinese Agricultural Science Press, Beijing.
ZHU, J., D. JI and F. XU, 1993c A genetic approach for analyzing Inter-cultivar heterosis in crops. Chinese J. Genet. 20: 183-191. ZHU, J., and B. S. WEIR, 1994a Analysis of cytoplasmic and maternal effects: I. A genetic model for diploid plant seeds and animals. Theor. Appl. Genet. 89: 153-159.
ZHU, J., and B. S. WEIR, 1994b Analysis of cytoplasmic and maternal effects: 11. Genetic models for triploid endosperm. Theor. Appl. Genet. 89: 160-166.
ZHLr, J., and B. S. WFJR, 1995 Diallel analysis for sex-linked and maternal effects. Theor. Appl. Genet. (in press).