SELECTION FOR HETEROZYGOTES IN SMALL POPULATIONS
ALAN ROBERTSON1
Institute of Animal Genetics, Edinburgh, Scotland
Received May 24, 1962
I N his mathematical analyses of evolutionary processes WRIGHT ( 193 1, 1937)
has given particular attention to the interaction of population size with the factors of selection, mutation and migration. Here he introduced the powerful concept of the "gene frequency distribution" which may be thought of as refer- ring either to similar loci in the same population or one locus in many popula- tions. In the absence of mutation and migration, he showed that the gene fre- quency distribution assumes a constant form with all frequencies, except the two extremes, declining by a constant fraction each generation. In the absence of selection, the distribution becomes a rectangular one and intermediate fre- quencies decline by a fraction 1/2N each generation, where N is the effective population size.
With both selection and mutation, he showed that an equilibrium distribution is reached in which the fixation of populations by chance is exactly balanced by those segregating anew because of mutation, and he derived a general formula for this distribution. With no selection the distribution takes the iorm + ( q ) + ( q (1 - q))"""-' where q is the gene frequency and U the mutation rate (if the latter is assumed equal for both alleles). The mean frequency of heterozygotes is then given by 4Nu/(8Nv
f
1) and is therefore proportional to the population size, ifNv
is small.The analysis of the effect of particular kinds of selection has been almost restricted to the case of constant decline without mutation, There WRIGHT and
KERR (1954) and KIMURA (1957) have dealt with genes having an additive effect on selective advantage and KIMURA also dealt with recessive or dominant genes. But, in the study of genetic variation, by far the most interesting situation is that in which the heterozygote has a selective advantage over both homozy- gotes. REEVE (1955) has analyzed the effect of heterozygous advantage in very small populations, using the method of mating type matrices, but this method becomes cumbersome for all but the simplest mating systems.
All these analyses have been concerned with the effects of differences in selective advantage within the inbred line or population. HAYMAN and
MATHER
(1953) dealt with the matter rather more generally by also taking into account competition between sublines of restricted size. The two situations differ funda- mentally in that if we are dealing only with differences within a line, there is always a finite chance, with the exception of lethals balanced against one another, 1 Member of staff of the Unit of Animal Genetics of the Agricultural Research Council of Great Britain.
1292 A L A N ROBERTSON
that all individuals chosen as parents in a particular generation will be homozy- gous for the same gene and that the line will therefore become fixed. Excepting balanced lethals, selection can then only retard and not prevent fixation but. if there is competition between individuals from different lines, H A Y M A N and
MATHER showed that above a critical level of advantage for the heterozygote which depends on the mating system a balanced situation is reached in the population of lines as a whole. Any particular line will eventually become fixed but the population will remain heterozygous because of the greater contribution of heterozygous lines to the next generation.
The maintenance of genetic variation in populations of outbreeding organisms is a matter of considerable interest to the students of both evolution and of quantitative inheritance, and in some circles selection for heterozygotes is con- sidered as the most important of the forces conserving this variation. It therefore seemed important to investigate thoroughly the interaction of selection for heterozygotes, which in large populations is certainly a force conserving genetic variation, with the effect of a restriction in population size which acting alone removes variation from the population. The analysis here presented shows up clearly the importance of the equilibrium gene frequency in such a discussion, in that, if this is extreme, selection for the heterozygote may increase the rate of loss due to restricted population size.
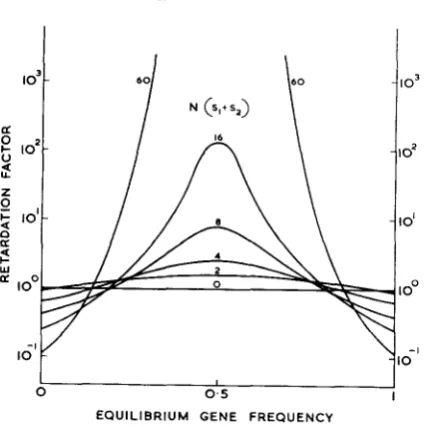
We shall be concerned only with selection within random breeding populations of restricted size. W e shall use WRIGHT’S methods to analyze the effect of selec- tion €or the heterozygote in retarding fixation in the absence of mutation and in conserving heterozygosity when there is recurrent mutation. In the first situation, it is convenient to take the relative loss of heterozygosity by 1/2N each generation in the absence of selection as o w standard and to evaluate the effect of selection in terms of the factor by which this is retarded. Thus if the relative loss is by 1/200N each generation, the retardation factor is 100. With recurrent mutation, we take as the standard the mean level of heterozygosis in small populations with no selection and measure the factor by which this is increased. Using this convention, the result of selection is given the same direction in the two situations. We shall deal only with the two allele case in which the relative selective advantages of the genotypes A , A , , A,A,, and A,A, are l-sl, 1 and I F S ? , respec- tively. If q is the frequency of the A , allele then the equilibrium frequency, Q ,
in large populations is given by
q
= s2/ (sl+
s,) and the change in gene frequency from generation to generation in a large population not at equilibrium by aq =The state of constant decline without mutation: To attack the problem of the rate of decline of heterozygosity in the absence of mutation, it is necessary to express the change in gene frequency with time in the form of a differential equation. If the distribution is written as
+
(q,t) we have(SI
+
s 2 ) q(1-q) (G-q).a4
and in the state of constant proportional decline we can put - = -K+. This is
RESTRICTED POPULATION SIZE 1293
only true for certain values of K (the so-called “eigen-values” of the equation) and our problem is to find the smallest one of these. They will be of the form
K =
2~
f ( N (sl 4- s,),?).
Because of the symmetry, any solution must be sym- metrical in-4
and (= 1 -7 ) .
W e shall use ?j to refer to the smaller of the two.KIMURA (private communication) has given a solution for small values of
N s when
1
is one half (s = s1 = s,) as a power series,
( N s ) ~
4-
. .
.)
2 5 26 . 3 5
5 6 - 7 3 . 1 1 ( N s ) ’ -7( N s ) ~
-
5 7
which appears from our present work to be valid u p to N s = 4. For large values of N (s, f s,)
,
MILLER (1962) has given a formula involving asymptotic expan- sions, which may with some loss of generality be reduced toThe ratio of the two terms depends on
G,
and the condition for the expression to hold is, in fact, that 2 N ( s 1 f s2)G2 shall be large, where is the smaller of the two allele frequencies. This expression does not hold for a complete recessive(9.
= s2 = 0) for which MILLER’S results indicate that, if N s , is large, K tends to1 3
-V N s , approximately.
“-4
For the region in which the above expression does not hold, we have had re- course to a n electronic computer and I am much indebted to MR.
MILLER
of the National Physical Laboratory for his help in this matter. He devised a program to give K for values of N ( s ,+
s 2 ) up to 60, although most of the calculations have been done at values below 24. The results have been given in detail byMILLER ( 1 9 6 2 ) and Figure 1 shows the plot of 2NK for various values of
9.
andN (sl f s,)
.
Values above the zero line represent a retardation of fixation and below the line an acceleration. The results may be summarized as follows:(i) The effect of heterozygote advantage depends markedly on the equilibrium gene frequency, being at its highest for frequencies around one half.
(ii) If the equilibrium frequency is outside 0.2 to 0.8, heterozygote advantage may actually accelerate fixation for a wide range of values of N (sl f sz)
.
(iii) Except for equilibrium values close to 0.2 and 0.8, the lower limit to this range is small. The upper limit increases as the equilibrium frequency approaches O o r l .
(iv) At high values of N(sl f s2), the transition between retardation and fixation, considered as a function of equilibrium frequency, is very sharp.
(v) For all equilibrium frequencies except 0 or 1 , a continued increase i n
N (s, f so) will eventually lead to a region of acceleration. It is not possible to give an adequate table of critical values for the border line between retardation and acceleration, because it is precisely here that expression ( 1 ) begins to fail, but we can give a reasonable table of values for the retardation to be by a factor of
1294 A L A N EOBERTSON
lo3
0 '
0'
0"
-I
0
I
0 0 . 5
EQUILIBRIUM GENE FREQUENCY
FIGURE 1 .-The retardation of fixation by heterozygate advantage in the absence of mutation.
TABLE 1
V a lu e s of N ( s ,
+
s g ) producing a retardation of rate of fixation by a factor o f 100-
4 0 05 0 1 0 2 0 3 0.4 0 5
N ( s ,
+
s2) el00 490 110 45 22 15It should perhaps not be surprising that heterozygote advantage does not retard fixation at extreme equilibrium frequencies. It is obvious that selection against a rare recessive will accelerate the approach to homozygosis. I t is relevant to remember that the effect of small population size is to make gene frequencies drift towards extreme values. With an equilibrium frequency of 0.5, sclection opposes random fixation over the whole of the range. With an extreme equilibrium frequency, selection and random drift act in the same direction for gene fre- quencies between one half and the equilibrium frequency and therefore reinforce each other over this important range.
The chance of fixation of a gene: K I M U R A ( 1 9 5 7 ) has derived a formula for the chance of fixation of a gene in terms of its initial frequency, the population size, and the selection forces. With selection for the heterozygote, his formula becomes
RESTRICTED POPULATION SIZE 1295
refer a sudden reduction in the size of a large population at equilibrium. KIMURA’S formula then shows that there is always a decrease in the frequency of the less frequent allele (which is, of course, the allele with the least favorable homozy- gote). When N ( s ,
+
s?) is small, a simple expansion can be given as follows:2
U ( ? ) = 7 + $ v ( s 1 + s 2 )
j7q
(7-P)
+ .
. .
so that if
7
is less than one half, u ( q ) will be less thanq.
The less frequent allele will thus decline in frequency during fixation. We shall see a parallel to this when we discuss the equilibrium gene frequency distribution under recurrent mutation. The half-life of the fixation process (ROBERTSON 1960) can be shown by the method of moment-generating matrices to be of the order of 2Ngenerations.
This has interesting consequences in the effect of the reduction of the breeding size of a large population. There will be a range of population sizes, in which genetic drift will lead to fixation but in which we shall fix the same allele in all such populations. We have here an odd case of an inbreeding degeneration which is not recovered on crossing because all populations will have the same allele. At smaller population sizes, the average change in gene frequency during inbreeding will be smaller. Thus, if we wish to make inbred lines for subsequent crossing, the critical rate of inbreeding is not that which leads to homozygosity, but that which leads to it without marked changes of gene frequency on the way to fixation.
The maintenance of heterozygosity with recurrent mutation: Inserting the expression A q = (sl f s,) q( 1 - q )
(4
- q ) into WRIGHT’S general formula for the equilibrium distribution with recurrent mutation, we obtain the expressionFor high values of N ( s ,
4-
s,),
the distribution will be normal about the equi- librium gene frequency except that the extreme unfixed frequencies will be higher because of the constant influx of genes into the fixed populations by mutation. To find the average amount of heterozygosity, we must average2q (1
-
q ) over this distribution. I have not been able to find a general expression but have obtained one which is adequate until the mean heterozygosity approachesthe level in a large population. It is
1 -x?/z dx where erfxo =
dz
e1296 A L A N ROBERTSON
adequate at low values of N ( s l
4-
s,) and the present expression is not adequate at high values. In further distinction from (1 ), it is valid for selection against a recessive gene(9
= s, = 0) when it gives the value 4Nuqx,
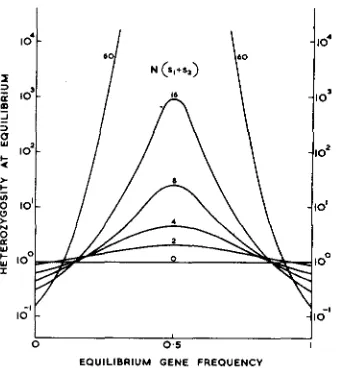
which may be compared to WRIGHT’S (1937) expression for the mean frequency of a lethal recessive u\/2 T N .This expression is plotted for different values of 7j and N ( s l -k s,) in Figure 2, which is obviously similar to Figure 1. The range of equilibrium gene frequency over which heterozygote advantage always conserves variability is slightly greater than that invariably leading to a retardation of fixation, covering the values of 0.15 to 0.85 and being at its narrowest when N ( s ,
4-
s,) is 8. As the equilibrium frequencies become more extreme so we need to go to higher valuesof N ( s ,
+
s a ) before heterozygote selection increases the genetic variability in thepopulation above that found in the absence of selection. If
S =
0.1 or 0.9, the critical value is 50 and for 0.05 or 0.95, it is 420.The value of 2jsq for the heterozygosity in a large population must impose an upper limit. We may then ask what size of population is needed before we find half as much genetic variability as is found in a large population-crudely, how big a population is “large.” This will obviously depend on U . s1
+
s2. and7.
We shall in fact be specifying a set of values above which the genetic variability will be little dependent on changes in population size, mutation rate or selection in- tensity but below which these variables will be important. We are. in asking this question, operating in a region in which the expression (2) is not valid and2Ns,
RECESSIVE ( < = 0)
io4
0.3
0 5
I I
0 0 . 5 I
E Q U i L I 0 R I U M GENE FREQUENCY
0 01 01 10,
5 , + 5 2
FIGURE 2.-The increase in heterozygosity at equilibrium i n small populations with
tion.
FIGURE 3.-The population size required
half the large population value. (Mutation rate = IO-2.)
RESTRICTED P O P U L A T I O N SIZE 1297
the necessary values have been obtained by numerical integration. They are summarized for U = in Figure 3. The results can be modified for other muta-
tion rates by noting from ( 2 ) that they specify a set of values of N u , N ( s l
4-
s z )and
7
for which the heterozygosity is half that for large populations.For a given
7,
if a set of values of N , U , s1 -I- sz satisfy the conditions, then SOwill N / k , kv, and k ( s l
+
s 2 ) . A mutation rate of would then require the curves of Figure 3 to be both lifted and moved to the left by a factor of ten. The curves show clearly that, for9
= 0.1, a larger population size is needed fors1
4-
s2 0.001 and 0.01 than if there is no selection at all. The horizontal line at the top of the diagram refers to selection against a recessive, in which the critical population as here defined is 1/6u, independent of s. It is not generally realized that for the classical equation U = sq2 to apply to a recessive the effective popula- tion size has to be of the order of tens of thousands. For small populations WRIGHT'S formula g = U d 2 ~ N applies for a lethal recessive.The mean gene frequency will also be dependent on population size. Under the conditions in which the expression ( 2 ) is valid the mean gene frequency is given by the expression
-
When the population size is very small, the gene frequency will be determined solely by the mutation rate and will in our model be close to one half. The fre- quency of the less frequent allele will then decline sharply below
'4
and will slowly rise again to this value as the population size increases. This has obvious relevance to the chance of fixation of a single new mutation into a population homozygous for the alternative allele and the above formula can be derived from the expression given earlier for the chance of fixation of a gene by substituting9
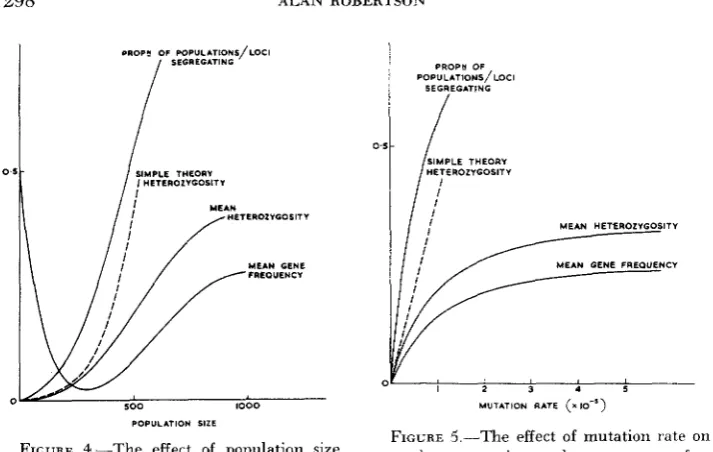
== 1/2N and 1-1/2N, respectively. Figure 4 shows for one specific case ( U = s1+
s2 = 0.04,9.
= 0.3) the effects of an increase in population size on the proportion of populations segregating, the mean gene frequency, the mean hetero- zygosity, and also the validity of expression (2) for the mean heterozygosity. The basic data were obtained by numerical integration of the distribution curve.In very small populations almost all loci are fixed and the mean gene frequency is one half. As the size increases, the latter decreases markedly and we have a fair range of population size in which almost all loci are fixed, but all for the same allele. Then as more populations show segregation the curves rise to their large population values but these are not approached until the population size reaches 1000. In Figure 5 are shown the corresponding quantities for the situa- tion in which N = 500, s1
+
s2 = 0.04, and9
= 0.3 and there is variation in the mutation rate U .DISCUSSION
1298 A L A N ROBERTSON
I
mop* OF POPULAT~ONS/LOCII
SEGnEGATINGPROP# OF SEGUEGATING POPULATIONS/LOCI
0 5
I /
SIMPLE THEORY
MEAN HET€ROZYGOSITY
MEAN GENE FUEOUENCY
0 I
2 3 4 5 MUTATION UATE (x IO-') POPULATION SIZE
FIGURE 5.-The effect of mutation rate on
mean heterozygosity and mean gene fie.
- quency ( N ~ 3 0 0 . s, +s, = 0.04 and 4 =
0.3).
FIGURE 4.--The effect of PoPulation size
quency ( U = 10-2. sL +s,=O.O4 and q =
0.3).
on mean heterozygosity and mean gene fre- -
genetic variation within a population if the equilibrium gene frequency is close to 0.5, but its effect drops off very rapidly as the equilibrium frequency goes towards extreme values and in some conditions the loss of genetic variation from a population may be accelerated if the equilibrium gene frequency is sufficiently extreme.
RESTRICTED POPULATION SIZE 1299
dependent on mutation rate (at least if we take mutation rates of the order of 1 0-5 as our standard).
Although these critical population sizes may seem small in the context of natural populations, they are very relevant to laboratory experimentation. The usual laboratory populations of Drosophila, for instance, kept in bottles and tipped over in mass every few weeks probably have population sizes of the order of a few hundreds at most. We must then expect that the genetic situation in such stocks may be considerably different from that in the wild populations from which they were derived, apart from the effect of the change in environment. Here again the equilibrium gene frequency is important. In such small laboratory populations the loci showing continued segregation will tend to be even more central in equilibrium gene frequency than will those in wild populations.
My own particular interest which led to this analysis was in the possibility that a continued restriction of population size to a small number of parents might give us useful information as to the nature of forces maintaining variation in large populations. The conclusions from the theoretical analysis are not very encouraging because it is the equilibrium gene frequency rather than the actual magnitude of the selective forces which is the most important factor in controlling the rate of fixation of genetic variation in small populations. A given average selective disadvantage of the two homozygotes is much more potent in maintain- ing genetic variation if the two homozygotes are themselves equal in selective ad- vantage than if one is much fitter than the other. It may therefore be extremely difficult to draw useful conclusions from the analysis of variation remaining in populations restricted in size for many generations.
Finally, we should point to the limitations of the analysis. First of all we as- sume that there are no interactions between genes at different loci in their effect on selective advantage. Further we assume two alleles at each locus. The exten- sion to many alleles at each locus will be difficult but nevertheless of importance, in that one would suspect that the number of alleles which could be maintained in a “small” population might, in fact, be rather small. KIMURA (1955) has shown that inbreeding without selection in a multiallelic situation rapidly re- duces the number of alleles segregating to two and one might expect that similar situations would apply to mild selection for the heterozygote. This would be a further reason why small populations might very well be very different to their parent large populations in the type of genetic variation they contain.
S U M M A R Y
1. A theoretical analysis has been made of the effect of selection for heterozy- gotes in small populations.
2. The equilibrium gene frequency in large populations proves to be the most important factor controlling the effect of such selection in small populations. The effect of heterozygous advantage is at its greatest with central equilibrium fre- quencies and declines as these approach the extremes.
1300 ALAN ROBERTSON
selection for the heterozygote may over a large range of population sizes in fact magnify the effect of reduced population size in leading to fixation.
4. With the values of mutation rate and heterozygous advantage likely to be encountered in practice, population sizes of the order of 1000 at least are required before the genetic variation found in the population under recurrent mutation approaches the value in large populations.
5 . The mean gene frequency in small populations may be far removed from
the value in large populations and the allele which is least fit in the homozygous state may well have a very low frequency.
LITERATURE CITED
HAYM.~N, B. I., and K. MATHER, 1953
KIMURA, M,, 1955
MILLER, G. F., 1962
REEVE, E. C. R., 1955
ROBERTSON, A., 1960 WRIGHT, S., 1931
307-320.
The progress of inbreeding when homozygotes are at a disadvantage. Heredity 7: 165-183.
Random genetic drift in multiallelic locus. Evolution 9: 419-435. 1957 Some problems of stochastic processes in genetics. Ann. Math. Statist. 28: 882-901.
The evaluation of eigen values arising in a problem in genetics. Proc.
Inbreeding with homozygotes at a disadvantage. Ann. Human. Genet.
A theory of limits in artificial selection. Proc. Roy. Soc. B. 153: 234-249.
The distribution of gene frequencies in populations. Proc. Natl. Acad. Sci. U.S. 23:
Experimental studies of the distribution of gene frequencies Cambridge Phil. Soc. ( I n press.)
(London) 21: 277-288.
Evolution in Mendelian populations. Genetics 16: 97-159. 1937
WRIGHT, S., and W. E. KERR, 1954