Breast Cancer: Targets and Therapy
Population-based service mammography
screening: the Icelandic experience
Kristjan Sigurdsson1,3
Elínborg Jóna Ólafsdóttir2
1The Icelandic Cancer Detection
Clinic, 2The Icelandic Cancer
Registry, Icelandic Cancer Society, 3Faculty of Medicine,
University of Iceland, Reykjavik, Iceland
Correspondence: Kristjan Sigurdsson The Icelandic Cancer Detection Clinic, Icelandic Cancer Society, Skógarhlíd 8, 105 Reykjavík, Iceland
Tel +354 540 1900 Fax +354 540 1920 Email [email protected]
Objective: This study analyzes the efficacy of the Icelandic population-based service
mam-mography screening.
Material and methods: Women aged 40–69 were invited for screening at 2-year intervals
starting in November 1987. The study evaluates: (A) attendance and other screened performance parameters during 1998–2010; (B) trends in age-standardized and age-specific incidence rates during 1969–2010 and mortality rates during 1969–2010; and (C) distribution of risk factors and disease specific death rates according to mode of detection.
Results: (A) In the age group of 40–69, the average 2-year attendance was 62%, recall rate
was 4.1%, needle biopsy rate was 1.3%, surgery rate was 0.6%, invasive cancer rate was 0.4%, and ductal carcinoma in situ (DCIS) rate was 0.06%. (B) The linear incidence trend after the start of screening decreased significantly in the age group 40–49, increased significantly in the age group 50–69, but decreased non-significantly in the age group 70–79. The decreased specific incidence in the 70–79 age group was, however, greater than the increased age-specific incidence at the ages 50–69. The mortality rate decreased 41% for all age groups and the linear mortality trend decreased significantly at ages 40–49, 50–69, and 70–79. In the age group 40–74 years, the age-specific mortality decreased by 6.9 cases per 2000 during a 10-year period. (C) Screen-detected women had significantly smaller tumors, more favorable tumor grade, fewer axillary metastases and, after correction for other risk factors, the likelihood of dying from cancer decreased 54% (hazard ratio: 0.46; 95% confidence interval: 0.31–0.69) for these patients compared to cases of nonparticipators.
Conclusion: The study results confirm acceptable rates of recalls and referrals for further
diagnosis and treatment, and significantly decreased breast cancer mortality rate after starting screening.
Keywords: mammography, screening, breast cancer, mortality, incidence, mode of detection,
risk factors
Introduction
Breast cancer is the most common cancer in women worldwide. The ultimate goal of screening is to reduce the mortality of the disease without affecting the quality of life of the attending women. The results of the first randomized efficacy trials1 have been
questioned in studies reporting that screening leads to over-diagnosis of small slow growing or wrongly diagnosed cancers leading to lead and length time biases, and over-treatment due to false diagnoses of suspicious benign changes.2–6 Other reports state,
however, that the key factors necessary to realize the aim of screening are achieved using a high quality screening process.7
Dove
press
O R I g I n A L R E S E A R C h
open access to scientific and medical research
Open Access Full Text Article
Breast Cancer: Targets and Therapy downloaded from https://www.dovepress.com/ by 118.70.13.36 on 20-Aug-2020
For personal use only.
Number of times this article has been viewed
This article was published in the following Dove Press journal: Breast Cancer: Targets and Therapy
In Iceland, population-based service mammography screening started in November 1987. The aim of this study was to evaluate the efficacy of the screening program by analyzing the following data longitudinally: (A) the performance parameters of screening as quality assurance of the screening program; (B) the observed incidence and mortality rates of invasive breast cancer before and after starting screening; and (C) the disease specific death rates and distribution of risk factors according to mode of breast cancer detection after the start of screening.
Material
The Icelandic screening program
For cost-effectiveness, the mammography screening is organized jointly with cervical cancer screening. According to the results of the Swedish mammography trials,1 the intention is to invite all
women aged 40–69 (33,395 women in 1988 and 54,714 in 2010) to screening at 2-year intervals (one screening round). Women older than 69 are allowed to attend at 2-year intervals without invitation but are not part of the screening program.8
All mammograms in Iceland are read at the Cancer Detection Clinic (CDC) in Reykjavik. Women with an abnormal screening mammography are recalled for further workup with additional views, ultrasound examination, and needle biopsies (fine needle or core biopsies) before deciding whether to refer the women for an open biopsy, wedge resection, or a mastectomy.
All data included in this study came from official population registries, screening results after 1987 from the database of the CDC, breast cancer incidence (1969–2010) from the Icelandic Cancer Registry, and breast mortality (1969–2010) from Statistics Iceland. The Cox multivariate analysis covers the period 1988–2009.
Methods
The intention to run the program as 2-year screening rounds is affected by the following screening program decisions: (1) The invitation process takes into account the timing of the last mammography regardless of whether it was a screening mammogram or a clinical mammogram taken outside the screening program. The timing of the next screening invitation is calculated from the date of the last mammography. Clinical mammography outside the screening program can thus prolong the timing between formal invitations for screening; (2) Due to the fact that mammography screening is a combined service screening for both cervical and breast cancer, the women are allowed to attend screening from 18–23 months after the last mammography. Attendance in the 18–23 month period,
however, is classified as screening attendance only if the women attend without symptoms.
Cases are defined according to the mode of detection. Screen-detected cases are the result of screening attendance at ages 40–69 among (a) women attending screening up to 3 months after formal invitation regardless of whether they have symptoms or not, (b) women attending without clinical symptoms 18–23 months after the last mammography, and (c) women diagnosed as a result of early recalls due to followup of abnormal screening results. Interval cases are diagnosed as a result of attendance within 24 months after the last normal screening mammography with the exception of women attend-ing without symptoms between 18–23 months. Cases among noncompliants (referred to as refuser cases) are defined as cases diagnosed among women that have not attended screen-ing durscreen-ing a 26 month period after the last normal screenscreen-ing mammography. Cases outside the screening program are cases of patients younger than 40 or are 70 years of age or older.
Performance parameters of screening
Attendance rate
The 2-year attendance rate is defined as the proportion of 40–69 year old women that by the end of each year had a mammography taken during the previous 24 months. The average 2-year attendance rates are defined as the average of all the 2-year attendance rates between 1988–2010 for the following age groups: 40–49, 50–69, and 40–69. To evaluate irregular attendance, the 4-year attendance rate and the proportion of women that at the end of each year had never had a mammography were analyzed separately after 1998 for the 40–69 year old women.
Recalls and referrals
Recalls and referrals refers to the number of recalls after an abnormal screening mammography and the number of referrals for needle biopsies and surgery (including surgical biopsies) after recalls.
Cancer and DCIS
Cancer and ductal carcinoma in situ (DCIS) refers to the number of screen-detected invasive cancers and DCIS.
Breast cancer incidence and mortality
(DCIS excluded)
All age groups
Age-world-standardized incidence rates per 100,000 are population-based and calculated per year in 1969–2010 and with 5-year smoothing (moving average) rates. Linear trend lines were based on individual years calculated for two
Dovepress
Sigurdsson and Ólafsdóttir
Breast Cancer: Targets and Therapy downloaded from https://www.dovepress.com/ by 118.70.13.36 on 20-Aug-2020
equal time periods before and after the first two screening rounds (1969–1987 and 1992–2010). The prevalence period (1988–1991), including a high rate of prevalent cases diagnosed before the start of screening, was excluded from the incidence trend analysis.3,4 The prescreening trend
line (1969–1987) was extrapolated to 2010 and the rate difference between the observed trend line (1992–2010) and the extrapolated trend line was calculated.
The world-standardized mortality rates were calculated for individual years between 1969–2010 and with 5-year moving average rates. Due to the delayed effect of screen-ing on the mortality rate, the prescreenscreen-ing trend line was calculated to the end of the 5-year period with the highest mortality rate (1991–1995) and then extended to 2010 to calculate the expected mortality value. A new trend line was calculated for the observed values between 1996–2010 and the rate difference between the observed and expected rates was calculated.
Age-specific rates
The age-specif ic incidence and mortality rates are population-based and were calculated per 100,000 women for the age groups 40–49, 50–69, and 70–79 in 1969–2010 using the same approach as for all ages to evaluate the effect of screening on these rates. Trend lines for age-specific rates are based on 5-year moving average rates. The rates of cancer deaths were calculated during the period with the highest mortality rate at the start of screening and at the end of the study period. The difference between these rates was calculated per 100,000 for the age group 40–74.
Mode of detection, risk factors,
and disease specific death
The disease specific mortality and distribution of year of diagnosis, year of birth, tumor size, axillary metastases, tumor grade, and receptor tumor status were analyzed for cases diagnosed after start of screening according to mode of detection (screen-detected, interval, and refuser cases) with followup to the end of 2009. The effect of detection modes and risk factors on the likelihood of dying from breast cancer was evaluated by univariate and Cox multivariate analysis.
Statistics
Incidence and mortality were calculated using Microsoft Excel 2010 (Microsoft Corporation, Redmond, WA, USA). Regression coefficients (RC) and 95% confidence intervals (CI) were calculated with MedCalc version 11.3.1.0 (MedCalc
Software, Mariakerke, Belgium). Stata 10.0 (StataCorp LP, College Station, TX, USA) for Windows was used for Cox analysis (Hazard Ratio [HR] and 95% CI), comparison of means (Student’s t-test) and proportions (Chi-square).
Results
Performance parameters
Attendance
In the overall age group (40–69) the average 2-year attendance was 62% in 1988–2010. In the age group 40–49 the average 2-year attendance decreased from 68% in the prevalence period to 64% in the incidence period 1992–1997 and 59% after 1997. In the age group 50–69 the average 2-year attendance was around 64% from the start of screening. The average 4-year attendance and non-attendance rates in the age group 40–69 after 1998 were 74% and 15%, respectively.
Recalls and referrals
Table 1 shows the average number of participants per 2-year screening round in 1998–2010. At age 40–49, the rate of recalls was 4.7%, and at age 50–69 it was 3.6%. The referral rate for needle biopsy was 1.3% in both age groups. After needle biopsy, the referral rate for surgery was 0.5% at age 40–49 and 0.7% at age 50–69. The proportion of recalls referred for needle biopsy was 26.7% and 35.8% for the aforementioned age groups, respectively, and the proportion of recalls referred for surgery was 11.2% and 20.5%, respectively.
Breast cancer and DCIS
The rate of invasive cancer was 0.2% at age 40–49 and 0.5% at age 50–69. The proportion of cases with #10 mm tumors was 31.8% versus 28.2% and #15 mm tumors 50.0% versus 55.3%, respectively, for the aforementioned age groups. The rate of DCIS was 0.05% and 0.07%, respectively, for the aforementioned age groups. The positive predictive value (PPV) for cancer plus DCIS after recalls was 4.9% and 16.0%, respectively, and the PPV after surgery was 43.8% and 78.2%, respectively. The number of surgeries (including surgical biopsies) per cancer plus DCIS was 2.3 versus 1.3, respectively. The benign to malignant biopsy ratio was 1.3% and 0.3%, for the 40–49 and 50–69 age groups, respectively (Table 1).
Breast cancer incidence and mortality
(DCIS excluded)
All age groups
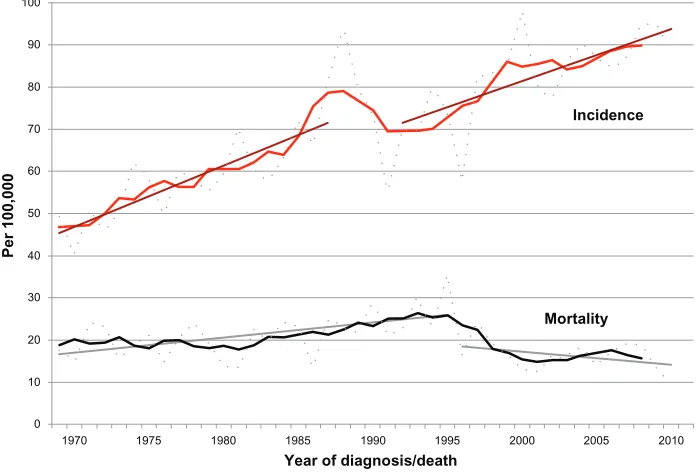
Figure 1 shows the age-standardized (world) incidence and mortality rates per 100,000 for individual years, 5-year moving average rates in 1969–2010, and linear trends.
Dovepress Service mammography screening in Iceland
Breast Cancer: Targets and Therapy downloaded from https://www.dovepress.com/ by 118.70.13.36 on 20-Aug-2020
The incidence increased steadily from 47.3/100,000 in 1969–1973 to 89.8/100,000 in 2006–2010. The incidence increased from 63.9 before screening in 1982–1986 to 75.6 during the prevalence period 1988–1991 (P , 0.001) and decreased thereafter (P= 0.61) to 70.0 in 1992–1996. The extrapolated linear trend from 1969–1987 to 2010 confirms an increased observed incidence during the prevalence period of 1988–1991, but thereafter a lower rate than expected. The rate difference between
the observed and the expected trends in 2010 (93.7/100.000 versus 104.8/100.000) was non-significant (P= 0.31).
The average mortality rate was 19.1/100,000 in 1969–1986, increased to 26.3/100,000 in 1991–1995, and decreased thereafter to 15.5/100,000 in 2001–2010 (41% decrease from 1991–1995 to 2001–2010; P , 0.001). About 63% of the mortality rate in 1988–1995 (51% in 1991–1995) was due to cases diagnosed before the start
Table 1 Mammography screening in Iceland
Screening outcomes per average 2-year screening round in 1998–2010
Age 40–49 Age 50–69 Age 40–69
N % N % N %
Population 20,725 27,605 48,330
Participants 12,138 58.6 16,836 61.0 28,974 60.0
Recalls 572 4.7 606 3.6 1,178 4.1
needle biopsies 153 1.3 217 1.3 370 1.3
Surgery (including surgical biopsies) 64 0.5 124 0.7 188 0.6
Invasive cancer 22 0.2 85 0.5 107 0.4
#10 mm cancer of invasive cancer 7/22 31.8 24/85 28.2 31/107 29.0
#15 mm cancer of invasive cancer 11/22 50.0 47/85 55.3 58/107 54.2
DCIS 6 ,0.1 11 ,0.1 17 ,0.1
Total cancer (invasive and DCIS) 28 0.2 97 0.6 125 0.4
Referral rate of recalls for needle biopsy 153/572 26.7 217/606 35.8 370/1,178 31.4
Referral rate of recalls for surgery 64/572 11.2 124/606 20.5 188/1,178 16.0
Total cancer-PPV of recalls 28/572 4.9 97/606 16.0 125/1,178 10.6
Total cancer-PPV of surgery 28/64 43.8 97/124 78.2 125/188 66.5
number of surgeries per total cancer 64/28 2.3* 124/97 1.3* 188/125 1.5*
Benign to malignant biopsy ratio 36/28 1.3* 27/97 0.3* 63/125 0.5*
Notes: Performance parameters in 1998–2010. Average numbers (n) of women to be screened per 2-year screening round, participants, recalls, referrals for needle biopsy
and surgery (including surgical biopsies), cancer and DCIS detected. Average referral rates and positive predictive values. *Proportions.
Abbreviations: DCIS, ductal carcinoma in situ; PPV, positive predictive value.
100
90
80
70
60
50
40
30
20
10
0
2010 2005
Mortality Incidence
2000 1995
1990
Year of diagnosis/death
Per 100,000
1985 1980
1975 1970
Figure 1 Invasivebreast cancer in Iceland.
Notes: Allages 1969–2010, age-world-standardized incidence, and mortality rates per 100,000 per year, with 5-year moving average rates. Linear regression lines for incidence in 1969–1987 and 1992–2010 and for mortality in 1969–1995 and from that point to 2010.
Dovepress
Sigurdsson and Ólafsdóttir
Breast Cancer: Targets and Therapy downloaded from https://www.dovepress.com/ by 118.70.13.36 on 20-Aug-2020
of screening but this proportion decreased to 26% in 1996–2010 (17% in 2006–2010). A linear trend line from 1969 to 1995 was extrapolated to 2010. The rate difference between the observed and the expected trends in 2010 was significant (P= 0.001), corresponding to a 55% decreased rate (31.3/100,000 versus 14.1/100,000).
Age-specific rates
Figure 2A–C shows the 5-year moving age-specific incidence and mortality rates and linear trends for the age groups 40–49, 50–69, and 70–79 in 1969–2010. The linear incidence trends are for the periods 1969–1987 and 1992–2010 and the mortal-ity trends for the periods 1969–1995 to 1996–2010.
The incidence increased in all age groups before the start of screening, reached a peak during the prevalence period but decreased again during the incidence period after the start of screening. For the 40–49 age group (Figure 2A) the RC for the linear trend in 1969–1987 was 4.10 (95% CI: 3.05–5.16), but was significantly lower (P , 0.01) during 1992–2010 or −0.07 (95% CI: −1.18–1.31). For the 50–69 age group (Figure 2B) the RC increased significantly (P , 0.01) from 2.66 (95% CI: 1.91–3.40) to 5.68 (95% CI: 4.00–7.37) between the two periods. For the 70–79 age group (Figure 2C) the RC decreased non-significantly from 7.32 (95% CI: 5.35–9.29) to 5.02 (95% CI: 3.03–7.00) but the rate difference between the extrapolated linear incidence trend in 1969–1986 and the observed trend in 2006–2010 (436.0/100,000 versus 315.7/100,000), however, was significant (P= 0.004).
The rate differences in 2006–2010 between the extrapolated linear incidence trend in 1969–1986 and the observed trend in 1992–2010 in the 50–69 age groups was 94.4/100,000 (245.6/100,000 versus 339.0/100,000; P, 0.001). In the 70–79 age group, the rate difference was 120.3/100.000 (436.0/100,000 versus 315.7/100,000; P= 0.005).
The age-specific mortality rates started to increase after 1981–1985, reaching a peak value around 1995 in all age groups. In the 40–49 age group (Figure 2A), the RC decreased significantly from 0.64 (0.33–0.95) to −0.91 (−1.45 to −0.37) and also in the 50–69 age group (Figure 2B) from 1.07 (0.59–1.56) to −2.66 (−3.96 to −1.37). At age of 70–79 (Figure 2C), the RC decreased significantly from 1.74 (1.19–2.30) to −1.86 (−4.70 to −0.97).
For the 40–74 age group the age-specific mortality was 75.8/100,000/year in 1991–1995 and this decreased to 41.4/100,000/year in 2001–2010, or the equivalent of 34.4 women/100,000/year or 6.9 women per 2000 during a 10-year period.
Mortality Incidence
Year of diagnosis/death
A 200 150 100 50 0 Per 100,000 1969–197 3 1971–197 5 1974–197 8 1977–198 1 1980–198 4 1983–198 7 1986–199 0 1989–199 3
1992–1996 1995–1999 1998–2002 2001–2005 2004–2008 2006–2010
Year of diagnosis/death
400 Incidence Mortality B 300 350 200 150 100 250 50 0 Per 100,000 1969–1973 1971–197 5 1974–1978 1977–198 1 1980–198 4 1983–198 7 1986–199 0 1989–199 3 1992–199 6 1995–199 9 1998–200 2 2001–200 5 2004–200 8 2006–201 0 400 C 350 300 250 200 150 100 50 0 1969–197 3 1971–197 5 1974–197 8 1977–198 1 1980–198 4 1983–198 7 1986–199 0 1989–199 3 1992–199 6 1995–199 9 1998–200 2 2001–200 5 2004–200 8 2006–201 0
Year of diagnosis/death
Mortality Incidence
Per 100,000
Figure 2 Invasivebreast cancer in Iceland. (A) Age-specific incidence and mortality rates per 100,000 at age 40–49, with 5-year moving average rates. Linear regression lines for the incidence trends between 1969–1987 and 1992–2010 and for the mortality trends between 1969–1995 and from that point to 2010 in the respective age groups. (B) Age-specific incidence and mortality rates per 100,000 at age 50–69 with 5-year moving average rates. Linear regression lines for the incidence trends between 1969–1987 and 1992–2010 and for the mortality trends between 1969–1995 and from that point to 2010 in the respective age groups. (C) Age-specific incidence and mortality rates per 100,000 at age 70–79 with 5-year moving average rates.
Notes: Linearregression lines for the incidence trends between 1969–1987 and 1992–2010 and for the mortality trends in 1969–1995 and from that point to 2010 in the respective age groups.
Mode of detection, risk factors, and disease specific death
Compared to both interval and refuser cases, the screen-detected cases had a significantly (P, 0.001) lower rate of disease spe-cific cancer deaths, smaller tumors, fewer axillary metastases,
Dovepress Service mammography screening in Iceland
Breast Cancer: Targets and Therapy downloaded from https://www.dovepress.com/ by 118.70.13.36 on 20-Aug-2020
more favorable tumor grading, and receptor positive tumors (Table 2). Compared to the refuser cases, the interval cases had a significantly (P, 0.001) lower rate of disease specific cancer deaths and a higher rate of small tumors, but the distribution of other risk factors did not differ significantly.
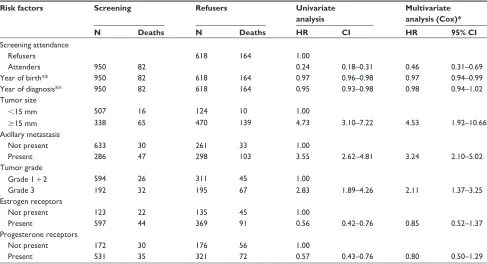
The univariate analysis comparing the screen-detected cases and refusers confirmed that all the factors had a significant effect on the likelihood of dying from breast cancer (Table 3). For the screen-detected women, mortality decreased 76%, and it was 3% lower for each later year of birth, and 5% lower for each later year of diagnosis, and about 44% greater protection if positive for hormone recep-tors. Mortality increased, however, 2.83 times for grade 3 compared with grades 1 and 2, 3.55 times for axillary metastasis, and 4.73 times for tumors with a diameter greater than 14 mm.
The multivariate analysis (Table 3) included women for whom information was available regarding all the risk factors (556 screening cases, 317 interval cases, and 365 refuser cases). The analyses confirmed that screen-detected cases had a significant 54% (HR 0.46; 95% CI: 0.31–0.69) lower
likelihood of dying from cancer compared to cases among refusers. The same comparison for the interval cases versus refusers was non-significant or 21% (HR 0.79; 95% CI: 0.53–1.16; data not shown). The highest hazard ratios among the screen-detected versus refuser cases were for tumor size 4.53 (95% CI: 1.92–10.66), followed by axillary metastasis 3.24 (95% CI: 2.10–5.02) and 2.11 (95% CI: 1.37–3.25) for tumor grading. No interaction was found between grade, size, and metastasis.
Discussion
The effect of mammography screening has been disputed9
ever since the Swedish randomized trials confirmed a 29% decreased mortality rate in the invited group in 1993.1
The Cochrane Collaboration reported in 2008 that screening reduced the mortality rate by 15%, led to over-treatment in 10% of screened women due to false diagnosis of suspect changes, and to over-diagnosis in 0.5% of screened women due to false diagnosis of breast cancer.2,3,10
The US Preventive Services Task Force (USPSTF) updated in 2009 earlier recommendations from 2002 and concluded that
Table 2 Distribution of risk factors and disease specific death rates according to mode of cancer detection 1988–2009
Screening cases(N = 954)
Interval cases(N = 568)
Refuser cases(N = 624)
P-values* Sc versus Int
Sc versus Ref
Int versus Ref
Disease specific death (%) 9% 17% 26% ,0.001 ,0.001 ,0.001
Follow-up time in years (mean) 8.6 (0.0–21.8) 7.2 (0.0–21.1) 6.8 (0.0–21.8) ,0.001 ,0.001 0.197 Year of birth (mean) 1942 (1919–1969) 1947 (1919–1966) 1944 (1919–1969) ,0.001 0.019 ,0.001 Year of diagnosis (mean) 2000 (1988–2009) 2001 (1988–2009) 1999 (1988–2009) 0.006 0.406 ,0.001 Age at diagnosis (mean) 57 (40–69) 54 (40–69) 55 (40–69) ,0.001 ,0.001 ,0.001 Tumor size (mm) mean 16.4 (1–120) 23.5 (1–100) 28.0 (1–150) ,0.001 ,0.001 ,0.001
Missing (n) 9 12 30
Axillary metastatis
No (%) 69% 52% 47% ,0.001 ,0.001 0.076
Yes (%) 31% 48% 53%
Missing (n) 34 33 64
Tumor grade
Grade 1 (%) 33% 16% 16% ,0.001 ,0.001 0.99
Grade 2 (%) 43% 45% 45%
Grade 3 (%) 25% 39% 39%
Missing (n) 167 145 117
Estrogen receptors
ER pos (%) 83% 68% 73% ,0.001 ,0.001 0.092
ER neg (%) 17% 32% 27%
Missing (n) 232 119 118
Progesterone receptors
PR pos (%) 75% 62% 65% ,0.001 ,0.001 0.451
PR neg (%) 25% 38% 35%
Missing (n) 249 124 125
Notes: *Chi-square test for proportion; t-test for mean.
Abbreviations: ER, estrogen receptor; Int, interval cases; n, number of cases; neg, negative; pos, positive; PR, progesterone receptor; Ref, refuser cases; Sc, screening cases.
Dovepress
Sigurdsson and Ólafsdóttir
Breast Cancer: Targets and Therapy downloaded from https://www.dovepress.com/ by 118.70.13.36 on 20-Aug-2020
screening at 2-year intervals is beneficial in the 50–74 age group with a 32% mortality reduction in the age group 60–69 and 15% in the 50–59 age group. Despite a 14% mortality reduction in the 40–49 age group, however, the Task Force recommended risk evaluation due to a risk of false diagnosis of suspected benign changes at that age.5,6,11 Some researchers
agree with these reports,12–16 but others have protested these
findings.17–23 Critics of the USPSTF report have pointed out
the poor quality of some of the included data and the fact that 80% of breast cancers occur in women with no family history of the disease.24–26
The present study shows that the average yearly registered non-attendance rate in the targeted Icelandic 40–69 year-old population has never been higher than 14% at the same time as the average 2-year attendance rate has been around 62% and the 4-year rate around 70%, which confirms that women attend screening at irregular intervals. The performance parameters also confirm that the rate of recalls, detection rate of cancers and DCIS, and the benign to malignant biopsy ratio in the targeted age group comply with the quality standards of the European radiological guidelines.7 Although
the rate of recalls was higher in the 40–49 age group, the referral rates for needle biopsy and surgery are lower in this younger age group. The higher rate of surgeries per total
cancer cases in the younger age group can be explained by the lower age-specific breast cancer incidence among the younger women.
The Cochrane Collaboration concluded that screening leads to over-diagnosis of cancers in 0.5% of the screened women and that one out of every three cancers diagnosed at screening is a slow growing cancer.2,3 The present study,
which was based on methods similar to those used by the Cochrane Collaboration,3 confirmed an increasing linear
trend in the incidence rate in the 40–49 age group before the start of screening and a significantly lower linear trend for the incidence after the start of screening. In the 50–69 age group, the linear incidence rate increased at a significantly higher rate after start of screening but at a non-significantly lower rate in the 70–79 age group. However, the rate differences between the expected and observed incidence rates in 2006–2010 decreased significantly in the 70–79 age group. These results support the theory that the increasing incidence in the 50–69 age group can partly be explained by earlier diagnosis, which then later leads to a reduced incidence rate in the 70–79 age group.
The current study confirmed a 41% decrease in the mortality rate for all ages combined after the start of screening, which is in agreement with the results of an
Table 3 The likelihood of dying from breast cancer
Risk factors Screening Refusers Univariate
analysis
Multivariate analysis (Cox)*
N Deaths N Deaths HR CI HR 95% CI
Screening attendance
Refusers 618 164 1.00
Attenders 950 82 0.24 0.18–0.31 0.46 0.31–0.69
Year of birth** 950 82 618 164 0.97 0.96–0.98 0.97 0.94–0.99
Year of diagnosis** 950 82 618 164 0.95 0.93–0.98 0.98 0.94–1.02
Tumor size
,15 mm 507 16 124 10 1.00
$15 mm 338 65 470 139 4.73 3.10–7.22 4.53 1.92–10.66
Axillary metastasis
not present 633 30 261 33 1.00
Present 286 47 298 103 3.55 2.62–4.81 3.24 2.10–5.02
Tumor grade
grade 1 + 2 594 26 311 45 1.00
grade 3 192 32 195 67 2.83 1.89–4.26 2.11 1.37–3.25
Estrogen receptors
not present 123 22 135 45 1.00
Present 597 44 369 91 0.56 0.42–0.76 0.85 0.52–1.37
Progesterone receptors
not present 172 30 176 56 1.00
Present 531 35 321 72 0.57 0.43–0.76 0.80 0.50–1.29
Notes: Women diagnosed with breast cancer at age 40–69 in 1988–2009 after start of mammography screening. Results of Cox regression: HR and 95% CI for known risk factors. n: number of women with information on risk factors in the Cancer Registry. Interval cases were excluded from this analysis. *Cases with information on all variables (556 screening cases and 365 refuser cases); **continuous variables.
Abbreviations: CI, confidence interval; HR, hazard ratio; N, number.
Dovepress Service mammography screening in Iceland
Breast Cancer: Targets and Therapy downloaded from https://www.dovepress.com/ by 118.70.13.36 on 20-Aug-2020
earlier Icelandic case-control study8 and the lag from
start of screening to the mortality reduction is also in line with other studies.1,9 The linear mortality rates decreased
significantly after start of screening in the 40–49, 50–69, and 70–79 age groups, which is in line with the results of the multivariate analysis showing for the screen-detected cases a 54% decreased likelihood of dying from breast cancer after correcting for other risk factors.
The present study confirms that in spite of the low average 2-year attendance at age 40–69 (62%) the number of breast cancer deaths in the 40–74 age group was reduced by about 6.9 per 2000 women during 10 years. Reports on the number of cancer cases prevented by screening have varied. The Cochrane Collaboration concluded that screening prevented one breast cancer death per 2000 women screened (0.05%) during 10 years2 and USPTFS concluded that the decrease
was 2.7 deaths per 2000 women screened at age 40–69.5,6 A
recent review of the Swedish Two-County Trial21 concluded
that the decrease was 3 deaths per 1000 women screened at age 40–74, which corresponds to the results of the present study.
Other studies have reported that disparities in breast cancer mortality in Western countries can be due to treatment improvements27–29 and decreased use of postmenopausal
hormones.30 The present study results were not corrected with
changes in treatment and use of postmenopausal hormones as this information was not available in the current database. The survival among cases diagnosed before and after the year 2000 was, however, analyzed according to the mode of detection and corrected for the effect of risk factors (data not shown). These results confirmed that survival was non-significantly different for screen-detected cases (P= 0.81) and refuser cases (P= 0.45) diagnosed before and after the year 2000, which does not support the conclusion that changes in treatment and use of postmenopausal hormones have played an important role in the observed decreased disease specific mortality after 1995.
Finally, although the strength of this study is that it is population based on a 22-year screening period, it is, however, affected by the following limiting factors: the multivariate analyses have not been corrected for theoretical biases, such as selection bias, a decision based on other study results showing that adjustment for theoretical biases has a limited effect on estimates obtained from other mammography trials;8,23
the multivariate analyses are affected by lead time bias31
due to advanced diagnosis of aggressive disease; and the mortality analyses after the start of screening are based on cases diagnosed before and after start of screening. The effect of these factors should be minimized, however, by the long
screening period analyzed separately for the periods before and after the year 2000 and the fact that the mortality analyses take into account the lag time from start of screening to the mortality reduction.
Conclusion
The study results indicate that mammography screening is an effective approach to lower the mortality rate of breast cancer with acceptable rates of recalls and referrals for further diagnosis and treatment.
Acknowledgments
This work has been enabled by the technical assistance of many co-workers at the Icelandic Cancer Detection Clinic and the Icelandic Cancer Registry.
Disclosure
The authors report no conflicts of interest on this work.
References
1. Nyström L, Rutqvist LE, Wall S, et al. Breast cancer screening with
mammography: overview of Swedish randomised trials. Lancet. 1993;
341(8851):973–978.
2. The Cochrane Collaboration. Screening for Breast Cancer with
Mam-mography. Copenhagen: The Cochrane Collaboration; 2008. Available from: http://www.cochrane.dk/screening/index-en.htm. Accessed April 7, 2013.
3. Jörgensen KJ, Götzsche. Overdiagnosis in publicly organised mam-mography screening programmes: systemic review of incidence trends.
BMJ. 2009;339:b2587.
4. Welch HG, Black WC. Overdiagnosis in cancer. J Natl Cancer Inst.
2010;102(9):605–613.
5. US Preventive Services Task Force. Screening for breast cancer: US
Preventive Services Task Force recommendation statement. Ann Intern
Med. 2009;151(10):716–726.
6. Nelson HD, Tyne K, Naik A, Bougatsos C, Chan BK, Humphrey L; US Preventive Services Task Force. Screening for breast cancer: an
update for the US Preventive Services Task Force. Ann Intern Med.
2009;151(10):727–737.
7. Rosselli del Turco M, Hendriks J, Perry N, Azavedo E, Skaane P.
Radiological guidelines. In: European Guidelines for Quality
Assur-ance in Breast CAssur-ancer Screening and Diagnosis, 4th ed. Luxemburg: Office for Official Publications of the European Communities; 2006. Available from: http://ec.europa.eu/health/archive/ph_projects/2002/ cancer/fp_cancer_2002_ext_guid_01.pdf. Accessed on April 7, 2013. 8. Gabe R, Tryggvadóttir L, Sigfússon BF, Ólafsdóttir GH, Sigurdsson K,
Duffy SW. A case-control study to estimate the impact of the Icelandic population-based mammography screening program on breast cancer
death. Acta Radiol. 2007;9:948–955.
9. Skaane P. Controversies in mammography screening: let us not
ignore science in this never-ending debate. Acta Radiol. 2011;52(10):
1061–1063.
10. Gøtzsche PC, Jørgensen KJ, Mæhlen J, Zahl P-H. Estimation of lead time
and overdiagnosis in breast cancer screening. BJC. 2009;100(1):219.
11. Humphrey LL, Helfand M, Chan BK, Woolf SH. Breast cancer screening: a summary of the evidence for US Preventive Services Task
Force. Ann Intern Med. 2002;137(5 Part 1):347–360.
12. Quanstrum KH, Hayward RA. Lessons from the mammography wars.
N Engl J Med. 2010;363(11):1076–1079.
Dovepress
Sigurdsson and Ólafsdóttir
Breast Cancer: Targets and Therapy downloaded from https://www.dovepress.com/ by 118.70.13.36 on 20-Aug-2020
Breast Cancer: Targets and Therapy
Publish your work in this journal
Submit your manuscript here: http://www.dovepress.com/breast-cancer---targets-and-therapy-journal
Breast Cancer: Targets and Therapy is an international, peer- reviewed open access journal focusing on breast cancer research, identification of therapeutic targets and the optimal use of preven-tative and integrated treatment interventions to achieve improved outcomes, enhanced survival and quality of life for the cancer patient.
View the full aims and scopes of this journal here. The manuscript management system is completely online and includes a very quick and fair peer-review system, which is all easy to use. Visit http:// www.dovepress.com/testimonials.php to read real quotes from published authors.
13. Welch HG. Screening mammography – a long run for a short slide?
N Engl J Med. 2010;363(13):1276–1278.
14. Keen JD. Promoting screening mammography: insight or uptake? J Am
Board Fam Med. 2010;23(6):775–782.
15. Jørgensen KJ, Zahl P-H, Gøtzsche PC. Breast cancer mortality in organised mammography screening in Denmark: comparative study.
BMJ. 2010;340:c1241.
16. Bleyer A, Welch GH. Effect of three decades of screening mammography
on breast-cancer incidence. N Engl J Med. 2012;367(21):1998–2005.
17. Boyle P. Mammographic breast cancer screening: after the dust has settled. Breast. 2003;12(6):351–356.
18. Hendrick RE, Helvie MA. United States Preventive Services Task Force
screening mammography recommendations: science ignored. AJR Am
J Roentgenol. 2011;196(2):W112–W116.
19. Kopans DB. The 2009 US Preventive Service Task Force (USPSTF) guidelines are not supported by science: the scientific support for
mammography screening. Radiol Clin North Am. 2010;48(5):843–857.
20. Hellquist BN, Duffy SW, Abdsaleh S, et al. Effectiveness of population-based service screening with mammography for women ages 40 to 49 years: evaluation of the Swedish Mammography Screening in Young
Women (SCRY) cohort. Cancer. 2011;117(4):714–722.
21. Tabár L, Vitak B, Chen TH, et al. Swedish two-county trial: impact of mammographic screening on breast cancer mortality during 3 decades.
Radiology. 2011;260(3):658–663.
22. Paci E; EUROSCREEN Working Group. Summary of the evidence of breast cancer service screening outcomes in Europe and first
estimate of the benefit and harm balance sheet. J Med Screen. 2012;
19 Suppl 1:5–13.
23. Nickson C, Mason KE, English DR, Kavanagh AM. Mammographic screening and breast cancer mortality: a case-control study and
meta-analysis. Cancer Epidemiol Biomarkers Prev. 2012;21(9):
1479–1488.
24. Kopans DB, Feig SA. The Canadian National Breast Screening Study:
a critical review. AJR Am J Roentgenol. 1993;161(4):755–760.
25. Smith AR. Risk-based screening for breast cancer: is there a practical
strategy? Semin Breast Dis. 1999;2:280–291.
26. Tulinius H, Olafsdottir GH, Sigvaldason H, Tryggvadottir L, Bjarnadottir K. Neoplastic diseases in families of breast cancer patients. J Med Genet. 1994;31(8):618–621.
27. Autier P, Boniol M, Gavin A, Vatten LJ. Breast cancer mortality in neighbouring European countries with mortality different levels of screening but similar access to treatment: trends analysis of WHO
mortality database. BMJ. 2011;343:d4411.
28. Autier P, Boniol M, La Vecchia C, et al. Disparities in breast cancer mortality trends between 30 European countries: retrospective trend
analysis of WHO mortality database. BMJ. 2010;341:c3620.
29. Kalager M, Zelen M, Langmark F, Adami HO. Effect of screening
mammography on breast-cancer mortality in Norway. N Engl J Med.
2010;363(13):1203–1210.
30. Beral V; Million Women Study Collaborators: Breast cancer and
hormone-replacement therapy in the Million Women Study. The Lancet.
2003;362(9382):419–427.
31. Gates TJ. Screening for cancer: evaluating the evidence. Am Fam Physician. 2001;63(3):513–522.
Dovepress
Dove
press
Service mammography screening in Iceland
Breast Cancer: Targets and Therapy downloaded from https://www.dovepress.com/ by 118.70.13.36 on 20-Aug-2020