JOURNIU OF
MNGE MNVGEMENl=
Publrshed brmonthlv-Januarv, March, Mav,July, September, November-by the Society for Range Management 2760 West Fifth Avenue Denver, Colorado 80204 Copyright 1979 by the !&iet~ for Range Management Managing Editor
DAVID A. SMITH 2760 West Frfth Avenue Denver, Cola. 80204 Editor
REX D. PIEPER
TABLE OF CONTENTS: Vol. 32, No. 1, January 1979
ARTICLES 4
8
12
Botanical Composition of Central Texas Rangeland Influences Quality of Winter Cow Diets by Jerry W. Stuth and Donald R. Kirby
Aerial Census of Wild Horses in Western Utah by Milton N. Frei, J. Scott Peterson, and J. Ron Hall
Occurrence of C:< and C1 Photosynthetic Pathways in North American Grasses by S.S. Wailer and J.K. Lewis
Dep. Animal and Range Scrence New Mexico State Univensty Las Cruces, N. Mex. 88003 Book Review Editor PAT 0. CURRIE
Rocky Mountain Forest and Range Experiment Station 240 West Prospect Street Fort Collins, Colo. 80521
29
33
38
Brush Control on Sandy Rangelands in Central Alberta by Arthur W. Bailey and Howard G. Anderson
Influence of Soil, Vegetation, and Grazing Management on Infiltration Rate and Sediment Production of Edwards Plateau Rangeland by W. Allan McGinty, Fred E. Smeins and Leo B. Merrill
Copy Editor PATRICIA G. SMITH
40 2760 West Fifth Avenue
Denver, Colo. 80204 46
Editorial Board 1976-78
RAYMOND EVANS, Reno, Nev. CLIFFORD E. LEWIS, Marianna, Fla. JOHN MALECHEK, Logan, Utah C. J. SCIFRES, College Station, Tex. 1977-79
JAMES 0. KLEMMEDSON, Tucson, Anz. GEORGE W. SCOTTER, Edmonton Alta. M. JOE TRLICA, Fort Collins, Colo.
48
52
55
60
Grazing System Identification by John R. Lacey and H. Walt Van Poollen
Forage Selection by Mule Deer on Winter Range Grazed by Sheep in Spring by Michael A. Smith, John C. Malechek, and Kenneth 0. Fulgham
The Western Harvester Ants: Their Density and Hill Size in Relation to Herbace- ous Productivity and Big Sagebrush Cover by Forrest A. Sneva
Survival of Alfalfa in Five Semiarid Range Seedings by M.D. Rumbaugh and M. W. Pedersen
Dry Matter Accumulation of Four Warm Season Grasses in the Nebraska
Sandhills by William L. Gilbert, L.J. Perry, Jr., and J. Stubbendieck
Evaluation of Fertilizer on Pronghorn Winter Range in Alberta by Morley W. Barrett
J. ROSS WIGHT, Logan, Utah 1978-80
DONALD A. KLEBENOW, Reno, Nev. JAMES T. NICHOLS, North Platte, Neb. MICHAEL D. PITT, Vancouver, B.C. RONALD E. SOSEBEE, Lubbock, Tex.
63
67
countries. Payment from outside the United States should be remitted in US dollars by International money order or draft on a New York bank.
INDIVIDUAL SUBSCRIPTION is by membership In the Socrety for Range Management.
LIBRARY or other INSTITUTIONAL SUBSCRIPTIONS, on a calendar year basis, are $22.00 postpaid to all
Carbohydrate Levels and Control of Blackjack Oak and Winged Elm Treated with Tebuthiuron and 2,4,5-T by J.P. Shroyer, J.F. Stritzke, and L.I. Croy
Response of Bouteloua eriopoda (Torr.) Torr. and Sporobolusflexuosus (Thrub.) Rybd. to Season of Defoliation by Richard F. Miller and Gary B. Donart
Soil Ingestion by Mule Deer in Northcentral Colorado by W. J. Arthur, III and A. W. Alldredge
Arrowleaf Balsamroot and Mules Ear Seed Germination by James A. Young and Raymond A. Evans
CHANGE OF ADDRESS notices should be sent to the Managing Editor, 2760 West Fifth Ave., Denver, CO 80204, no later than the first day of the month of issue. Copies lost due to a change of address cannot be replaced unless adequate notrce is given. To assure uninterrupted service, provide your local postmaster with a Change of Address Order (POD Form 3575), indicating thereon to guarantee forwarding postage for second class marl. POSTOFFICE: Please return entire journal with address change. BUSINESS CORRESPONDENCE, concerning subscnp- trons, advertisrng, reprints, back issues, and related mat- ters, should be addressed to the Managing Editor, 2760 West Fifth Ave., Denver, CO 80204.
TECHNICAL NOTES
75 A Simple, Lightweight Point Frame by Steven H. Sharrow and Dwight A. Tober
76 The Value of Fresh-stripped Topsoil as a Source of Useful Plants for Surface Mine Revegetation by Gene S. Howard and Marilyn J. Samuel
78 Cattle Grazing Impacts on Small Cleared Areas in Dense American Elm Wood- lands by James F. George and Jeff Powell
BOOK REVIEWS
80 Tmpical Pasture und Fodder Plunts-Grusses und Legumes by A. V. Bogdan 71
EDITORIAL CORRESPONDENCE, concerning manu- scripts or other editorial matters, should be addressed to the Edrtor, Dep. Animal and Range Sciences, New Mexico State Univ., Las Cruces 88003.
INSTRUCTIONS FOR AUTHORS appear each year In the March issue; copies of these instructions are available from the edttor.
Executive Secretary Vacancy Announcement
The position of Executive Secretary of the Society for Range Management will be vacant on March 1, 1979. The position description and search procedures will be finalized on February 14, 1979, during the annual meeting of the Society in Casper, Wyoming. A general description of the position follows:
The Society for Range Management is an organization incorporated under the laws of the State of Wyoming and governed by the “Articles of Incorporation” and the “Bylaws”. The Executive Secretary is the chief administrative officer of the Society and also serves as corporate secretary and treasurer.
The responsibilities of the Executive Secretary assigned in the Bylaws are:
Article IV. SECTION 6. The executive secretary shall be accountable to the Board of Directors, and under the general supervision of the president. He will be expected to attend all meetings of the Board of Directors and of the Society, and shall be responsible for a record of the business conducted at such meetings. He shall supervise the Society’s offices and its employees, maintain suitable membership records, reporting monthly to each Section the membership changes within that Section, conduct the correspondence of the Society, and keep full records of the same. The executive secretary shall also serve as treasurer and fiscal agent for the Society, collecting all dues payable to the Society and Sections, and all other monies due to the Society, depositing the same in the name of the Society, and making such expenditures as are authorized by an approved budget. He shall be responsible for maintaining suitable books of account, which shall be independently audited periodically as directed by the Board of Directors. prepare annual and interim financial reports for the Board of Directors, and be responsible for all financial or other reports required by law. The executive secretary also shall present an operational report of the Society at the annual meeting and perform such other duties as the Board may assign to him from time to time. He may be bonded in a suitable amount as decided by the Board of Directors and at the Society’s expense.
In addition to the responsibilities assigned in the Bylaws, the Executive Secretary shall supervise Society employees, and assist the Board of Directors, Editors, committees, and appointed representatives, thus serving as coordinating officer for Society affairs and exercising leadership for policies and programs approved by the Board of Directors.
The position is at the Society’s headquarters in Denver, Colorado. Salary will be commensurate with experience and qualifications. Initial contract will be for one year. Subsequent contracts may be for longer periods as negotiated with the Board of Directors.
The final position description and the procedures for nomination and application will be mailed to each Society member and others, including those who have inquired about the position, as soon after the Casper meeting as is practicable. All inquiries, nominations or applications should be sent to:
The
Dr. S. Clark Martin, Chairman of the Search Committee 2143 E. Mirlton Dr.
Tempe, Arizona 8.5282
ph: (602) 2614365 (602) 839-8837
approximate schedule for filling the position is: April 1, 1979-Deadline for nominations
Botanical
Composition
of Central Texas
Ranaeland Influences Quality of Winter Cow
-~DieG
-JERRY W. STUTH AND DONALD R. KIRBY
Abstract
Winter diets of dry, pregnant cows were investigated on a Blackland range site in mid- and high-poor condition. Under similar amounts of available forage, an advanced successional stage, i.e. change in species composition within a range condition class, resulted in increased dietary protein (CP), digestible organic matter (DOM) and phosphorus (P). A slightly larger abundance of cool-season grasses on the pasture in higher poor condition allowed the animals to select a diet adequate in CP, DOM and P approximately 3 weeks earlier in spring than on the mid-poor condition pasture.
The typical wintering program of Central Texas producers involves concentration of livestock in rangeland pastures that have good winter accessibility. Stocking pressure is high and the animals derive most of their required nutrients from hay, protein supplement, and free choice minerals. The result is a severely overgrazed and trampled pasture in poor range con- dition. The severity of this problem can be lessened with minor changes in successional status of the rangeland pasture.
The complex relationships between range condition and animal nutrition must be recognized by the range manager interested in animal production (Gates 1972). Range condition is defined as the current productivity of a range relative to what a particular range is naturally capable of producing (Kothmann
1974). Gates (1972) has noted that ambiguities can arise when using the term in reference to vegetation quality or quantity. Changes in ecological condition of rangelands represent changes in both species present and/or biomass produced. An increase in range condition generally represents an increase in quantity and/or quality of forage available to the grazing animals. Studies have shown that levels of biomass can mask the affect of species composition on dietary quality due to greater animal selectivity of plant parts (Goebel and Cook 1960; Cook et al. 1965; Kothmann 1968). However, Goebel and Cook ( 1960) found diets to vary between condition classes. Demarchi ( 1973) noted that poor condition sites tended to be higher in total protein, cellulose, and phosphorus.
Little information exists on quality differences as affected by successional status within a given condition class. Generally, when production values are similar between two areas, dietary
Authors are assistant professor and research technician, respectively, Texas Agricul- tural Experiment Station, Range Science Department, Texas A&M University System, College Station 77843.
This paper is published with approval of the director, Texas Agricultural Experiment Station, as TA-13922.
The authors wish to express appreciation to Mr. Samuel S. Pegues, Farms Manager, and other research personnel of the Texas Agricultural Experiment Station at McGregor, Texas, for their assistance and care of the tistulated cows used in this study.
Manuscript received January 13, 1978.
quality is dependent upon species composition. Therefore, intra-class range condition differences due to successional status of a given range site should have some impact on diet quality of animals. It was the purpose of this paper to determine the influence of changes in species composition on winter diets of cows grazing a summer-deferred, poor condition Blackland range site (U.S. Dep. Agr. 1976) in central Texas.
Study Area and Procedures
The study was conducted during the winter of 1976-1977 (Decem- ber 17 -April 1) on the Texas Agricultural Experiment Station Research Center at McGregor, Tex. Two, 44-hectare pastures with 4-hectare subdivisions in mid-poor and high-poor ecological condition were utilized as study sites. The soil series common to both pastures was a Houston black clay, which forms a Blackland range site (U.S. Dep. Agr. 1976). Average annual precipitation for the area is 83.9 cm (33 inches) (NOAA 1976). Peak rainfall occurs in May and Sep- tember. Winter precipitation for the study period averages 34 cm (13.4 inches). The station recorded 46 cm (18.1 inches) during the study period.
In its pristine condition, this range site supported a true prairie vegetation. Little bluestem (Schizachyrium scoparium) dominates the plant community at climax with yellow indiangrass (Sorghastrum nutans) and big bluestem (Andropogon gerurdii) as subdominant species. As retrogression occurs, silver bluestem (Bothriochlou succharoides) and meadow dropseed (Sporobolus usper) are initial increasers. If continuous, heavy use occurs, buffalograss (Buchloe dactyloides), purple threeawn (Aristidu purpureu), Texas grama (Boutelouu rigidisetu) and Halls panicum (Panicurn hullii) will come to dominate the site (U.S. Dep. Agr. 1976).
Species composition was determined immediately after the first killing frost in late November 1976. Species composition was deter- mined using a pace transect method (Stuth and Dahl 1974). Five,
lOO-point transects were randomly located in each pasture. Both pastures were deferred during the growing season and stocked at approximately 3.25 ha/animal units (au) from December 15 to April 1. Access was provided to the subdivision in each pasture at all times except during diet collection periods. To monitor stocking pressure between subdivisions, available above-ground biomass was deter- mined at each collection period. All vegetation within 20, 0.25m2 plots was clipped at ground level and dried at 100°C for 48 hours.
Table 2. Mean standing crop (kg/ha) and associated confidence intervals of forage on mid-poor and high-poor condition pastures on a Blackland range site grazed during the winter.
Condition Class .25
Date Mid-poor C.I. High-poor C.I.
-
December 17, 1976 2030’ k374 2242 -+318
January 11, 1977 1656 +185 1698 -1272
January 28, 1977 1492 k-288 1300 +191
February 18,1977 1012 -e202 1216 +255
March 14,1977 980 2177 764 +156
April I, 1977 628 &I54 658 k161
bp u, .20 2
0 I .15 Q ‘E .lO
’ Stundlnp crop dud not doffer hlgmtlcantly between pastures at any samplmg date
tI’io.05). .05
Forage Availability
To evaluate nutritional differences it was critical that stocking ptcssures be maintained as near equal as possible between pastures. Standing crop of forage was maintained at reasonably comparable levels throughout the study (Table 2). Thus, compositional effects on diets were reflected while biomass differences were minimal. The pattern of utilization obtained in this study is typical of utilization on ranches in central Texas.
Fig. 2. Phosphorus (%) in diets of cows on mid-poor and high-poor condition pastures oj u Blucklund runge site grazed during the winter of 1976-77. Dietury phosphorus requirement for lactating and dry, pregnant cows is provided.
different between pastures and among dates (P<O.O5).
Dietary Quality
Dietary Crude Protein
Digestible Organic Matter
Crude protein was generally higher in the forage ingested by animals grazing the high-poor condition pasture (Table 3). If 5.9% and 9.2% crude protein are used as required levels for maintenance of a 1 OOO-lb pregnant or lactating cow, respective- ly (NRC 1976), then only the period from mid-December to mid-January was deficient in the high-poor condition pasture. Deficient CP levels were extended into February on the mid- poor condition pasture. Available forage was assumed not to be limited.
A rapid increase in dietary protein was observed during February, when cool-season species began active growth. The high-poor condition pasture exhibited the response 3 weeks earlier than did the mid-poor condition pasture. Initiation of growth of cool-season species depends primarily on winter and early spring temperatures. The significantly larger percentage of both perennial and annual cool-season grasses in the high- poor condition pasture probably accounted for the earlier increase in CP observed there (Table 1). Crude protein content of the diet averaged 2.5% higher for the entire sampling period in the high-poor condition pasture as compared to the mid-poor condition pasture (PcO.05). All CP values were significantly
Percent DOM was generally higher in the high-poor condi- tion pasture during mid-winter (Table 3). DOM levels were lowest in diets for both pastures in February, a period with low standing crop and little growth of cool-season plants. The greatest differences in DOM between pastures were in March and April, a period when the spring “flush” of cool-season grasses, primarily Japanese brome (Bromus japonicus), little barley (Hordeum jubatum), rescuegrass (Bromus unioloides) and Texas w intergrass, occurred. Average DOM was 10% higher in the high-poor condition pasture than in the mid-poor condition pasture (PcO.05). All DOM values were significant- ly different between pastures for each sampling date (P<O.O5).
Phosphorus
Phosphorus levels were similar between pastures until mid- January (Fig. 2). After February, phosphorus content of the diets was higher in the high-poor condition pasture. Dietary phosphorus levels declined during March on the mid-poor condition pastures. It appeared that utilization of cool-season species exceeded growth, thereby, reducing their contribution to the cows’ diets. Differences in dietary phosphorus were most evident in March and April.
DECEMBER ’ JANUARY ’ FEBRUARY ’ MARCH ’ APRIL
DATE
Table 3. Percent dietary crude protein (CP) and percent digestible organic matter (DOM) of mid-poor and high-poor condition pastures on a Blackland range site grazed during the winter.
CP
Date High-poor C.I. Mid-poor C.I.
December 17,1976 6.07 20.1 1’92 4.67 20.06
January 11, 1977 5.65 kO.03 6.42 to.04
January 28, 1977 9.29 to.06 5.28 50.08
February 18,1977 8.37 kO.05 8.50 50.05
March 14, 1977 15.24 to.04 8.77 kO.04
April 1, 1977 16.04 kO.33 11.81 20.07
Mean 10.11 7.58
’ All values are significantly different between pastures (P<O.O5). ’ All values are significantly different among dates x pastures (P<O.O5).
’ DOM values followed by a common letter are not significantly different (<0.05).
High-poor
58.4cd 60.0~ 55.7e 45.9g 71.2b 76.3a 61.3
C.I.
+-0.31,:j to.4 kO.5 + 1.4 k5.3 22.4
DOM
Mid-poor
51.9f 55.3e 57.8d 42.7h 45.4g 55.2e 51.4
C.I.
20.5 20.9 kO.6 k3.8 21.3 20.6
Phosphorus levels were deficient for a non-lactating, preg- nant cow (NRC 1976) in both pastures until late January. However, neither pasture would have met the phosphorus needs of lactating cows (0.28%) throughout the study period. By early April both pastures were providing adequate phosphorus levels for dry, pregnant cows (0.18%).
Conclusions
CP, DOM and P in diets of fistulated cows were influenced by differences in species composition on two ranges differing in condition, even though standing crop of forage was approxi- mately the same. The plant community in a higher successional stage provided diets higher in quality throughout the winter months and furnished critical nutrients earlier in late winter and spring. The important role of cool-season species was evident in these findings. A small increase (8%) in contribution of cool-season species to a plant community could mean a 3 to 4 week shorter supplementation period for protein, energy, and phosphorus. The findings would be applicable to a poor condition Blackland range site.
Literature Cited
Association of Offtcial Agricultural Chemists. 1960. Official Methods of Analysis (9th ed.) Ass. Off. Agr. Chem., Washington, D.C.
Association of Official Analytical Chemists. 1975. Spectroscopic methods. J. Ass. Off. Anal. Chem. X3:421-422.
Bruning, J.L., and B.L. Kintz. 1968. Computational Handbook of Statis- tics. Scott, Foresman and Co., Glenview, Ill. 269 p.
Cook, C.W. 1964. Symposium on nutrition of forages and pastures: Collecting forage samples representative of ingested material of grazing animals for nutritional studies. J. Animal Sci. 23:265-270.
Cook, C.W., M.M. Kothmann, and L.E. Harris. 1965. Effect of range
condition and utilization on nutritive intake of sheep on Sumlner ranges. J.
Range Manage. 18:69-73.
Demarchi, D.A. 1973. Relationship of range quality to range condition in the Chilcotin Region, British Columbia. J. Range Manage. 26: 345-348. Ellis, W.C. 1970. The in vitro determination of true and apparent digestibility of forages. Dep. Animal Science, Texas A&M University, College Station. Mimeo. 4p.
Gates, D.H. 1972. The use of range condition in rangeland ecosystem evaluation and management planning. U.S.-Australia Range Workshop. Adelaide, Australia. 33 p.
Goebel, C.J., and C.W. Cook. 1960. Effect of range condition on plant vigor, production and nutritive value of forage. J. Range Manage. 13:307-3 13. Hoehne, O.E., D.C. Clanton, and C.L. Streeter. 1967. Chemical changes in esophageal fistula samples caused by salivary contamination and sample preparation. J. Anim. Sci. 26:628-63 1.
Kothmann, M.M. 1968. The botanical and nutrient content of the diet of sheep grazing on poor condition pasture as compared to good condition pasture. Ph.D. Diss. Texas A&M Univ., College Station. 60 p.
Kothmann, M.M. (ed.). 1974. A glossary of terms used in range management. Sot. Range Manage. Denver, Colo. 36 p.
National Oceanic Atmospheric Administration. 1976. Climatological data for Texas-Vol. 81. U.S. Dept. Commerce. Washington, D.C.
National Research Council. 1976. Nutrient requirements of domestic animals; No. 4. Nutrient requirements of beef cattle. National Academy of Science. Washington, D.C. 55 p.
Stuth, J.W., and B.E. Dahl, 1974. Evaluation of rangeland seedings following mechanical brush control in Texas. J. Range Manage. 27: 146-149. U.S. Dep. Agriculture. 1976. Range site descriptions for Texas-Blackland
Site-Area 16. Soil Conservation Service. Temple, Texas. 4 p.
Van Dyne, G.M., and D.T. Torell. 1964. Development and use of the esophageal fistula: A review. J. Range Manage. 17:7- 19.
Attention Authors:
Effective April 1, 1979, page charges in the Journal oj Range Management will be increased to *S5.00 each for the first three pages and $85.00 each for the fourth and each Subsequent page:.
Aerial
Census of Wild Horses in Western Utah
MILTON N. FREI, J. SCOTT PETERSON, AND J. RON HALL
Abstract
The accuracy of aerial censuses in estimating absolute density of wildlife populations varies widely. Aerial censusing of wild horses
was done to compare the effects of experience and aircraft type. The difference between aircraft types was not found to be statisti- cally significant, while observer experience was significant at the 5% level. The variability caused by these factors places consider-
able uncertainty on projections of rate of increase based upon a comparison of two or more aerial censuses.
Aerial survey is the only practical means of counting larger animals in wilderness terrain (Fuller 1950), but is, at best, a rough method of estimating the size of a population (Caughley
1974). The literature contains no information on aerially censusing wild horses, but there is a wealth of data concerning large mammals. The various factors which affect the accuracy of aerial counts include variables related to observer (experi- ence, fatigue, individual variation), animal (density, color, size, diurnal behavior pattern), technique (transect width, speed, height), physiography (terrain, vegetation), weather (clouds, turbulence, snow cover, light conditions), and equip- ment (aircraft type, pilot). In an aerial census of moose in
l-square mile enclosures, LeResche and Rausch (1974) found that seasoned observers without recent counting experience are as inaccurate as unseasoned observers. The accuracy of aerial censuses in estimating absolute density of wildlife populations varies from 29 to 88% (Caughley 1977).
In recent years, aerial censusing of wild horse populations has. indicated that populations are experiencing phenomenal growth. Heady and Bartolome (1977) indicate an increase in numbers from 66 to 120 and 225 on the Three Fingers and from 94 to 113 and 150 on the Jackies Butte horse management areas in Oregon for the consecutive years of 1972, 1973 and 1974, respectively. The above authors state that “although inaccurate counting and addition of adults to the herds cannot be ruled out in either area, the major increase reflects natural reproduction. The data for Jackies Butte are believed accurate and they suggest a reproductive rate of 60% in 3 years or 20% per year. ” Two other examples of published data on rate of increase include an increase of 28%, 29%, and 18% for 1973, 1974, and
1975 respectively, in Idaho’s Challis Planning Unit (U.S. Dep. Interior 1975) and 30% and 22% for 1974 and 1975, respective- ly, in California’s Susanville District (U.S. Dep. Interior 1976).
Authors are range conservationist, Bureau of Land Management, Denver Federal Center Denver, Colorado 80225; range conservationist, Botany and Plant Pathology, Colorado State University, Fort Collins, Colorado 80523; and wild horse specialist Bureau of Land Management, Winnemucca, Nevada 89445.
The authors would like to thank Dr. Frederick K. Martinson, who provided technical aG&mce in statistical analysis of the data.
Manuscript received January 16, 1978.
The aerial surveys in the Challis Planning Unit were made by fixed-wing aircraft in 1973-74 and by helicopter in 1975. The type of aircraft used in the Susanville District was not identified.
It is our contention that a large portion of the above increases can be attributed to the noncompensating errors naturally inherent in aerial surveys. The present study is not intended to give an absolute count of a population, since aerial surveys of large mammals consistently underestimate densities (Golley and Buechner 1968; Bergerud 1963; LeResch and Rausch 1974; Gilbert and Grieb 1957). The purpose was to evaluate differ- ences in the results of wild horse aerial censusing with regard to (1) the experience of personnel and (2) the type of aircraft used, particularly as related to projections of wild horse population increase.
Study Area
The study area is situated on the Dugway Proving Grounds in west- central Utah (Fig. 1). The specific study sites within this area were the Granite Mountain and a portion of the Cedar Mountains with eleva- tions ranging from 1,342 to 2,140 meters. These two areas were selected because the wild horse populations were isolated due to topography. The areas were geographically dissimilar, particularly in size and terrain. Granite Mountain occupies approximately 110 km2 and resembles a butte. The slopes are rocky and very steep, with most horse activity on the adjacent flats. The Cedar Mountains, in compari- son, have relatively accessible slopes, with many canyons along the range. This site comprises approximately 330 km* with horse activity observed throughout.
Vegetation on Granite Mountain consisted of plant species common to the northern desert shrub community. Big sagebrush (Artemisia tridentata), black sagebrush (Artemisiu nova), shadscale (Atriplex confertifoliu) and winterfat (Cerutoides funutu) were the common shrubs in the area. Grasses and forbs included wheatgrass (Agropyron spp.), galleta (Hiluriujumesii), cheatgrass (Bromus rectorurn), scarlet globemallow (Sphuerulceu cocciniu), and lupine (Lupinus spp.). Visibility of horses not limited due to the open terrain and lack of trees. Cedar Mountain was dominated by a juniper woodland, which was interspersed with open sagebrush parks along the ridges and canyon bottoms. Open flats bordered both sides of the mountain and contained vegetation common to the northern desert shrub community. Trees and shrubs included utah juniper (Juniperus osteospermu), big sagebrush, rubber rabbitbrush (Chrysothumnus nuuseosus), shadscale, and black sagebrush. Wheatgrass, cheatgrass, galleta, Indian ricegrass (Oryzopsis hymenoides), scarlet globemallow, bladderpod (Les- querellu spp.) and tansymustard (Descuruiniu spp.) were common grasses and forbs. Visibility of horses was limited due to density of vegetation and complexity of topography.
All flights over the study area were conducted during the period February 28 through March 7, 1977. The Cedar Mountains were covered with a light blanket of snow during all flights conducted with the Jet-Ranger helicopter. Patchy snow conditions were encountered during all other flights. Light conditions were excellent to good for 16
Fii. 1. Location map of study area.
of the 18 census flights. These factors represent realistic conditions frequently encountered in aerial surveys.
Met hods
The censusing was done with three different aircraft and three observers with a variety of experience. The aircraft consisted of two helicopters: (1) a Bell Jet-Ranger, and (3) a Bell 47 utilizing the same pilot, and (3) a fixed-wing, acrobatic Citabria with a different pilot. The Jet-Ranger is a high powered turbine craft, as compared with the low-powered reciprocal engine in the Bell-47. The Bell-47’s most favorable features are its lower hourly cost and the excellent visibility. The fixed-wing Citabria has the lowest hourly cost, but lacks the maneuverability and visibility offered by rotary-wing craft. The three observers were classified according to their prior experience in aerial censusing of wild horses. Observer A had 900 hours of census experience; B, 150 hours of census experience; and C, no census experience. Also, observer A had extensive recent ground and air experience in the survey area; B had a few hours past ground and aerial census experience in these areas; and C had no experience in the areas. Each observer separately censused the two mountains in each of the aircraft. The pilots were instructed to maneuver the aircraft only when directed by the observer and to make no indication of horse sightings. Airspeed and altitude were left to the discretion of each observer as a function of experience; however, they generally remained similar for all observers. The number of animals was written down following each pass over a group or band. To compare counts between differing levels of experience, no specific surveying techniques or results were discussed prior to or during the censusing period. This was an attempt to keep each observer’s findings from biasing another. Due to various constraints, the time of day of comparable flights was not made uniform, though a maximum time limitation was placed on the observer for any specific count. Each observer felt that the allotted time was more than sufficient to census the areas adequately and usually utilized less than the maximum time allowed. Each observer concluded each flight with the feeling that he had counted most of the animals within the area.
Results
The combined total horse count for both mountains ranged
JOURNALOFRANGEMANAGEMENT32(1),JANUARY1979
+ LqM Cmdih’On5 poor
A
1
r
ll
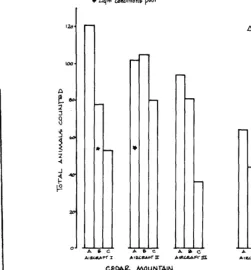
Fig. 2. Total animals counted by experience of observer. uircrufr type, and tnoutrtaitt runge.
from a minimum of 7 1 by the least experienced observer (C) in the fixed wing aircraft (3) to a maximum of 185 by the most experienced (A) in the Jet Ranger (I ). This amounts to a 160% discrepancy between the minimum and maximum number of animals counted.
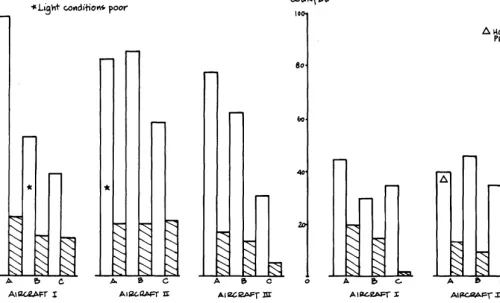
The histograms (Fig. 2 & 3) illustrate the marked differences between observers (experience) and aircraft. The average band size viewed by observers A and B was 5.2 animals, while the average size for observer C was 6.3. This may indicate that observer C viewed the larger bands, but missed small bands, or that he was unable to discern individual bands. The virtual
inability
of
observer C to distinguish age classes using aircraft 1 is thought to be due to the fact that this was his first aerial census (Fig. 3).Gilbert and Grieb (1957) state that the study area for deer populations should support at least 100 animals, or aerial census results will be obtained that will be unsatisfactory for statistical analysis. The counts on Granite Mountain involved consider- ably less than 100 animals. Because of this factor, differences between observers and aircraft on Granite Mountain did not lend themselves to statistical analysis.
A comparison of the total counts (Fig. 2) on both Cedar and Granite Mountains among observers, by aircraft, showed in- creasing numbers with more experience, except for aircraft 2. On these mountain ranges, the differences between observers A and B did not follow the pattern of the other flights. In the Cedar Mountains, the observers felt that the differences in results when utilizing aircraft 2 were due to excellent light conditions on the day that observer B flew, and overcast poor light conditions during the flight of observer A. On Granite Moun- tain, observer A felt that the animals were scattered into the adjacent flats by previous helicopter and fixed-wing flights, whereas observer B had the first flight of the day when the animals were relatively grouped.
*Light wadifion~ poor
80
Fig. 3. Age class distribution of horse populations by experience of observer, aircraft type, and mountain range.
An analysis of variance was initially performed on the total animals derived from both mountains. The considered factors were (a) experience, (b) aircraft type, and (c) mountain. When analyzing the counts by analysis of variance, a lack of repli- cation severely limited the degrees of freedom that could be used. Several sources of variation (au-craft, aircraft X exper- ience, mountain X aircraft X experience) were pooled to produce an estimate of the error term. Visually (Figs. 2 and 3), the difference among factors looks significant, and statistically the comparison between mountains was significant at the 1% level, with experience being significant at the 5% level. The large significance of the mountain factor and the lack of replications appeared to be masking the difference between aircraft. Because of this, and the larger population of Cedar Mountain, it was determined that statistical analysis be limited to the Cedar Mountain only.
An analysis of variance was next performed on the total animals counted on the Cedar Mountain. From these data, a comparison of computed versus table F values (Table 1) demonstrated that the differences among aircraft were not significant at the 5% level while the differences among observer
experience were significant at the 5% level.
To obtain a pictorial representation of the differences among observer experience and aircraft type, an analysis of means following Ott (1975) was performed on the data. As shown in Figure 4, the points representing the means of the counts obtained from each type of aircraft are contained within the .05 limits, thereby indicating their lack of significance at the 5% level. However, the spread of the means of the aircraft counts points towards a very positive difference between types of
Table 1. Analysis of variance for total wild horses counted on the Cedar Mountain.
Source of Sum of Jkgreeof Mean Computed Table variation squares freedom square F values F values
0.05 0.01 ,
Aircraft type 522.9 2 261.4 2.15 6.94 18.00
Observer
experience 2928.2 2 1464.1 12.04 6.94 18.00
Error 486.4 4 121.6 - - -
Total 3937.6 8 - - - -
10
1 = J&T WLN6EQ XL BbLL41 In. - Cl~Aem&
Fig. 4. Analysis ofmeans.
aircraft used. This can logically be attributed to the physical characteristics of each aircraft. Although not demonstrated statistically, it is felt that the analysis of means (Fig. 4) indicates the selection of aircraft will have a considerable affect on relative population counts.
The histograms (Figs. 2 & 3) illustrate the fact that the differences between experience were least when utilizing air- craft 2. This is thought to be a function of the slower speed and greater visibility of this aircraft. For these reasons the Bell 47 helicopter is considered to be the aircraft of choice, among those considered, in the aerial census of wild horses. Cost and horsepower limitations will be important considerations in selecting one of the types of aircraft.
Conclusions
Statistically, experience was the most significant factor analyzed in this study. The study illustrates that under similar conditions aerial counts on a wild horse population could increase significantly if successive counts are performed by more experienced personnel. To a degree this is an unavoidable variable, since experience will increase every time an aerial census is conducted. Therefore, the factor of experience alone could easily account for a significant portion of the large increases in numbers of wild horses that have been noted by aerial census. The results indicate that for the most accurate counts of relative wild horse numbers, only personnel with census experience should be used. Also, better counts will be obtained from those familiar with the area on the ground and from the air.
As a general conclusion, the authors believe the wide variability in animals counted, demonstrated by this study, places considerable uncertainty on rate of increase projections which are based upon a comparison of two or more aerial censuses. At best, aerial census will provide minimally acceptable estimates of wild horse population densities and broad overviews of population trend. Since population increase is a function of fecundity and survival, these factors should be important considerations in rate of increase projections.
Literature Cited
Bergerud, A.T. 1963. Aerial winter census of caribou, J. Wild]. Manage. 27:438-449.
Caughley, G. 1974. Bias in aerial survey. J. Wild]. Manage. 38:921-933. Caughley, G. 1977. Analysis of Vertebrate Populations. John Wiley & Sons,
N.Y.
Fuller, W.A. 1950. Aerial census of bison in Wood Buffalo Park. J. Wild]. Manage. 14445-45 1.
Gilbert, P.F., and J.R. Grieb. 1957. Comparison of air and ground deer counts in Colorado. J. Wildl. Manage. 21:33-37.
Galley, F.B., and H. Buechner. 1968. A practical guide to the study of the productivity of large herbivores. IBP Handbook No. 7 Blackwell Scientific Publications. Oxford and Edinburgh.
Heady, H.F., and J. Bartolome. 1977. The Vale rangeland rehabilitation program: The desert repaired in southeastern Oregon. U.S.D.A., PNWF&- RES, Forest Serv. Res. Bull. PNW-70.
LeResche, R.E., and R.A. Rausch. 1974. Accuracy and precision of aerial moose counting. J. Wildl. Manage. 38:175-182.
Ott, E.R. 1975. Process Quality Control. McGraw-Hill. N.Y.
U.S. Department of Interior. Draft Challis environmental impact statement. Bureau of Land Management.
U.S. Department of Interior. Susanville District wild horse and burro statistics. Bureau of Land Management (Unpublished).
Election Results
The 2,007 ball o s t cast in the 1978 election were counted on December 8. Selected by the membership to serve the Society during the next 3 years were:
Presiu’e)z t Elect . . . . Harold F. Heady Directors . . . S. Clark Martin
Jack R. Miller
The new officers will be installed at the forthcoming Annual Meeting in Casper, at which time Daniel Merkel, the current president elect, will succeed to the presidency. Harold Heady will serve as president in 1980, and the two newly elected directors will serve for the 3-year term 1979- 198 1.
Retiring next month from the Board of Directors are Past President Thadis W. Box and Directors Edward A. McKinnon and Jeff Powell. The very significant service rendered to the Society by these men is greatly appreciated.
Dr. Harold F. Heady is at present assistant vice president for Agriculture and University Services and associate director of the Agricultural Experiment Station, University of California.
Dr. S. Clark Martin is principal range scientist with the Rocky Mountain Forest and Range Experiment Station, U.S. Forest Service, Tempe, Arizona. Jack R. Miller, is a range and wildlife specialist for the U.S. Forest Service, Missoula, Montana.
Members voted to amend Article 1, Section 6 of the Bylaws to read: Family (membership dues)-As shall be established from time to time by the Board of Directors.
Office staff at the SRM headquarters in Denver counted the ballots. Ballots and tally sheets are kept on file in the Society office for 1 year.
Occurrence of C3 and C4 Photosynthetic
Pathways in North American Grasses
S.S. WALLER AND J.K. LEWIS
Abstract
A literature survey was made for the occurrence of C, and C, photosynthetic pathways in the United States Gramineae. Distinc-
tive characteristics of the two photosynthetic pathways are discussed. Leaf anatomy, CO, compensation point, net enhance-
ment of photosynthesis in oxygen-deficient atmosphere, QC
discrimination, and initial product labeling were criteria selected to evaluate data for 6 subfamilies including 25 tribes, 138 genera, and 632 species. The Arundinoideae, Bambusoideae, Oryzoideae, and Pooideae (Festucoideae) are composed of species with C, pathways. All tribes within the Eragrostoideae have C, pathways with the exception of Unioleae. Within the Panicoideae, the Andropogoneae and all of the Paniceae, excepting the genera
Sacciolepus, Isachne, Oplismenus, Amphicatpum, and Panicum,
have C, pathways. The subgenus Dichanthelium within Panicum is
C, while the Bupanicum subgenus contains plants with both C, and C, photosynthetic pathways.
Plant productivity is dependent on several environmental and biological factors. The most important single factor is photo- synthesis. A pathway for carbon dioxide (CO;?) fixation was described by Calvin and Bassham (1962) in which CO2 was incorporated into a 6-carbon compound and rapidly converted to a 3-carbon compound, 3-phosphoglyceric acid (3PGA). Pre- vious to discoveries of Kortschalk et al. (1965) and Hatch and Slack (1966), the Calvin cycle (C,, reductive pentose pathway) was considered the major photosynthetic mechanism for carbon (C) fixation. However, Hatch and Slack (1966) described CO;! fixation in which labeled CO;! was first incorporated in 4-carbon compounds (malic, aspartic , or oxaloacetic acid) prior to transfer to sugars by way of 3-phosphoglycerate. The proposed mechanism involved the operation of two interconnected met- abolic cycles. Downton (1970) described carbon fixation into Cd-dicarboxylic acids in mesophyll cells and subsequent incor- poration into the Calvin cycle located in the bundle sheath cells. Plants (Cd plants) possessing the 4-carbon pathway (also called Cd, dicarboxylic acid, Kranz type, low CO;! compensation, tropical, Hatch and Slack, or p carboxylation pathway) were of tropical ongm and more efficient. They produced two- to threefold more dry matter than plants possessing the 3-carbon pathway (C, plants), especially in relatively sunny, warm, dry climates (Black 197 1).
Distinctive characteristics associated with the Ca pathway prompted intensive research in photosynthetic processes of flowering plants. The most important photosynthetic pathways
Authors were assistant and associate professor, Animal Science Department, South Dakota State University, Brookings 57007. Senior author is presently Associate Pro- fe5sor, Department of Agronomy, University of Nebraska, Lincoln, Nebr. 68583.
This report was approved for publication by the Director, Agricultural Experiment Station, South Dakota State University, Brookings, as Journal series No. 1533.
The authors extend appreciation to Dr. D. Kenefick and Dr. C. Chen, South Dakota State University, for their helpful suggestions in manuscript preparation. We also appreciated the aid of Dr. S. Hatch, New Mexico State University, in reviewing the
taxonomic classification. We would also like to thank Mrs. Susanne Gardner for typing the
manuscript.
Manuscript received January IO, 1978.
are the C3 and Cd; however, a crassulacean acid pathway (CAM) has been reported in some succulents (Ranson and Thomas 1961; Ting 1971).
The first listing of Cd plants was prepared in 1970 (Downton 1971). By 1974, the Cd photosynthetic ptihway had been identified in 13 families (Aizoaceae, Amaranthaceae, Boragin- aceae, Caryophyllaceae, Chenopodiaceae, Compositae, Con- volvulaceae, Cyperaceae, Euphorbiaceae, Gramineae, Nyctag- inaceae, Portulacaceae and Zygophyllaceae) and 117 genera of the Angiospermae (Downton 1975). Bjorkman (1976) ident- ified three additional families: Acanthaceae, Capparidaceae, and Scrophulariaceae. Many publications have been concerned with identification of the Cd pathway in individual species. Knowledge about the photosynthetic pathway allows inter- pretation of several important ecological characteristics. Black et al. (1969) proposed that competitive ability of plants pri- marily depended on net capacity of CO2 assimilation, resulting in increased foliage extension and size. Other factors being equal, plants with higher apparent photosynthetic rates (Cd plants: species having the Cd pathway, Calvin pathway and Kranz anatomy) have a competitive advantage over those with lower rates (C, plants: species having only the Calvin pathway). Such advantage can help explain aspects of structure and function in terrestrial ecosystems and the importance of warm- season and cool-season plant classification in range manage- ment.
The present literature review was undertaken to compile a listing of photosynthetic pathways and related attributes of United States grasses to serve as a reference for range scientists.
Methods of Determining the Photosynthetic Pathway Plants possessing the Cd photosynthetic pathway are very different from Cj plants in a variety of characteristics (Black 197 1). The net photosynthetic rate is two- to threefold greater; CO;! compensation points are lower; photosynthesis is not suppressed by oxygen concentration between 1 and 100%; CO2 is not evolved during illumination; bundle sheath cells contain chloroplasts and starch; discrimination against 13C compounds is lower; and CO2 fixation initially yields 4-C acids as opposed to 3-C acids found in the C3 photosynthetic pathway. Since these distinguishing characteristics are coexistent, various char- acters have been used as criteria for determining the photo- synthetic l$ocess. Five characteristics have been widely used to classify the photosynthetic pathway and are discussed below.
Photosynthetic Products
Initial product labeling with 14C is the only direct method for photosynthetic pathway determination. Hatch et al. (1967) reported that in Cd plants as much as 93% of fixed radioactivity appeared in oxaloacetic, malic, and aspartic acids following
exposure to 14C02 for approximately I second. In contrast, early products of the CJ process were 3-PGA and hexose phosphates.
COz Compensation and Photorespiration
Carbon dioxide compensation point (the point at which photosynthetic CO;! uptake equals respiratory CO2 evolution when measured in a closed chamber) is an easily obtainable characteristic. During photosynthesis a light-induced release of CO2 can occur and is referred to as photorespiration as con- trasted to CO* released by mitochondria or dark respiration. Plants with the Cd pathway have a photosynthetic CO2 compen- sation in the range of 0- 10 ppm, indicating a lack of significant net photorespiration (Downton and Tregunna 1968). Photo- respiration does occur as a normal product of the Calvin cycle within the bundle sheath cells of Cd plants. However, since the mesophyll layer surrounds the bundle sheath, the C4 pathway would rapidly refix any photorespiratory CO2 and prevent leakage to the atmosphere (Bowes and Ogren 1972). A much higher CO* compensation point (37-70 ppm) is characteristic of CJ plants (Black 1971). Carbon dioxide compensation points provide a convenient means of identifying the type of photo- synthetic pathway. The low CO? compensation point of Cq plants indicates an ability to utilize more external CO2 as compared to C3 plants.
Oxygen Suppression
Oxygen differentially affects CO2 exchange in CJ and Cd plant species, primarily because of differences in photores- piration. In soybean (Glycine max), and probably other C3 species as well, the total 02 inhibition consists of two discern- ible effects. Oxygen substitutes for CO2 in the carboxylase reaction to yield P-glycolate, a C3 photorespiratory inter- mediate. As a result of this subsitution, 02 competitively inhibits the carboxylase with respect to CO2 (Ogren 1976). During photorespiration glycolate is oxidized, releasing C02. Consequently, oxygen depletion will reduce glycolate oxida- tion thereby increasing photosynthetic CO? assimilation by 40 to 50% in species possessing the CX pathway, while having no effect on C_I plants (Downes and Hesketh 1968). The refixation of photorespiratory CO2 allows Cd plants to utilize all of the fixed ~02, thus increasing photosynthetic efficiency.
Chollet ( 1976) postulated that the enzyme complement of the Cd pathway increased CO;! concentration at the site of the CJ carboxylase, reducing the competitive inhibition of 02 and minimizing photorespiration. The CO2 concentration at the site of the Cj carboxylase coupled with a specialized leaf anatomy, allowing recapture of photorespiratory COZ, was apparently responsible for the lack of photorespiration and absence of the inhibitory effect of 2 1% 02 on net photosynthesis in C4 plants.
Leaf Anatomy
Leaf anatomy provides an easily distinguished difference between Cj and Cd plants. Plants with the C3 photosynthetic capabilities lack well-defined parenchymatic bundle sheaths
and starch grains are found mainly within the mesophyll (Bisal- putra et al. 1969) (Fig. 1). Plants with the Cd photosynthetic pathway generally have well-developed parenchymatic bundle sheaths containing high concentrations of chloroplasts and starch. Bundle sheath cells utilize the C3 photosynthetic pro- cess; however, they are surrounded by mesophyll cells contain- ing chloroplasts utilizing the Cd photosynthetic process which
Fii. 1. Comparison of leaf anatomy between plants having C, photosynthesis (a) and Cz3 photosynthesis (b). The C,plant exhibits prominent bwdle sheath cells and concentrated photosynthetic activity near the vascular bundles (Adopted from Black 1971).
fix and then supply CO2 for the C3 pathway.
The unique leaf anatomy (Kranz type) of Cd plants provides several advantages for efficient CO2 fixation. Surrounding the Cj bundle sheath cells with Cd mesophyll cells minimizes the loss of CO2 from C3 photorespiration. The presence of two active photosynthetic carboxylases and their associated enzymes in the same leaf of a C, plant appears to result in a higher affinity for and more rapid uptake of CO,. The close proximity of starch formation to the vascular bundles should make photosynthate translocation more efficient.
Carbon Isotope Discrimination
Carbon isotope ratio ( i3C/i2C) determination in plant tissue is characteristically less than the carbon isotope ratio of atmos- pheric CO2, indicating that plants preferentially assimilate the lighter of the two isotopes (Troughton et al. 1974). Carbon isotope values are defined as the difference in per mil of the i3C/i 2C ratio of the sample relative to a standard and reported as lC”/oo (Smith and Epstein 197 1). Details of the procedure are described elsewhere (Park and Epstein 1960). Higher plants are placed into two categories, those with low l:iCo/oo values (-24
to -34”/00) and those with high values( -6 to - 19”/00 (Smith and Epstein 197 1). Grasses relatively enriched in ‘:‘C have ‘C”/oo values in the -6 to - 19”/00 range and are reported to be C I while those with relatively low “‘C”/oo values are Cl species (Bender 197 1). Troughton et al. ( 1974) reported a mean I:C”/oo
valueof-2t3.11+2.55forC:,and-l3.46+1.55forC,grasses.
The distinctive difference apparently results from differences in aflinity of the enzyme systems of the two pathways for the two isotopes of carbon (Whelan et al. 1973). Thus, the carbon isotope technique was cited as a reliable method of distinguish- ing between C3 and Cd plants (Bender 1971).
Other Characteristics Related to Photosynthetic Pathway Several other physiological characteristics are closely related to photosynthetic pathway, but have not been widely used in plant classification. Light saturation differs in the two path- ways. Cd plants exhibit continued increase in CO2 uptake as light intensity increases to nearly full sunlight (approximately 1.5 to 1.8 langleys), while C3 plants are saturated at 0.2 to 0.4 langleys. Maximum CO2 assimilation on a leaf area basis at normal atmospheric concentration of CO* ranges from 50 to 80 mg CO:! *drneZ .hr-’ for C, plants, but only 15 to 35 mg CO,
dm-” hr-’ f or Cl (Black 1971). Consequently, CA plants are more efficient in energy conversion at high light intensities.
Optimum temperature for CO2 uptake by Cd plants was reported to be 30 to 40°C with uptake decreasing rapidly below 15 to 20°C. In contrast, temperature optima for CJ plants ranged from 10 to 25°C with usually a sharp decrease above 25°C (Black 1971). Low night temperatures adversely affected chloroplast ultrastructure and chloroplast development in leaves of Cd plants (Slack et al. 1974). The physiological response of the photosynthetic apparatus to temperature-is the probable reason for the observed phenological development of cool- season plants such as western wheatgrass (Agropyron smithii) (Cs) and warm-season plants, such as blue grama (Bouteloua yracilis) (Cd) (Williams 1974).
Translocation capacity is larger in Cd than C3 plants because of a larger cross-sectional area of phloem (Gallaher et al. 1975). Species with the Cd photosynthetic pathway have fewer cells between leaf vascular bundles than do C3 species (Crookston and Moss 1974). The closeness of all leaf cells to vascular tissue in C, plants suggests greater efficiency in transporting photo- synthate. Takeda and Fukuyama (197 1) determined an inter- veinal distance of 25 to 70 pm (micrometers) for C4 species and 75 to 130 ,um for C3 species.
Enzyme systems dotter m plants with the two photosynthate pathways. Significant physical and kinetic differences were reported for phosphoenolpyruvate carboxylase taken from Cd and C3 species (Ting and Osmond 1973). However, carboxydis- mutase activity (ribulose- 1, 5diphosphate carboxylase) was found to be similar in both C3 and C, plants. A low carbonic anhydrase activity appears distinctive of species with low compensation points and high rates of photosynthesis (Cd), while the inverse is true for C3 plants (Chen et al. 1970; Triolo et
al. 1974).
Photoperiod requirements generally differ in the two
groups,
but not directly. Since Ch plants are well adapted to tropical regions, it is natural that most would be short-day or day-neutral with respect to flowering. However, Cd plants growing at higher latitudes have become adapted to long days for flowering. Genetic plasticity therefore apparently exists for selection for adaptation to photoperiod (Evans 1975).Bender and Smith (1973) have reported a relationship be- tween type of nonstructural polysaccharide (starch or fructosan) accumulated in the lower internodes of grass shoots and carbon isotope determinations. They found that the type of non- structural polysaccharide was not dependent on the type of photosynthetic pathway. However, data reported by Smith (1968) indicated C, plants accumulated starch while C3 plants generally accumulated fructosans. Selected species of Ory- zopis, Phragmites, Stipa, and Panicum were of the C3 type but accumulated starch.
Water is a common limiting factor for plant growth through- out western rangelands. Plants which are efficient in water use would have a competitive advantage over less efficient plants during periods of moisture stress. C1 plants required about half as much water as Cl plants to produce one unit of dry matter (Black 1971). However, desert biome researchers in the Curlew Valley of northwestern Utah determined that Atriplex con- jertifolia (C,) and Ceratoides lanata (Cl) were about equal in their annual water use while photosynthetic rates were similar (Cox 1977). High photosynthetic rates in CA plants did not result in increased transpiration rates compared to C:s plants (El-Shark- awy and Hesketh 1965).
Taxonomic Classification
Photosynthetic pathway data for 632 species representing 138
genera and 25 tribes of the United States Gramineae were summarized (Table 1). Results were reported for tribes within each of subfamilies (Gould 1968) (Table 2).
Few intermediate values occurred between the identified Ca and Cd range of any characteristic utilized for photosynthetic pathway determination. Also, there was little variation within any characteristic from plant to plant within a species. Selected characteristics for photosynthetic pathway determination were consistently in agreement. Thus, in general, knowledge of any one characteristic could be used to predict the presence and level of associated characteristics.
All species studied in the subfamilies Arundinoideae, Bam- busoideae, Oryzoideae, and Pooideae (Festucoideae) possessed Cj characteristics. Within these subfamilies, there is a high probability that all species will possess the C3 photosynthetic pathway.
Within the subfamilies Eragrostoideae and Panicoideae, both Cj and Cq photosynthetic pathways are present. Both sub- families are predominantly Cd, while the exceptions apparently indicate a need for taxonomic reclassification rather than heterogeneity of photosynthetic pathway within a taxonomic division. In the Eragrostoideae, as defined by Gould (1968), the genus Uniola in the tribe Unioleae appears to possess the CJ photosynthetic pathway as reflected by ‘“C”/oo percentages. Consequently, Uniola was placed in the Oryzoideae by Smith and Brown (1973).
Within the subfamily Panicoideae, the genera Oplismenus, Succiulepis, Amphicarpum, and Isachne are C:,. The genus Punicum contains species with both C:, and CA pathways. The subgenus Paurochaetium C,) was reclassified as Sertaria by Gould (1968). The subgenus Dichanthelium contained only C, species, while Eupanicum contained species with both C:, and C + pathways. Further evaluation of the subgenus Dic- hunthelium has been reported by Brown and Smith (1975).
Adaptation and Competition
The function of the Cd pathway is, in effect, to concentrate CO2 in the bundle sheath cells, permitting the Calvin cycle to operate at more favorable concentrations of this rate-limiting substrate. This provides a more efficient mechanism for COZ fixation at low CO2 concentrations in the intercellular spaces than does C3 photosynthesis. Thus, the advantage of Cd photosynthesis is maximal when photosynthesis is operating at high light intensities and temperature, and especially when stomata1 conductance to gas exchange is low. In the case of low temperatures and light intensities the advantage would at most be marginal (Bjorkman 1976).
This adaptation correlates well with the historical concept of warm- and cool-season plants used by range scientists, verify- ing the ecological importance of such a classification. Brown ( 1978) reported that Cd plants have a greater nitrogen (N) use efficiency compared to CJ plants, which may give them an adaptive advantage, particularly on sites low in N. This is probably one of the factors responsible for the greater abun- dance of Cq species in range soils lower in fertility (White 196 1). It appears probable that the growing season of the species with the C3 pathway would coincide with the cool, moist months, while the physiological traits of Cd plants allow them to grow during the hotter, drier months. This would allow many species to occupy the same site with minimal interspecific competition (Williams and Markley 1973). The Cd pathway is an important adaptive mechanism in hot environments, but it does not necessarily provide a significant advantage in cool, moist environments (Bjorkrnan et al. 1974).
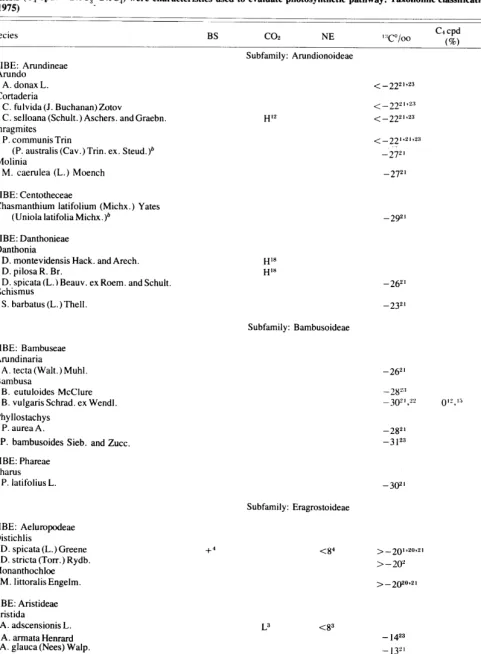
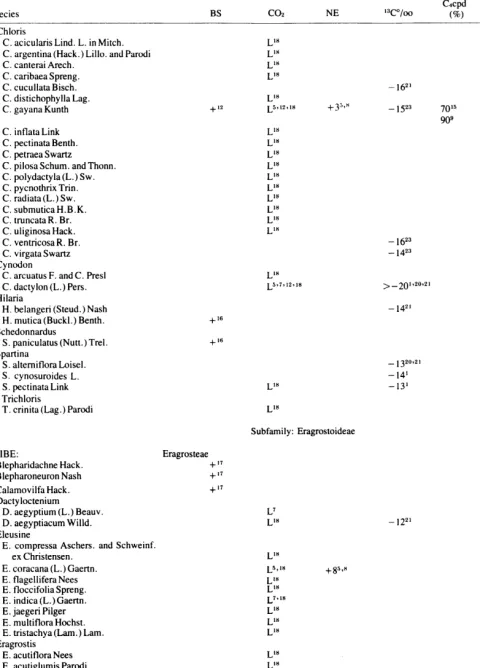
Table 1. Identification of taxa within the United States Gramineae possessing the C, or C, photosynthetic pathway. Occurrence of distinct bundle sheath cells (BS: - = CZ, + =Ca); carbon dioxide compensation point (C02:H=C3, L=C4); net enhancement of photosynthesis in oxygen deficient atmosphere NE:> +g=C < +8=C,); IRC/lPC ratio (W’/oo:< -22”oo=C, > -22”/od=C,); and occurrence of C, compounds as initial products in photosyn - thesis (C, cpd: <2%C, 2%C,) were characteristics used to evaluate photosynthetic pathway. Taxonomic classification follows that of Gould 1968,
1975)
Species BS co2 NE “‘C”/oo Ca cpd (%) C3 Cd
Subfamily: Arundionoideae T~~~IdArundineae
A. donax L. “Cortaderia
<_222”23 *
C. fulvida (J. Buchanan) Zotov
C. selloana (Schult.) Aschers. and Graebn. Phragmites
<_22”““23
*
H’2 <_22!1,23 *
P. communis Trin
(P. australis (Cav.) Trin. ex. Steud.)* “Molinia
<_221r21,z3 * -272’ *
M. caerulea (L.) Moench -272’ *
TRIBE: Centotheceae
Chasmanthium latifolium (Michx.) Yates (Uniola latifolia Michx .)*
TRIBE: Danthonieae Danthonia
D. montevidensis Hack. and Arech. D. pilosa R. Br.
D. spicata (L.) Beauv. ex Roem. and Schult. ‘Schismus
S. barbatus (L.) Thell.
TRIBE: Bambuseae Arundinaria
A. tecta (Walt.) Muhl. “Bambusa
B. eutuloides McClure B. vulgaris Schrad. ex Wend].
“Phyllostachys P. aurea A.
P. bambusoides Sieb. and Zucc.
TRIBE: Phareae Pharus
P. latifolius L.
TRIBE: Aeluropodeae Distichlis
D. spicata (L.) Greene D. stricta (Torr.) Rydb. Monanthochloe
M. littoralis Engelm.
TRIBE: Aristideae Aristida
A. adscensionis L. A. armata Henrard A. glauca (Nees) Walp. A. longiseta Steud. A. purpurea Nutt. A. temipes Cav.
A. uniplumis Lichtst in Roem. and Schult.
TRIBE: Chlorideae Bouteloua
B. curtipendula (Michx.) Tot-r. B. filifotmis (Foum.) Griffiths. B. gracilis (H.B.K.)Lag. B. hirsuta Lag. Buchloe
B. dactyloides (Nutt.) Engelm.
+”
-2921 *
H’” H’”
-26”’
-2321
Subfamily: Bambusoideae
* * * *
-2621 * _ 28’:’
_3()“‘,“’ ()I” I.5 7 *
-28”’ *
-3123 *
Subfamily: Eragrostoideae
-302’ *
~8~ >_2()1,20,2’ >-202
> _2@20*21
L3 ~8~
+‘6
+I6
L=
L’8 +g8
L’S L24 L’S
Ll8,24
- 1423 _ 13”
- 142’
>_201921
-132’ -13’
>_2(yr2l
* 10
*
*lo~ll
* *I
*lo,” *11 *10111 *10711