Weighting the key features affecting
supplier selection using machine
learning techniques
Ahmad Abdulla1 George Baryannis1
Ibrahim Badi2
1 School of Computing and Engineering, University of
Huddersfield
2 Faculty of Engineering, Misurata University, Libya
Abstract
Supplier selection is an important part of supply chain management (SCM) for any organisation to achieve their objectives. The problem has attracted great interest from academics and practitioners. The selection process starts with determining the most important criteria out of a wide range. Many academic researchers apply multi-criteria decision-making (MCDM) techniques for supplier selection. However, the complexity of such approaches may increase significantly, especially when considering a large number of suppliers and selection criteria. This paper proposes an integrated approach combining machine learning classification with the Analytic Heirarchy Process (AHP) to select and evaluate the most suitable supplier. A Decision Tree (DT) classifier is used to select the most important criteria, instead of applying AHP on the complete set of criteria. The applicability of the approach is demonstrated using data from Libyan companies. Results show that decision trees can successfully lead to a most important subset of selection criteria, which would lead to a less complex application of AHP.
Key words: Supplier selection, machine learning, decision tree.
1
INTRODUCTION
Supplier management is one of the key issues of supply chain management, as the cost of raw materials constitutes an important part of the final cost of a product, and most companies have to allocate a considerable amount of their budget on raw materials, up to 70% [1]
.
Thus, choosing the right suppliers is a critical process, and has a direct effect on the final cost reduction and profitability of a company. Since supplier evaluation and selection is a challenging process for managers of purchasing departments, it has received significant attention in literature.[2], [3].The criteria for supplier selection are generally highly dependent on individual industries and companies [4], since different companies have different management strategies, enterprise culture and competitiveness. Moreover, company background also impacts supplier selection [5]. Thus, the identification of supplier selection criteria largely requires domain expert assessment and judgment. To select the best supplier, it is necessary to make a trade-off between these qualitative and quantitative factors (weights) some of which may conflict [6].
The supplier selection process includes determining and selecting the important criteria which will be used to select the suitable suppliers from a pool of suppliers. Successful supplier selection reduces purchasing risk, maximises consumer satisfaction, and builds good relationships between purchasers and suppliers [7]. On the other hand, choosing the incorrect supplier may cause an economic problem and impact on the whole company [5]. Especially in today’s global economy ineffective supplier selection may have repercussions throughout supply chains worldwide.
Researchers have applied a wide range of multi-criteria decision making (MCDM) techniques to assist purchasing managers in (1) making the right decisions that will help their company to reach its maximum achievement; and (2) evaluating and analysing the decision-making process and the techniques used to achieve the company’s objectives. However, MCDM techniques often lead to highly complex models that are difficult to manage and evaluate. On the other hand, the recent proliferation of big data and artificial intelligence (AI) technologies have led many researchers to consider their application in aspects of operations research such as supply chain risk management [8,
9] and supplier
selection. Consequently, more and more purchasing managers are increasingly inclined to consider the application of AI techniques in supplier selection processes within their companies, aiming for increased efficiency and performance.More recently, a subset of AI techniques, machine learning (ML) have received increased attention due its success in various application areas from image classification to game AI to many decision making problems. Particularly in the case of supplier selection, some researchers have proposed the application of ML techniques, alone or in combination with traditional MCDM techniques such as the Analytic Hierarchy Process (AHP) or Data Envelopment Analysis (DEA). In most of these approaches machine learning follows the application of MCDM techniques. However, this would create issues in cases where the number of suppliers or criteria is quite high, increasing the complexity of AHP or DEA higher than what can be easily managed by participants in these processes. Instead, in this paper we propose a reverse integration, where ML is the first step in the supplier selection process, aiming to reduce the complexity of available information (suppliers or criteria) and AHP follows afterwards. Specifically, Decision Tree (DT) models are learned to classify suppliers into two classes: good and bad suppliers. Also, the DT classifer is used to retrieve the criteria importance. These results are then expected to be used in order to simplify the AHP process that follows.
2
Literature review
Selection of suppliers have received significant attention in supply chain management especially in terms of purchasing departments in any business organisation [10]. A wide range of MCDM methods have been used to select the best suppliers based on criteria identified by purchasing managers [11]. The purchasing managers evaluate the suppliers by evaluation criteria making subjective judgment [12]. Overall, there are two phases in selecting suitable suppliers. First, the decision criteria must be recognised and weighted; then, it should be decided which techniques should be used by decision makers to analyse and determine how each supplier fares against the chosen criteria. Some criteria such as quality, cost and delivery time are quantitative criteria. Conversely, qualitative criteria such as economic stability, the compatibility of top management, and company’s history are also important when selecting a supplier. Purchasing managers must implement suitable decision making approaches depending on the situation at hand.
In the remainder of this section, we summarise supplier selection research that combines MCDM techniques (such as AHP and DEA) with machine learning techniques. One of these is NN-DEA [13], which aims to address the issue incomplete data in assessment criteria. AHP-DEA is combined with Neural Network (NN) algorithms: AHP is used for the evaluation of qualitative criteria, while quantitative criteria are evaluated using DEA and the measurement of the efficient suppliers is the responsibility of NN [14]. NN models have also been used in combination with AHP, where AHP is used to calculate criteria weight and NN to select the appropriate suppliers [15,
16].
Similarly, [17] combines AHP with NN but uses Fuzzy Set Theory (FST), while [18] combines FST with AHP and cluster analysis in order to reduce the quantity of alternatives and select the best possible cluster for the selection process. Another proposed solution for supplier selection is the combination of DEA, DT and NN [19]. DEA is used to divide the suppliers into groups depending on efficiency scores; subsequently, data is used to train DT and NN algorithms, which estimate and evaluate the supplier criteria. It provides accurate classification and regression rate. The drawback of this approach is that it does not make an effort to use the intelligence gathered from groups of experts. The combination of Genetic Algorithms (GA) with NN algorithms has also been proposed [20]. GA is applied to obtain primary weights and to build a network for improving the search technique for training, whereas NN uses historical data to select the best supplier. The reverse process is followed by [21], where the potential suppliers are subjected by ANN in terms of assessing criteria. After the evaluation process, the determination of top supplier selection is based on GA. The integration of DEA with Support Vector Machines (SVM) is proposed in [22]. DEA is used to calculate efficiency scores and then SVM is used to decide on the best supplier. For the case of green supplier selection, researchers have proposed the ANN-MADA method [23], which integrates DEA, Analytic Network Process (ANP) and NN models. This combination overcomes the constraints associated with DEA models and can address the issue of missing values. A similar combination of DEA and GeneticProgramming (GP) is proposed in [24], where GP is used to deal with the complex and time-consuming calculations of the DEA method.
The common characteristic of the approaches summarised in this section is that they propose integrated methods that rely first on the application of MCDM techniques such as AHP and DEA, using their results to learn machine learning models using a number of different algorithms, from NN to DT. While this helps reduce the difficulties of complex calculations in AHP and DEA for large numbers of suppliers, it does not address the fact that the overall AHP and DEA process still remains complex: for instance, even if we use machine learning to facilitate the evaluation process using AHP criteria, we still have to work out the weights of these criteria, which may not be as feasible in cases where there is a large number of criteria or suppliers.
3
Proposed methodolgy
Based on the research gap identified in the literature review in the previous section, we propose a hybrid model combining ML with AHP, with ML being used to reduce both the number of suppliers and the number of criteria so that AHP can then be applied with lower complexity in terms of time and computation. Note that, while we have chosen AHP as the MCDM method to combine with ML, but this does not preclude using different MCDM methods like DEA. We leave this exploration to future work.
The proposed methodology basically comprises 5 main phases as shown in Figure 1. The first four phases are related to ML while AHP is the final step.
Figure 1 Proposed methodology combining ML and AHP
The remainder of this section explains in detail each phase, as applied in the particular case study of two gas and oil companies in Libya, Srit Oil and Lifeco (Libyan Norwegian Fertilizer Company). The methodology has been implemented in Python using scikit-learn [25].
3.1
Data preparation
The two companies in the case study provided two datasets relevant to the supplier selection process: one dataset containing bidders and decisions on selected bids and one containing supplier evaluation cases. The first dataset of bidders includes approximately 10,000 cases and 30 features, while the other dataset (evaluation dataset) includes 2,300 cases and 23 features. Some features are common between the two datasets.
3.1.1 Data cleaning
The success of ML algorithms heavily depends on the quality of data, hence data cleaning are required. In the majority of ML projects, the data cleaning processes actually consume most of the time of the total effort [26]. The basic objective of the process of data cleaning is identification and ratification of errors and copied data for the creation of a reliable dataset. Through such a process, the quality of the training data improves for analytics and the decision making process becomes accurate. For data cleaning purposes, different methods are applied: completion of all missing data, removal of empty rows, correction of errors in the overall structure and data reduction for the purpose of data handling [27].
In this case study, rows missing most values were removed and invalid values and structures (e.g. dates) were corrected. Moreover, columns with duplicate knowledge were removed, such as keeping only supplier codes but not their names.
3.1.2 Feature Selection
Performance of ML algorithms also relies on the initial feature selection phase. In the context of a spreadsheet-based dataset, columns are considered features. For a particular dataset, it is not always expected that the output variables is directly affected by all these columns. Irrelevant features may actually lead to a worse overall model. There are many advantages of using feature selection at the beginning of the process such as reducing the possibility of overfitting, improving classification performance, and reducing time spent during training [28]. In this case study, we applied feature selection using scikit-learn’s SelectFromModel meta-transformer.
3.1.3 Data Scaling
Data scaling refers to normalising the available data within a specific range. In some cases, this process contributes to faster calculations in ML algorithms. In this case study, data was normalised between 0 and 1 using MinMaxScaler.
3.1.4 Train-Test Split
As is common in all ML techniques, the initial dataset is divided into two: the training and testing datasets, one used to train the ML algorithm (seen data) and the other used to test the trained algorithm (unseen data). In this case study, the testing dataset encompasses 33% of the data, while the training dataset includes 67% of the data. This separation helps ensure generalisation of ML results.
3.2
Building, training and testing the model
After preprocessing the data, we are ready to apply available ML algorithms on the training and testing datasets. ML algorithms are usually classified as unsupervised, semisupervised, supervised and reinforcement learning. A decisive characteristic, especially in decision-making applications is interpretability. Some approaches, such as neural networks and deep learning use black-box algorithms whose results are not easily interpretable (if at all). In contrast, methods such as decision tree classification are more easily interpretable, since results can be expressed as a sequence of if-then-else rules. As argued in [29], results derived using AI and machine learning can only be
successfully integrated in decision-making processes within companies (such as supplier selection) if they are interpretable and justifiable. In our case study, for instance, we cannot expect purchasing and procurement managers to blindly trust the decisions of a black-box machine learning technology, but it would be easier to adopt technologies that supply explanations along with results. For these reasons, we have decided to use a decision tree classifer to build our model. A decision tree is built top-down, starting from the root node and dividing data into various subsets based on particular features features according to the information gain. A number of different parameters for the decision tree classifier were explored, in order to find the most optimal ones. Trees of maximum depth of 6 seemed to perform better, as higher maximum depths led to overfitting.
3.3
Evaluating the model
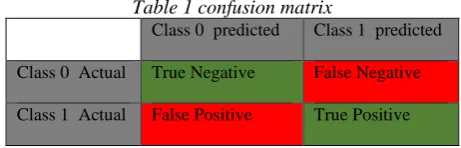
To evaluate the results of decision tree models, there are a number of metrics available. These are discussed here. A confusion matrix is a direct representation of the test results in a prediction model. Columns and rows of the matrix represent prediction class instances and actual class instances, as shown below in Table 1.
Table 1 confusion matrix
Class 0 predicted Class 1 predicted
Class 0 Actual True Negative False Negative
Class 1 Actual False Positive True Positive
True negatives represent the number of instances that are predicted correctly asnegative. False positives represent the number of times instances are incorrectly predicted as positive. False negatives show the number of instances predicted incorrect as negative. Lastly, trie positives are those instances correctly predicted as positive.
One of the advantages of this matrix is that it determines whether the system is confusing two classes (labels are flipped) or not. This matrix helps quantify how a classifer behaves and its strengths and weaknesses.
The most common evaluation metric is accuracy. Accuracy refers to the fraction of the right predictions ofthe model, defined as follows:
In the case of binary classification, negatives and positives can be used to calculate accuracy as follows (where TP is True Positive, TN is True Negative, FP is False Positive, and FN is False Negative):
Precision is defined as how frequently the prediction of positive value is correct when it is predicted. It is expressed in terms of true positives and false positives as follows:
Precision=
Recall (or sensitivity) refers to the classifier’s ability of finding all positive instances. In other words, it explains the percentage of correctly classified positive cases out of all positive cases. For each class of problems, it is defined as follows:
Recall=
F1 score is defined as the harmonic mean of precision and recall such that the best score is 1.0, and the worst score is 0.0. Speaking generally, F1 scores are low as compared to the accuracy measures as precision is embedded in their computation, followed by recall. F1 is defined as follows:
F1=
Support is referred to as the number of times the class occurred in the dataset that is specified. Structural weakness may be indicated if there is any imbalanced support in the data that is provided in training in the classifier’s reported scores and could stipulate the requirement for stratified rebalancing and sampling. Support between models doesn’t change; instead, the evaluation process is diagnosed.
A classification report combines the results of precision, recall, F1 and support, allowing comparison among the different metrics. It provides a better understanding of the behaviour of a classifier compared to accuracy, which can hide the weaknesses of the results of one class.
3.4
Integrating with AHP
The classification model built in the previous steps is used in two ways to simplify the AHP process. First, feature importances are calculated in order to decide which criteria of the supplier selection process are the most important. Also, the classifier is used to decide which suppliers are considered good and which are considered bad. Then, AHP operates on a reduced set of criteria and suppliers: only the most important features are used as criteria and only suppliers classified as good are considered in order to find the best out of all. This helps considerably reduce the complexity of AHP, allowing for a quicker decision-making process that is, however, still interpretable, due to the use of decision tree classification in the previous steps.
4
Results
This section consists of the discussion of the results of classification of suppliers using the metrics discussed earlier in Section 3.3.
4.1
Evaluation results
Classification accuracy of the decision tree classifier was 0.7615 on the training dataset and 0.765 on the testing dataset. Table 2 shows the confusion matrix of the decision tree classifier.
Table 2 Confusion Matrix of DT Bad supplier Good supplier
Bad supplier 1420 121
Good supplier 411 299
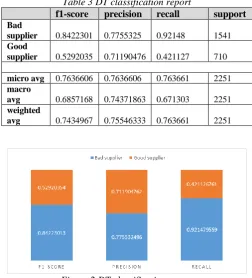
The classification report is shown in Table 3 and Figure 2.
Table 3 DT classification report
f1-score precision recall support
Bad
supplier 0.8422301 0.7755325 0.92148 1541
Good
supplier 0.5292035 0.71190476 0.421127 710
micro avg 0.7636606 0.7636606 0.763661 2251
macro
avg 0.6857168 0.74371863 0.671303 2251
weighted
avg 0.7434967 0.75546333 0.763661 2251
Figure 2 DT classification report
We note that decision tree scores for classification report (recall, precision, f1-score) was different for each class, class 0 (bad supplier) was higher accuracy than class 1 (good supplier).
4.2
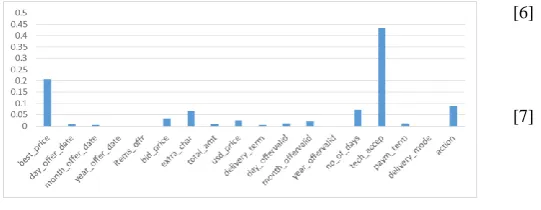
Feature importance results
The results of feature importance are shown in Figure 4. It is clear that the highest importance is for the feature of technical acceptance. This feature explains whether the technical quality of the product is good enough to be accepted. Best price is noted as the second most important feature. Both of these results are expected, since purchasing and procurement managers are expected to prioritise quality, price and the trade-off between. These results lend support to this commonly observed behaviour in supplier selection processes.
Figure 3 Feature importances
5
Conclusion
This paper proposed a hybrid methodology for supplier selection to address the high complexity of solutions that rely only on traditional MCDM approaches, such as AHP and DEA. The proposed methodology employs a decision tree classifier to classify suppliers into good and bad and to determine which features are the most important in the supplier selection process, based on historical data. These results are then used to keep only the good suppliers and only the most important criteria, which are then fed to an AHP instance, which is significantly less complex. The applicability of the proposed methodology is shown through the case study of two oil and gas companies in Libya. As future research, we intend to complete the case study by applying AHP based on the results of the decision tree classifiers using experts from the two companies. We also plan to explore alternative hybrid methodologies, for instance replacing AHP with DEA or considering classifiers other than decision trees. Finally, it would be interesting to explore whether our hybrid methodology can be delivered in the form of a service-based application [30-32], to be consumed by any purchasing or procurement department willing to utilise automated supplier selection functionality.
References
[1] O. Kilincci and S. A. Onal, "Fuzzy AHP approach for
supplier selection in a washing machine company,"
Expert Systems with Applications, vol. 38, no. 8, pp.
9656-9664, 2011.
[2] Ž. Stević, D. Pamučar, M. Vasiljević, G. Stojić, and S.
Korica, "Novel integrated multi-criteria model for supplier selection: Case study construction company,"
Symmetry, vol. 9, no. 11, p. 279, 2017.
[3] M. Vasiljević, H. Fazlollahtabar, Ž. Stević, and S.
Vesković, "A rough multicriteria approach for evaluation of the supplier criteria in automotive
industry," Decision Making: Applications in
Management and Engineering, vol. 1, no. 1, pp. 82-96,
2018.
[4] I. Badi and M. Ballem, "Supplier selection using the
rough BWM-MAIRCA model: A case study in
pharmaceutical supplying in Libya," Decision Making:
Applications in Management and Engineering, vol. 1,
no. 2, pp. 16-33, 2018.
[5] I. Badi, A. M. Abdulshahed, and A. Shetwan, "A case
study of supplier selection for a steelmaking company in Libya by using the Combinative Distance-based
ASsessment (CODAS) model," Decision Making:
Applications in Management and Engineering, vol. 1,
no. 1, pp. 1-12, 2018.
[6] P. Chatterjee and Ž. Stević, "A two-phase fuzzy
AHP-fuzzy TOPSIS model for supplier evaluation in
manufacturing environment," Operational Research in
Engineering Sciences: Theory and Applications, vol. 2,
no. 1, pp. 72-90, 2019.
[7] K. Chatterjee, D. Pamucar, and E. K. Zavadskas,
"Evaluating the performance of suppliers based on using the R'AMATEL-MAIRCA method for green supply
chain implementation in electronics industry," Journal
of cleaner production, vol. 184, pp. 101-129, 2018.
[8] G. Baryannis, S. Dani, S. Validi, and G. Antoniou,
"Decision Support Systems and Artificial Intelligence in
Supply Chain Risk Management," in Revisiting Supply
Chain Risk(Springer Series in Supply Chain
Management: Springer International Publishing, 2019, pp. 53--71.
[9] G. Baryannis, S. Validi, S. Dani, and G. Antoniou,
"Supply chain risk management and artificial
intelligence: state of the art and future research
directions," International Journal of Production
Research, 2018 2018.
[10] B. D. Rouyendegh and T. E. Erkan, "Selecting the best
supplier using analytic hierarchy process (AHP)
method," African Journal of Business Management, vol.
6, no. 4, pp. 1455-1462, 2012.
[11] A. Mardani, A. Jusoh, K. Nor, Z. Khalifah, N. Zakwan,
and A. Valipour, "Multiple criteria decision-making techniques and their applications–a review of the
literature from 2000 to 2014," Economic
Research-Ekonomska Istraživanja, vol. 28, no. 1, pp. 516-571,
2015.
[12] M. Akarte, N. Surendra, B. Ravi, and N. Rangaraj,
"Web based casting supplier evaluation using analytical
hierarchy process," Journal of the Operational Research
Society, vol. 52, no. 5, pp. 511-522, 2001.
[13] D. Çelebi and D. Bayraktar, "An integrated neural
network and data envelopment analysis for supplier
evaluation under incomplete information," Expert
Systems with Applications, vol. 35, no. 4, pp.
1698-1710, 2008.
[14] S. H. Ha and R. Krishnan, "A hybrid approach to
supplier selection for the maintenance of a competitive
supply chain," Expert systems with applications, vol. 34,
no. 2, pp. 1303-1311, 2008.
[15] S. Tang, N. Hakim, W. Khaksar, M. Ariffin, S.
Sulaiman, and P. Pah, "A hybrid method using analytic hierarchical process and artificial neural network for
supplier selection," International Journal of Innovation,
Management and Technology, vol. 4, no. 1, pp. 109-111,
2013.
[16] C. Lakshmanpriya, N. Sangeetha, and C. Lavanpriya,
"Vendor selection in manufacturing industry using AHP
and ANN," The SIJ Transactions on Industrial,
Financial & Business Management, vol. 1, no. 1, pp.
29-34, 2013.
[17] A. K. Kar, "A hybrid group decision support system for
supplier selection using analytic hierarchy process,
fuzzy set theory and neural network," Journal of
Computational Science, vol. 6, pp. 23-33, 2015.
[18] E. Bottani and A. Rizzi, "An adapted multi-criteria
approach to suppliers and products selection—An
application oriented to lead-time reduction,"
International Journal of Production Economics, vol.
111, no. 2, pp. 763-781, 2008.
[19] D. Wu, "Supplier selection: A hybrid model using DEA,
decision tree and neural network," Expert Systems with
Applications, vol. 36, no. 5, pp. 9105-9112, 2009.
[20] D. Golmohammadi, R. C. Creese, H. Valian, and J.
model using genetic algorithm," IEEE Transactions on
Neural Networks, vol. 20, no. 9, pp. 1504-1519, 2009.
[21] N. Asthana and M. Gupta, "Supplier selection using
artificial neural network and genetic algorithm,"
International Journal of Indian Culture and Business
Management, vol. 11, no. 4, pp. 457-472, 2015.
[22] A. Fallahpour, N. Kazemi, M. Molani, S. Nayyeri, and
M. Ehsani, "An Intelligence-Based Model for Supplier Selection Integrating Data Envelopment Analysis and
Support Vector Machine," Iranian Journal of
Management Studies, vol. 11, no. 2, pp. 209-241, 2018.
[23] R. J. Kuo, Y. C. Wang, and F. C. Tien, "Integration of
artificial neural network and MADA methods for green
supplier selection," Journal of cleaner production, vol.
18, no. 12, pp. 1161-1170, 2010.
[24] A. Fallahpour, E. U. Olugu, S. N. Musa, D.
Khezrimotlagh, and K. Y. Wong, "An integrated model for green supplier selection under fuzzy environment: application of data envelopment analysis and genetic
programming approach," Neural Computing and
Applications, vol. 27, no. 3, pp. 707-725, 2016.
[25] F. Pedregosa et al., "Scikit-learn: Machine Learning in
Python %J J. Mach. Learn. Res," vol. 12, pp. 2825-2830, 2011.
[26] A. Géron, Hands-on machine learning with Scikit-Learn
and TensorFlow: concepts, tools, and techniques to
build intelligent systems. " O'Reilly Media, Inc.", 2017.
[27] I. H. Witten, E. Frank, M. A. Hall, and C. J. Pal, Data
Mining: Practical machine learning tools and
techniques. Morgan Kaufmann, 2016.
[28] M. Stamp, Introduction to machine learning with
applications in information security. Chapman and
Hall/CRC, 2017.
[29] G. Baryannis, S. Dani, and G. Antoniou, "Predicting
supply chain risks using machine learning: The trade-off
between performance and interpretability," Future
Generation Computer Systems, vol. 101, pp. 993-1004,
2019/12/01/ 2019.
[30] G. Baryannis, K. Kritikos, and D. Plexousakis, "A
specification-based QoS-aware design framework for
service-based applications," Service Oriented
Computing and Applications, vol. 11, no. 3, pp.
301-314, 2017.
[31] G. Baryannis and D. Plexousakis, "WSSL: A Fluent
Calculus-Based Language for Web Service
Specifications," in 25th International Conference on
Advanced Information Systems Engineering (CAiSE
2013), Valencia, Spain, 2013, vol. 7908, pp. 256-271:
Springer Berlin Heidelberg.
[32] G. Baryannis and D. Plexousakis, "Fluent
Calculus-based Semantic Web Service Composition and
Verification using WSSL," in 9th International
Workshop on Semantic Web Enabled Software Engineering (SWESE2013), co-located with ICSOC
2013, Berlin, Germany, 2014, vol. 8377, pp. 256-270:
Springer International Publishing Switzerland.
Contact addresses:
Ahmad Abdulla and George Baryannis School of Computing and Engineering University of Huddersfield
Queensgate
Huddersfield HD1 3DH United Kingdom
E-mail: [email protected], [email protected]
Ibrahim Badi
University of Misurata Faculty of Engineering 2429 Misurata
Libya