Electronic Theses and Dissertations Theses, Dissertations, and Major Papers
2017
Investigating effects of behavioural flexibility and neuroplasticity
Investigating effects of behavioural flexibility and neuroplasticity
on acclimation success of outcrossed Chinook salmon
on acclimation success of outcrossed Chinook salmon
(Oncorhynchus tshawytscha): applications in aquaculture
(Oncorhynchus tshawytscha): applications in aquaculture
Jessica Lauren Mayrand University of Windsor
Follow this and additional works at: https://scholar.uwindsor.ca/etd
Recommended Citation Recommended Citation
Mayrand, Jessica Lauren, "Investigating effects of behavioural flexibility and neuroplasticity on acclimation success of outcrossed Chinook salmon (Oncorhynchus tshawytscha): applications in aquaculture" (2017). Electronic Theses and Dissertations. 7381.
https://scholar.uwindsor.ca/etd/7381
This online database contains the full-text of PhD dissertations and Masters’ theses of University of Windsor students from 1954 forward. These documents are made available for personal study and research purposes only, in accordance with the Canadian Copyright Act and the Creative Commons license—CC BY-NC-ND (Attribution, Non-Commercial, No Derivative Works). Under this license, works must always be attributed to the copyright holder (original author), cannot be used for any commercial purposes, and may not be altered. Any other use would require the permission of the copyright holder. Students may inquire about withdrawing their dissertation and/or thesis from this database. For additional inquiries, please contact the repository administrator via email
INVESTIGATING EFFECTS OF BEHAVIOURAL FLEXIBILITY AND NEUROPLASTICITY ON ACCLIMATION SUCCESS OF OUTCROSSED CHINOOK SALMON (ONCORHYNCHUS TSHAWYTSCHA): APPLICATIONS IN
AQUACULTURE
By
Jessica Mayrand
A Thesis
Submitted to the Faculty of Graduate Studies
through the Great Lakes Institute for Environmental Research in Partial Fulfillment of the Requirements for
the Degree of Master of Science at the University of Windsor
Windsor, Ontario, Canada
2017
by
Jessica Mayrand
APPROVED BY:
______________________________________________ D. Higgs
Department of Biological Sciences
______________________________________________ D. Heath
Great Lakes Institute for Environmental Research
______________________________________________ C. Semeniuk, Advisor
Great Lakes Institute for Environmental Research
DECLARATION OF CO-AUTHORSHIP / PREVIOUS PUBLICATION
I. Co-Authorship Declaration
I hereby declare that this thesis incorporates material that is result of joint research, as follows: I am the sole author of Chapters 1 and 4. I am the primary author of Chapter 2 of this manuscript with the contribution of my co-author and supervisor Dr. Christina
Semeniuk and collaborators Drs. Daniel Heath and John Heath. I am the primary author of Chapter 3 of this manuscript with the contribution of my co-authors Drs. Kyle
Wellband and Christina Semeniuk and collaborators Drs. Dennis Higgs, Daniel Heath and John Heath. In all cases, the key ideas, primary contributions, experimental designs, data analysis and interpretation, were performed by the author, and the contribution of co- authors was primarily through help with experimental design, laboratory funding and resources, interpretation, editing, and field assistance.
I am aware of the University of Windsor Senate Policy on Authorship and I certify that I have properly acknowledged the contribution of other researchers to my thesis, and have obtained written permission from each of the co-author(s) to include the above material(s) in my thesis.
I certify that, with the above qualification, this thesis, and the research to which it refers, is the product of my own work.
II. Declaration of Previous Publication
Thesis Chapter Publication title/full citation Publication status* Chapter 2 Behavioural variation of outcrossed
Chinook salmon (Oncorhynchus tshawytscha): Applications for aquaculture performance
Submitted to the Oecologia, October 2017
I certify that I have obtained a written permission from the copyright owner(s) to include the above published material(s) in my thesis. I certify that the above material describes work completed during my registration as a graduate student at the University of Windsor.
I declare that, to the best of my knowledge, my thesis does not infringe upon anyone’s copyright nor violate any proprietary rights and that any ideas, techniques, quotations, or any other material from the work of other people included in my thesis, published or otherwise, are fully acknowledged in accordance with the standard
referencing practices. Furthermore, to the extent that I have included copyrighted material that surpasses the bounds of fair dealing within the meaning of the Canada Copyright Act, I certify that I have obtained a written permission from the copyright owner(s) to include such material(s) in my thesis.
ABSTRACT
After generations of artificial selection and domestication of animals for consumption, unintended consequences such as inbreeding depression have impacted
production via impacts on growth and survival. Outcrossing is a common method used to negate these effects and introduce variation to the broodstock. This thesis aims to assess
how animals respond to novel environments both behaviourally and transcriptionally to captivity. Seven wild-domestic hybrid stocks of Chinook salmon (Oncorhynchus
tshawytscha) and a highly inbred domesticated stock population included as control were
used in this study to determine what, if any, effects outbreeding has on the variation of
behavioural and neural transcriptional phenotypes produced.Two behavioural assays were completed on the same set of individuals as juveniles and as adults to test for the occurrence of traits involved in the acclimation to new environments via traits such as sociality, exploration, activity, predator responsiveness and neophilia. These behaviours were then contrasted against performance at each time point and across life-history stage. We found inter-population variation in four distinct behavioural types and changes across ontogeny. In each life stage we demonstrated certain behaviours are linked to
performance. Whole brain samples were collected from juvenile and adult fish to assess via qRT-PCR mRNA expression of genes associated with a variety of neural traits
ACKNOWLEDGEMENTS
I would like to thank my supervisor Dr. Christina Semeniuk for her never-ending support, encouragement and belief in me. Tina, thank you for being an amazing role model for women in science, your passion, conviction, creativity and intelligence is truly something to strive for. I appreciate the dedication and time you have given me to make sure I was successful in everything I did. Even after hours of talking about salmon and science, I always looked forward to our conversations about our kitties. Thank you to my committee members, Dr. Dennis Higgs and Dr. Daniel Heath, for your input and suggestions that improved the design and outcome of this project.
This project would not have been possible without the support of Drs. John and Ann Heath who have welcomed research into their facilities at Yellow Island
for help in the field, in the lab and being an amazing office mate. I would especially like to thank Kevyn Janisse for her consistent help with everything from making RNAlater, designing and building the best faux-predator anyone has ever seen, assisting me with interpretations and being a shoulder to lean on. You are an amazing and talented person who I will always be indebted to. Mitch, you always made fieldwork enjoyable and are an amazingly hard worker, I thank you for all of your time, assistance and laughs. I am very grateful to my Semeniuk lab members (Meagan McCloskey, Lida Nguyen-Dang, Mitch Dender, Pauline Capelle, Theresa Warriner) for making work fun and building lasting
friendships. I will never forget all of the laughs we shared, whether it was during fieldwork or lunch at Eros. I would also like to thank my office mates Jason and Felicia
who were there to offer support, advice and friendship.
I would also like to acknowledge the GLIER staff, particularly Mary Lou Scratch, Christine Weisener and Russ Hepburn for their organization and endless assistance.
I acknowledge the Natural Sciences and Engineering Research Council of Canada, the Government of Ontario, and the University of Windsor for the funding that made this research possible.
TABLE OF CONTENTS
DECLARATION OF CO-AUTHORSHIP / PREVIOUS PUBLICATION ... iii
ABSTRACT ... v
ACKNOWLEDGEMENTS ... vi
LIST OF TABLES ... x
LIST OF FIGURES ... xiii
CHAPTER 1—GENERAL INTRODUCTION ... 1
Responses to Environmental Change ... 1
Acclimation to change ... 2
Domestication and Aquaculture ... 3
Outbreeding: Selection of traits ... 6
Animal Behaviour and aquaculture ... 7
Neural function and aquaculture ... 8
Study species ... 10
Thesis Objectives ... 11
References ... 14
Figures ... 20
CHAPTER 2—BEHAVIOURAL VARIATION OF OUTCROSSED CHINOOK SALMON (ONCORHYNCHUS TSHAWYTSCHA): APPLICATIONS FOR AQUACULTURE PERFORMANCE ... 21
Introduction ... 21
Methods ... 26
Results ... 38
Discussion ... 42
References ... 51
Tables ... 56
Figures ... 68
CHAPTER 3—INVESTIGATING ACCLIMATION TO AQUACULTURE VIA DIFFERENCES IN BRAIN GENE TRANSCRIPTION PROFILES IN OUTCROSSED CHINOOK SALMON (ONCORHYNCHUS TSHAWYTSCHA) .... 73
Introduction ... 73
Methods ... 77
Results ... 87
Discussion ... 90
References ... 99
Tables ... 105
Figures ... 121
CHAPTER 4– GENERAL DISCUSSION ... 129
Future directions ... 132
Relevance for Pacific salmon aquaculture ... 135
Recommending Traits and Stocks ... 136
Conclusions ... 138
References ... 139
Figures ... 142
LIST OF TABLES
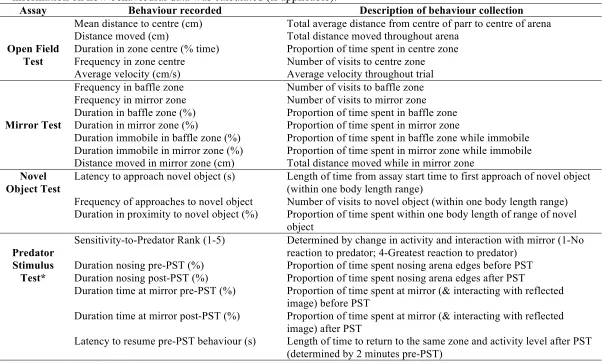
Table 2.1 Descriptions of each freshwater behavioural assay, the relevant behaviours collected and used in statistical analyses and information on how behavioural data was
calculated (if applicable)………56
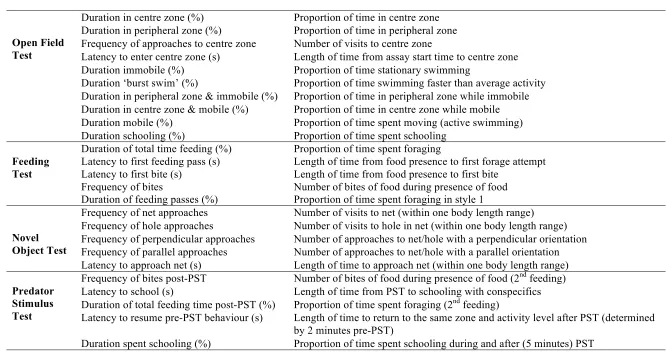
Table 2.2 Descriptions of each saltwater behavioural assay, the relevant behaviours collected and used in statistical analyses and information on how behavioural data was calculated (if applicable)………57
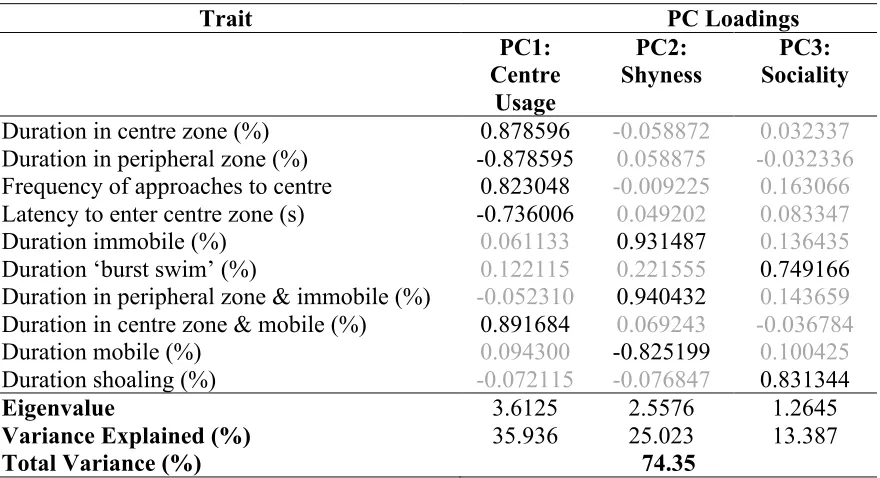
Table 2.3 Factor loadings of behavioural traits from freshwater OFT………..58
Table 2.4 Factor loadings of behavioural traits from freshwater MT………...58
Table 2.5 Factor loadings of behavioural traits from freshwater NOT and PST………..59
Table 2.6 Secord order aggregate PCA loadings generated from freshwater PCA factors……….59
Table 2.7 Factor loadings of behavioural traits from saltwater OFT………60
Table 2.8 Factor loadings of behavioural traits from saltwater FT………...60
Table 2.9 Factor loadings of behavioural traits from saltwater PST……….61
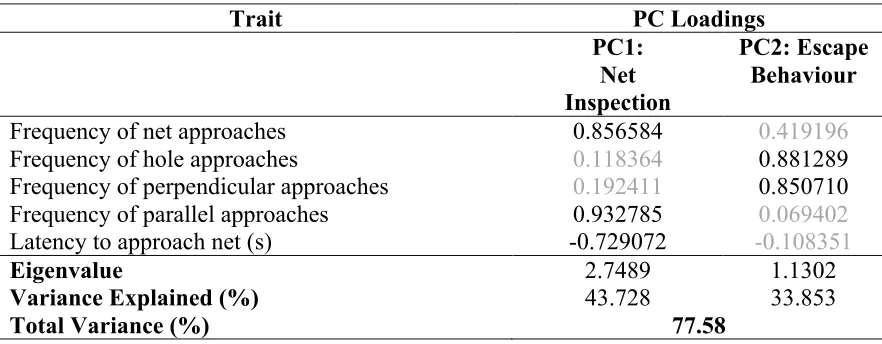
Table 2.10 Factor loadings of behavioural traits from saltwater NOT……….61
Table 2.11 Secord order aggregate PCA loadings generated from saltwater PCA factors………62
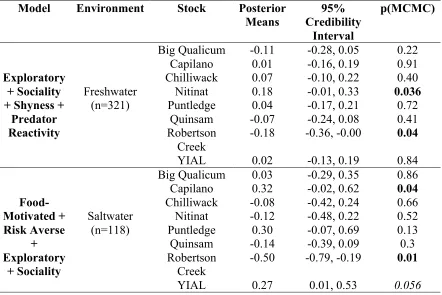
Table 2.12 MCMCglmm results for each life-history stage to determine behavioural differences between stocks. Each model included family and barrel/sea pen ID as random effects. Bolded pMCMC values indicate a statistically significant difference from the model mean. Italicized values are significant at the α = 0.10 level……….…..62
Table 2.13 Summary of linear mixed model results examining the effects of freshwater variables (behaviour, stock and behaviour x stock) on freshwater performance metrics. Family and barrel was included as random effects. Bolded values are significant at the α = 0.05 level. Italicized values are significant at the α = 0.10 level………63
Table 2.15 Summary of linear mixed model results examining the effects of freshwater variables (behaviour, stock and behaviour x stock) on saltwater behavioural phenotypes. Family was included as a random effect. Bolded values are significant at the α = 0.05 level. Italicized values are significant at the α = 0.10 level………...65 Table 2.16 Summary of linear mixed model results examining the effects of freshwater variables (behaviour, stock and behaviour x stock) on saltwater performance metrics. Family and barrel were included as random effects. Bolded values are significant at the α = 0.05 level. Italicized values are significant at the α = 0.10 level………66 Table 2.17 Summary of linear mixed model results examining the effects of freshwater variables (growth performance, stock and growth performance x stock) on saltwater performance metrics. Family and barrel was included as random effects. Bolded values are significant at the α = 0.05 level. Italicized values are significant at the α = 0.10
level………67 Table 2.18 Summary of generalized linear mixed model results examining the effects of freshwater variables (mass and behaviour) on saltwater survival. Stock, family and barrel were included as random effects………67 Table 3.1 Full list of target genes with accession numbers, functions and sequences used in this
project………...105 Table 3.2 Summary of genes chosen for candidate approach. An ‘x’ denotes which genes are being included in their effects on mass (M), biomass (B) or survival (S)…106
Table 3.3 Summary of linear mixed model results examining the effects of stage, mass, population and their interactions on transcription of neural, stress, behavioural and growth genes. Family and barrel was included as random effects. P-values listed are raw and significance is determined post-FDR correction. Bolded values are significant at the
α = 0.05 level………...107
Table 3.9 Summary of linear mixed model results examining the effects of
LIST OF FIGURES
Figure 1.1 Methodological overview of each data chapter with brief life history
information……….20
Figure 2.1 Map of Vancouver Island and relevant mainland. The northern-most green circle (YIAL) represents the geographic location of Yellow Island Aquaculture Ltd. where all research was conducted. All other coloured circles represent tributaries where sires originated………....………...68
Figure 2.2 This is a schematic of the arena and zones assigned for the freshwater behavioural assay for analysis. The fish placed into the arena were tracked across the different regions shown above, when appropriate; Centre/Peripheral zones, Mirror zone and Baffle zone………..69 Figure 2.3 Mean freshwater biomass of each stock, calculated at the family level then averaged. Bars with the same letters are not significantly different. Letters generated by Tukey post-hoc test………70 Figure 2.4 Mean saltwater biomass of each stock, calculated at the family level then averaged. Bars with the same letters are not significantly different. Letters generated by Tukey post-hoc test………70 Figure 2.5 Visual representation of freshwater mean behavioural PCA scores per stock. Statistical differences determined using MCMCglmm and presented in Table 2.12. Stocks are ordered by decreasing biomass according to Figure 2.3. This is for visual purposes only………71 Figure 2.6 Visual representation of saltwater mean behavioural PCA scores per stock. Statistical differences determined using MCMCglmm and presented in Table 2.12. Stocks are ordered by decreasing biomass according to Figure 2.4. This is for visual purposes only………72 Figure 3.1 Average population transcription for each target gene associated with stress response, behaviour and somatic growth. For visual inspection only, statistical differences
found in Table 3.3……….121
Figure 3.2 Average population transcription for each target gene associated with
neurogenesis and neuroplasticity. For visual inspection only, statistical differences found in Table 3.3………...123 Figure 3.3 Genes with statistically significant differences in transcription between
Figure 3.4 Visual representation of PCoA based on gene averages. Non-statistical clusters are circled to show associations of genes. Gene symbols are determined by function………128 Figure 4.1 Comparing average delta Ct values of transcriptional profiles between
Robertson Creek and all stocks. A bar in greater magnitude represents
CHAPTER 1—GENERAL INTRODUCTION
Responses to Environmental Change
Natural ecosystems and the animal communities that inhabit them have been exposed to unprecedented rates of degradation, invasions and alterations for the last 70 years as part of human-induced environmental changes such as climate change and pollution, and overexploitation of resources (Waters et al. 2016). It has been posited that phenotypic variation of organisms within a population is the key to species survival in new and changing environments (Sih et al. 2011). Populations with diverse phenotypes promote population persistence by bet hedging; there is an increased likelihood that at least one phenotype can respond adaptively to stressors (Forsman 2013). In addition, within-individual phenotypic plasticity can also produce phenotypic variation that can be adaptive across context, time and environmental stressors (Nussey et al. 2005). For example, wild non-migratory birds adjust their basal metabolic rates with seasonal changes while migratory birds adjust theirs based on their migratory cycles (McKechnie 2007). Behavioural flexibility is one example of within-individual phenotypic plasticity that allows an organism to cope with environmental change. Flexibility is adaptive to variable environments as an individual that is more flexible in their behaviour typically relies on more accurate detail from their changing environment and responds more appropriately in contrast to individuals that behave consistently regardless of the context (Coppens et al. 2010).
species found an upregulation of genes with known neuroplastic functions in response to increased CO2 in the three-spined stickleback, but not other species, suggesting
differential coping mechanisms to environmental changes (Lai et al. 2017). Such genomic variation in response to environmental change highlights the fine-scale mechanisms that underlie short-term and long-term environmental adaptations (Cossins and Crawford 2005).
Acclimation to change
While environmental change can select for certain phenotypes over others over time, acclimation is the ability of an organism to respond adaptively to a stressor or new environment without a change in genotype, with positive consequences for survival and condition (Withers 1992; Hendry et al. 2008). More specifically, Peck and colleagues (2014) defined acclimation as the change from one physiological stable state to another in response to change. An organism that successfully acclimates may respond via
role in cold acclimation (Tang et al. 1999). The study of the impact of environmental variability on the performance of individuals via their (plastic) phenotypic responses to this change is important for understanding and eventually predicting how organisms and populations may persist under different kinds of human-induced, rapid ecological change (HIREC; Sih et al. 2011 , Bozinovic et al. 2016, Schunter et al. 2016)
Domestication and Aquaculture
Captive conditions is one such form of HIREC, as animals in captivity can experience a unique set of selection pressures in comparison to their wild counterparts, as captivity creates an altered physical and biological environment that differs from the wild, such as: reduced or novel species interactions (i.e., competitors, prey, and predators), confinement stressors, and exposure to novel diseases and pollution (e.g., noise, light), all ultimately resulting in potential selection of phenotypes that differ from their wild source (Nelson et al. 2013). Acclimation to these new selection pressures can too, be behavioural,
Finally, a study on wild Atlantic salmon and wild-domestic hybrids raised in the same environment found transcriptome differences at across life stage: hybrid sac feeding alevin experienced a down-regulation of transcription in genes associated with the nervous and immune system and during exogenous feeding a down-regulation of environmental information processing (Bicskei et al. 2014). Indeed, even a single generation in captivity can cause changes in adaptive behavioural and developmental plasticity (Mason et al. 2013).
Practices in which captive animals are raised for consumption focus on raising many large animals as quickly and as efficiently as possible (Kadri et al. 2012). Domestication is the cultivation of a population of organisms using artificial selection combined with non-random mating to accumulate a set of desirable traits (like tameness or size; Gjedrem 1985; Huntingford 2004). Bacterial, viral and disease resistance, survival, rapid growth, and age at maturity are also potential traits that can be selected for, provided that these traits are also heritable (Gjedrem 1985; Gjerde 1986; Wang et al. 2012). For example, Gjedrem (1985) found that the size of Atlantic salmon (Salmo salar) could be increased by 30% with each generation when selecting for larger-sized dams and sires.
trout (Salmo trutta) in comparison to domestic sea trout raised in the same environment (Lepage et al. 2000) and eye and brain sizes are smaller in domesticated strains of coho salmon (Oncorhynchus kisutch) when standardized to body size (Devlin et al. 2012). Artificial selection, while powerful, cannot only inadvertently select for unfavourable behavioural, neural, and stress-coping traits, but can lower genetic variation within a population (Heath et al. 2003). This can be attributed to nonrandom mating and closed, small effective population sizes. Inbreeding is an extreme form of nonrandom mating and causes a decrease in heterozygosity, which can increase the expression of deleterious recessive alleles and therefore reduce fitness (Coltman et al. 1998). Inbreeding depression can therefore limit the benefits of artificial selection, where inbred offspring exhibit lower fitness levels than their parents (decrease in size, lower reproductive success; Kincaid 1976). Resultantly, decreased genetic variation and/or overly bold or aggression phenotypes can limit a population’s ability to persist in a changing environment, including in captivity(Lacy 1987).
The aquaculture industry is one of the fastest growing industries for food production, providing an important source of protein (Naylor et al. 2001). Aquaculture facilities are estimated to provide more than one third of the world’s seafood
consumption (Naylor et al. 2001). Canada is the eighth largest exporter of seafood (Department of Fisheries and Oceans Canada 2008), and in 2010 produced an
approximate value of 900 million dollars, which provides thousands of jobs and revenue (Department of Fisheries and Oceans Canada 2010). In Canada, the production of Pacific and Atlantic salmon dominate the aquaculture industry (Stats Canada 2013). The
to rapidly and efficiently produce a marketable fish size to achieve maximum economic gain (Gjedrem 2000). However, salmon aquaculture, too, can suffer from the same negative impacts caused by domestication for production purposes: increased aggression (often associated with exploratory behaviours and boldness; Conrad et al. 2011), reduced size of brain structures which can affect foraging and predator avoidance behaviours and reduce phenotypic plasticity important for acclimation to stressors (Marchetti and Nevitt 2002), repetitive and unnecessary behaviours (Mason 2013), and reduced genetic
variation that can result in reduced survival, and therefore, disadvantageous production costs.
Outbreeding: Selection of traits
Increasing genetic variation in a population in aquaculture can be completed by introducing novel genetic material (outbreeding; Bryden et al. 2004; Cote et al. 2014). Outbreeding can be used as a tool to introduce genetic variation to a population with high genetic similarity created by inbreeding and artificial selection. This increase in
sources that can not only increase genetic diversity, but also generate appropriate
phenotypes for captive conditions and thus contribute to the optimal growth, survival, and acclimation success of individuals in captivity (Neff et al. 2011).
Animal Behaviour and aquaculture
In addition to considering the degree to which behavioural traits can (or cannot) change, determining which behavioural traits are important for acclimation and
production is important for aquaculture farming. Behavioural assays can be employed to target behaviours from the five axes of animal behaviour and personality that have both direct and indirect bearing on performance in aquaculture: neophilia, exploration, activity levels, sociality, foraging and anti-predator reactions (Conrad et al. 2011). Neophilia and exploration are indicators of acclimation (Sol et al. 2013) as they can assess latency to explore/investigate and hence recovery rate; while foraging success and activity levels may be linked to growth potential (and eventual flesh quality at harves). A review by Huntingford in 2004 cites social interactions (aggression), foraging and anti-predator behaviours to be distinct between domestic and wild fishes, suggesting that these behaviours are important to consider in outbred aquaculture stocks one generation removed from the wild. To maximize production, behaviours that are necessary to maximally and successfully rear anadromous salmon at each life stage should additionally be considered, since conditions are variable; for instance, in a hatchery setting there is a barren and artificial environment with transient disturbances, while conditions in a net pen are semi-natural and susceptible to unpredictable environmental changes.
Neural function and aquaculture
in the brain) and stress responses via the neuroendocrine system. Studies on the structural changes of the brain in response to domestication and captivity have typically involved reductions in size and plasticity (Huntingford 2004). Neuroplasticity supplies a basis for learning and behavioural stress coping (Sorensen et al. 2013), which should aid in acclimation to novel stressors. Fish with a high stress response to common aquaculture stressors could exhibit poor growth and immunocompetence (Barton and Iwama 1991), which would negatively impact aquaculture production. One way to quantify these responses is to look at gene expression. We chose genes associated with these processes to determine their potential contribution to the acclimation and growth of Chinook salmon aquaculture.
Gene expression is the production of functional protein via transcription and translation, where information encoded in genes is used to produce a gene product (e.g. functional protein). The first step, transcription, involves the conversion from stable double stranded DNA to single-stranded messenger RNA by the RNA polymerase enzyme. A transcriptional response can occur when an organism is responding to environmental changes or stressors (Wellband and Heath 2017) and domestication (Devlin et al. 2008). This response will alter protein levels and creates changes in cell function to appropriately respond to and cope with environmental changes (Clancy et al. 2008). Transcriptional variation is linked to phenotypic variation wherein some
and intra-population differences, which can be important considerations when selecting outbreeding sources.
Molecular genetic tools have become increasingly popular as a means to study fisheries management and aquaculture improvement. Recent studies have explored the use of gene expression to determine optimal broodstock selection to improve the production of aquaculture where tools are developed to select for growth rates, disease resistance and food efficiencies (Nielsen and Pavey 2010). Therefore, transcription can be used as a means to study the response of multiple domestic-wild hybrid stocks to a novel environment and determine if the expression of gene(s) can affect acclimation success. Candidate genes associated with neural function, as well as stress and behaviours can be used to quantify responses to novel environments and to determine whether there is a relationship between neuroplasticity and successful acclimation (Sorenson et al. 2013). Creating transcriptional profiles by determining how transcription of several genes may be correlated offers one the additional opportunity to see how genes function as a part of a network; and their capability to predict performance requires the examination of multiple genes together (Fischer et al. 2016, Filteau et al. 2013).
Study species
die. This unique mechanism has facilitated genetic isolation of populations and evolution of population-specific adaptations to biotic and abiotic factors in their streams (Dittman and Quinn 1996). They therefore provide an excellent study system to determine whether behavioural and transcriptional variation of neural and stress genes exists among
populations. Since they undergo a natural shift in habitat, they should have the underlying mechanism of flexibility to acclimate to novel environments as well, and maximize alternative goals at different life stages.
Thesis Objectives
My thesis seeks to determine whether ideal behavioural and neural transcriptional phenotypes for aquaculture exist in the first generation of seven wild-domestic hybrid populations bred in captivity, with the overall goal of selecting one high-performing source for outbreeding stock selection. To carry out my research, I used a series of behavioural assays and explorative and inferential statistics to i) quantify behavioural types for each population at juvenile and adult stages (Figure 1.1), and ii) determine whether certain behavioural types are related to acclimation in both juvenile and adult fish using survival and growth as metrics of acclimation. Transcriptional profiles and candidate gene transcription of neural responses (neuroplasticity, stress and behaviour) were performed on juveniles and adult brains (Figure 1.1) to assess whether i)
transcriptional profiles play a role in the acclimation success of hybrid populations in captive conditions - aquaculture.
The breeding design for this study resulted in one fully domestic control
population where milt and eggs were collected from a highly inbred domestic population (YIAL) and seven hybrid wild-domestic populations where milt was collected from seven regionally sourced Chinook salmon populations and crossed with eggs from YIAL. In Chapter 2 I first assess whether variation in behavioural types persist within and among the hybrid offspring, and if so, if any can be related to high growth rate and survival across the fresh- and saltwater life-history stages. Behavioural assays were completed at two time points (June 2014 and May 2015) and the same individuals were followed from juveniles to adults (Figure 1.1). In Chapter 3, I examine whether neural transcriptional profiles or a candidate gene approach is better at predicting the
acclimation success of juveniles and adults to develop genetic tools that can assay for the expression of genes that confers desirable responses to life in captivity. Brains were collected at two time points, June 2014 from parr in fresh water and June 2015 from adults in salt water (Figure 1.1). By measuring behavioural and genomic traits across many populations it provides us with a unique opportunity to investigate the effects of phenotypic variation to environmental change among multiple populations and across multiple fields of disciplines. By examining the effects of behavioural and genomic traits on key metrics important to aquaculture (survival and growth) during the early transition of populations integrated into aquaculture conditions, my thesis as a whole represents a unique examination of whether salmon from different populations and across
References
Barton BA, Iwama GK. 1991. Physiological changes in fish from stress in aquaculture with emphasis on the response and effects of corticosteroids. Annu Rev Fish Dis 1:3–26. Bell AM, Hankison SJ, Laskowski KL. 2009. The repeatability of behaviour: a meta-analysis. Anim Behav 77:771-783.
Berejikian BA. 1995. The effects of hatchery and wild ancestry and experience on the relative ability of steelhead trout fry (Oncorhynchus mykiss) to avoid a benthic predator. Can J Fish Aquat Sci 52:2476-2482.
Bicskei B, Bron JE, Glover KA, Taggart JB. 2014. Comparison of gene transcription profiles of domesticated and wild Atlantic salmon (Salmo salar) at early life stages, reared under controlled conditions. BMC Genomics 15:884.
Bozinovic F, Sabat P, Rezende EL, Canals M. 2016. Temperature variability and thermal performance in ectotherms: acclimation, behaviour, and experimental
considerations. Evol Ecol Res 17:111-124
Brown G, Ferrari M, Malka P, Fregeau L, Kayello L, Chivers D. 2013. Behavioral Variation Shows Heritability in Juvenile Brown Trout Salmo Trutta. Beh Ecol Sociobiol 67:43-51.
Bryden CA, Heath JW, Heath DD. 2004. Performance and heterosis in farmed and wild Chinook salmon (Oncorhynchus tshawyacha) hybrid and purebred crosses. Aquaculture 235:249-261.
Christie MR, Marine ML, French RA, Blouin M. 2011. Genetic adaptation to captivity can occur in a single generation. P Natl Acad Sci 109:238-242.
Clancy S. 2008. DNA transcription. Nature E 1:41.
Coltman DW, Bowen WD, Wright JM. 1998. Birth weight and neonatal survival of harbor seal pups are positively correlated with genetic variation measured microsatellites. P Roy Soc B-Biol Sci 265:803-809.
Conrad JL, Weinersmith KL, Brodin Y, Saltz JB, Sih A. 2011. Behavioural syndromes in fishes: a review with implications for ecology and fisheries management. J Fish Biol 78:395-435.
Cossins AR, Crawford DL. 2005. Opinion: Fish as models for environmental genomics. Nat Rev Genet 6:324.
Cote J, Roussel JM, Le Cam S, Evanno G. 2014. Outbreeding depression in Atlantic Salmon Revealed by Hypoxic Stress During Embryonic Development. Evol Biol 41:561-571.
Debes P, Normandeau E, Fraser D, Bernatchez L, Hutchings J. 2012. Differences in transcription levels among wild, domesticated and hybrid Atlantic salmon (Salmo salar) from two environments. Mol Ecol 21:2574-2587.
Devlin RH, Sakhrani D, Tymchuk WE, Rise ML, Goh B. 2008. Domestication and growth hormone transgenesis cause similar changes in gene expression in coho salmon (Oncorhynchus kisutch). P Natl Acad Sci USA106:3047-3052.
Devlin RH, Vandersteen WE, Uh M, Stevens ED. 2012. Genetically modified growth affects allometry of eye and brain in salmonids. Can J Zool 90:193-202.
Dittman A, Quinn T. 1996. Homing in Pacific salmon: mechanisms and ecological basis. J Exp Biol 199:83-91.
Edmands S. 2007. Between a rock and a hard place: evaluating the relative risks of inbreeding and outbreeding for conservation and management. Mol Ecol 16: 463–475. Evans ML, Hori TS, Rise ML, Fleming IA. 2015. Transcriptomic Responses of Atlantic Salmon (Salmo salar) to Environmental Enrichment during Juvenile Rearing. PLoS One 10: e0118378.
Filteau M, Pavey SA, St-Cyr J, Bernatchez L. 2013. Gene coexpression networks reveal key drivers of phenotypic divergence in lake whitefish. Mol Biol Evol 30:1384–1396. Fischer EK, Ghalambor CK, Hoke KL. 2016. Can a Network Approach Resolve How Adaptive vs Nonadaptive Plasticity Impacts Evolutionary Trajectories? Integr Comp Biol, 56: 877–888.
Forsman A. 2013. Effects of genotypic and phenotypic variation on establishment are important for conservation, invasion, and infection biology. P Natl Acad Sci USA 111:302-307.
Gjedrem T. 2000. Aquatic improvement of cold-water fish species. Aquac Res 31:25-33.Gjerde, B. 1986. Growth and reproduction in fish and shellfish. Aquaculture 57:37-55.
Groot C, Margolis L. 1991. Pacific Salmon Life Histories. UBC Press. He X, Wilson CC, Wellband KW, Houde ALS, Neff BD, Heath DD. 2015.
Transcriptional profiling of two Atlantic salmon strains: implications for reintroduction into Lake Ontario. Conserv Genet 16:277-287.
Healey MC. 1991. Life history of chinook salmon (Oncorhynchus tshawytscha). In: Groot C, Margolis L. (Eds) Pacific Salmon Life Histories. UBC Press, Vancouver, pp. 311–394.
Heath DD, Heath JW, Bryden CA, Johnson R, Fox CW. 2003. Rapid evolution of egg size in captive-reared salmon. Science 299:1738-1740.
Hendry AP, Farrugia TJ, Kinnison MT. 2008. Human influences on rates of phenotypic change in wild animal populations. Mol Ecol 17:20-29.
Hill MS, Zydlewski GB, Gale WL. 2006. Comparisons between hatchery and wild steelhead trout (Oncorhynchus mykiss) smolts: physiology and habitat. Can J Fish Aquat Sci 63:1627-1638.
Hofmann H. 2002. Functional genomics of neural and behavioural plasticity. Dev Neurobiol 54: 272–282.
Huntingford FA. 2004. Implications of domestication and rearing conditions for the behaviour of cultivated fishes. J Fish Biol 65: 122–142.
Kadri S, Huntingford FA, Jobling M. 2012. Aquaculture and Behaviour. Ames, IA: Wiley-Blackwell. Print.
Kihslinger RL, Lema SC, Nevitt GA. 2006. Environmental rearing conditions produce forebrain differences in wild Chinook salmon Oncorhynchus tshawytscha. Comp Biochem Physiol A Mol Integr Physiol 145:145–151
Kincaid HL. 1976. Effects of inbreeding on rainbow trout populations. Trans Am Fish Sci 105:273-280.
Kolstad K, Heuch P, Gjerde B. 2005. Genetic variation in resistance of Atlantic salmon to the salmon louse Lepeophtheirus salmonis. Conference: International Symposium on Genetics in Aquaculture 247:145-151.
Lai F, Fagernes CE, Bernier NJ, Miller GM, Munday PL, Jutfelt F, Nilsson GE. 2017. Responses of neurogenesis and neuroplasticity related genes to elevated CO2 levels in the brain of three teleost species. Biol Lett 13: 20170240.
Lacy RC. 1987. Loss of Genetic Diversity from Managed Populations: Interacting Effects of Drift, Mutation, Immigration, Selection, and Population Subivision. Conserv Biol 1:143-158.
Lepage O, Overli O, Petersson E, Jarvi T, Winberg S. 2000. Differntial Stress Coping in Wild and Domesticated Sea. Brain Behav Evolut 56:259-268.
Marchetti MP, Nevitt GA. 2003. Effects of hatchery rearing on brain structures of rainbow trout, Oncorhynchus mykiss. Environ Biol Fish 66:9–14.
Mason G, Burn CC, Dallaire JA, Kroshko J, Kincaid HM, Jeschke JM. 2013. Plastic animals in cages: behavioural flexibility and responses to captivity. Anim Behav 85:1113-1126.
McKechnie AE. 2008. Phenotypic flexibility in basal metabolic rate and the changing view of avian physiological diversity: a review. J Comp Phys B 178:235-247.
Murren CJ, Auld JR, Callahan H, Ghalambor CK, Handelsman CA, Heskel MA, Kingsolver JG, Maclean HJ, Masel J, Maughan H, Pfennig DW, Relyea RA, Seiter S, Snell-Rood E, Steiner UK, Schlichting CD. 2015. Constraints on the evolution of phenotypic plasticity: limits and costs of phenotype and plasticity. Heredity 293-301. Naylor RL, Williams SL, Strong DR. 2001. Aquaculture—A Gateway for Exotic Species. Science 294:1655-1656.
Neff BD, Garner SR, Pitcher TE. 2011. Conservation and enhancement of wild fish populations: preserving genetic quality versus genetic diversity. Can J Fish Aquat Sci 68:1139-1154.
Nelson AC, Cauceglia JW, Merkely SD, Youngson NA, Oler AJ, Nelson RJ, Cairns BR, Whitelaw E, Potts WK. 2013. Reintroducing domesticated wild mice to sociality induces adaptive transgenerational effects on MUP expression. P Natl Acad Sci 110:19848-19853.
Nielsen JL, Pavey SA. 2010. Perspectives: Gene expression in fisheries management. Curr Zool 56:157-174.
Peck LS. 2011. Organisms and responses to environmental change. Marine Genom 4:237-243.
Peck LS, Morley SA, Richard J, Clark MS. 2014. Acclimation and thermal tolerance in Antarctic marine ectotherms. J Exp Biol 217:16-22.
Remen M, Oppedal F, Torgersen T, Imsland AK, Olsen RE. 2012. Effects of cyclic environmental hypoxia on physiology and feed intake of post-smolt Atlantic salmon: Initial responses and acclimation. Aquaculture 326:148-155.
Schunter C, Welch MJ, Ryu T, Zhang H, Berumen ML, Nilsson GE, Ravasi T. 2016. Molecular signatures of transgenerational response to ocean acidification in a species of reef fish. Nat Clim Change 6:1014-1018.
Sih A, Ferrari MC, Harris DJ. 2011. Evolution and behavioural responses to human- induced rapid environmental change. Evol Appl 4:367–387.
Sih, A. 2013. Understanding variation in behavioural responses to human-induced rapid environmental change: a conceptual overview. Anim Behav 85: 1077-1088.
Sol D, Lapiedra O, Gonzalez-Lagos C. 2013. Behavioural adjustments for a life in the city. Anim Behav 85:1101-1112.
Sørensen C, Johansen IB, Øverli O. 2013. Neural plasticity and stress coping in teleost fishes. Gen Comp Endocrin. 181:25-34.
Tang SJ, Su KH, Su GH, Lin G, Lin WW, Chuang MJ. 1999. Cold-induced ependymin expression in zebrafish and carp brain: implications for cold acclimation. FEBS Lett 459:95–99.
Wang L, Shi X, Su Y, Meng Z, Lin H. 2012. Loss of Genetic Diversity in the Cultured Stocks of the Large Yellow Croaker, Larimichthys crocea, Reavealed by Microsatellites. Int J Mol Sci 13:5584-5597.
Waters CN, Zalasiewicz J, Summerhayes C, Barnosky AD, Poirier C. 2016. The Anthropocene is functionally and stratigraphically distinct from the Holocene. Science 351:137.
Wellband KW, Heath DD. 2017. Plasticity in gene transcription explains the differential performance of two invasive fish species. Evol Appl 10:563-576.
Withers PC. 1992. Comparative animal physiology. New York: Saunders College Publishing, pp. 122-191.
Figures
CHAPTER 2—BEHAVIOURAL VARIATION OF OUTCROSSED CHINOOK SALMON (ONCORHYNCHUS TSHAWYTSCHA): APPLICATIONS FOR
AQUACULTURE PERFORMANCE
Introduction
Over the past several decades aquaculture has undergone rapid growth (FAO 2016) to meet consumer demands that natural populations can no longer sustain (Allendorf et al. 1997, Pauly et al. 2002, Merino 2012), emphasizing the importance of efficiency and welfare of aquaculture practices. As of 2010, Canada has become the fourth largest producer of farmed salmon with more than half of this production located in British Columbia (DFO, 2013). While Atlantic salmon (Salmo salar) is the predominant species raised for aquaculture on the west coast of Canada (Withler et al. 2005), the Pacific Chinook salmon (Oncorhynchus tshawytscha) is being pursued as an alternative choice due to its high price value (Naylor 2003), and the potential for reduced ecosystem
impacts in comparison to those purportedly associated with raising exotic species (Naylor 2003, Morton 2016). Because the production of finfish is crucial to Canada’s economy and as a sustainable food source (Fisheries and Oceans Canada 2013), an important consideration is the maintenance of healthy genetic stocks via supplementation and breeding practices, and developing screening practices to ease the transition, acclimation, and adaptation of wild stocks into captivity when necessary to maximize food production.
salmonids and their captive-raised counterparts, where studies have found differences in morphological characteristics (Coho salmon: Swain 1991, Fleming et al. 2011), survival and growth rates (steelhead trout: Reisenbichler and McIntyre 1977), and agonistic behaviours (Coho salmon: Einum and Fleming 2001). These selection pressures can act rapidly as well; for example, the size of Atlantic salmon can be increased by 30% in a single generation while using large body size as a determining factor for brood stock selection (Gjedrem 1985). The act of selecting for specific traits such as growth or disease resistance in aquaculture has led to practices in choosing phenotypically similar individuals for brood stock selection, resulting in ever smaller pools of individuals to sample from. Consequently, the potential for increased inbreeding depression can inadvertently occur, resulting in a decrease in genetic variation and subsequent reduced survivorship through the exposure of deleterious alleles (Edmands 2007), and even reduced size (Kincaid 1983).
To redress and/or circumvent inbreeding within broodstocks, intentional hybridization of the captive population to a closely related wild or other domestic
population (outbreeding) is performed as it can infuse new genetic material into an inbred line. This practice can result in either desired heterosis, or (multi-generational)
generation(s) of selection, captive breeding can directly select for adaptive traits and indirectly select for maladaptive traits (Christie et al. 2011; Einum and Fleming 2001).
One of the challenges of outbreeding captive anadromous salmon is
accommodating their evolutionary transition from fresh water to salt water. This natural change in habitat should require salmon to possess a degree of behavioural flexibility to respond adaptively to multiple environments and changing stimuli over time (White et al. 2013). However, desirable behaviours for maximizing “aquaculture” fitness (i.e., biomass – number and size of fish) may be different than the selective pressures in the wild, and equally may vary across aquaculture environments due to different producer goals at each stage. In the freshwater stage, aquaculture practices should attempt to prioritize
habituation to artificial stressors. The ideal fish would therefore possess a behavioural phenotype that displays adaptive flexibility, where their behaviour is guided by stimuli from the environment, and they respond adaptively (Coppens et al. 2010). In the freshwater aquaculture environment, this would be juvenile fish that exhibit low anti-predatory behaviour and aggressiveness (wasted energy; results in bimodal size
all still critical. Overall, efficiently responding to environmental stimuli while
maintaining appropriate foraging behaviours can result in optimal survival and growth. Consequently, stocks ultimately selected for outbreeding that exhibit the potential to respond to environmental variation through behavioural flexibility may be most likely to perform well in captivity by responding well to/coping with changes and novel stimuli (Dingemanse and Wolf 2013).
sociality, food-motivation and anti-predator reactions. These behaviours, representing the five broad axes of animal behaviour and personality (Conrad et al. 2011), are relevant indicators of flexibility (neophilia, exploration, predator recovery; Sol et al. 2013), and growth potential (foraging- and activity levels), and are potential screening targets for aquaculture production (Huntingford and Adams 2005).
Methods
Animal husbandry
All fish were raised at Yellow Island Aquaculture Limited (YIAL), a Pacific salmon hatchery and aquaculture facility located on Quadra Island, off the eastern coast of Vancouver Island in British Columbia [Lat - N 50° 7' 59.124", Long - W 125° 19'
51.834"]. Gametes were collected in October 2013 and fertilized November 2, 2013. The dams used in the breeding design were the offspring of a self-fertilized functional
hermaphrodite Chinook salmon (produced through hormonal manipulation; Komsa et al. 2012). This produced highly inbred, genetically homogenous offspring to limit maternal effects (Heath et al. 1999). Eggs were collected from 17 YIAL dams, pooled and then divided into 80 groups. Milt was retrieved from seven Salmon Enhancement Program hatcheries (Figure 2.1) on Vancouver Island and the lower mainland, and from the YIAL domestic broodstock. Each of the eight stocks contributed milt from 10 sires, each of which then fertilized the 80 groups of eggs. This resulted in 10 families per stock (total n=80).
barrels (n=160). The hatchery contained a flow through system, and water temperature and dissolved oxygen were monitored daily and maintained at 10-12o C and above 80%, respectively. The fry were divided in equal densities by family in duplicate and fed to satiation. All fish were tagged with passive integrated transponder (PIT) tags from June 12 to June 16, 2014 for future identification and received Vibrio vaccination on July 7, 2014. After PIT tagging, the parr were transferred from their family-specific replicate barrels to mixed-stock recovery troughs (in duplicate) for preparation for vaccination and transfer to saltwater net pens. On August 11 and 12, 2014 tagged fish were transferred to
sea net pens (4.6m x 4.6m x 4.6m) in the Pacific Ocean (50°7′N and 125°19′W) with 500
fish in each net pen, divided by stock and in duplicates (n=16 pens). Temperature and dissolved oxygen was measured weekly and pen temperature ranged from 7-8o C and above 60%, respectively. Each pen was fed several times daily to satiation.
Freshwater behavioural assay
From June 21 to June 27, 2014, a total of 20 behavioural trials were completed between 7am to 2pm. For each trial, a total of 24 opaque arenas, as shown in Figure 2.2 (Aquatic Habitats Inc, Apopka, Fl.; 9L capacity, 22.7 cm x 34.4 cm x 19cm) were arranged in grid pattern. Two GoPro cameras (Woodman Labs, Inc., USA) were ceiling-mounted to ensure full arena coverage. Each arena had a constant water source and overflow drain to ensure constant water level, temperature and oxygenation, similar to that of their housing barrels.
individuals from all of the 10 families per stock. Although individuals were sampled from all 10 families for each stock, there was not equal representation (between 2 -14
individuals were randomly sampled from each family).
Once each individual had been placed into their respective arenas, a transparent plexiglass lid was placed over the arena to ensure no escapes. The room was then evacuated and the behavioural trial began. Each trial had a series of successive behavioural assays modified from Adriaenssens and Johnsson (2013): open field test (OFT), mirror test (MT), novel object test (NOT) and predator stimulus test (PST). The entire list of behavioural variables measured can be found in Table 2.1.
The first thirty minutes of the trial began with the open field test; there were no other stimuli present. Its purpose is to allow for acclimation to a new environment, assess exploration (time spent in the centre vs. in the peripheral, frequency of zone transitions) and activity level (duration of time mobile or immobile, average velocity). This portion of the trial was analyzed afterwards with Ethovision XT 10 (Noldus, USA), a
semi-automated tracking software that allows for the designation and assignment of zones (Figure 2.2) over the working arena space (centre vs. peripheral) to quantify movement and behaviour. Only the last 25 minutes of the 30 minutes were used in analysis as the behaviour in first 5 minutes could have been in response to the presence of the researcher.
with the mirror from a certain distance (e.g., guppies; Cattelan et al. 2017) as such we collected data from a zone in front of the mirror, not solely mirror inteaction.
To assess neophilic behaviours, a small buoyant sphere of vegetable shortening coated in fish-food pellets (1.5 mm in diameter) was placed into each arena after the 30-minute MT. During this time the mirror remained. The combination of the mirror and a novel food object would allow for the determination if individuals are food-driven all while a conspecific remains present. This portion of the assay was scored manually, using Solomon Coder (copyright András Pétér, http://solomoncoder.com) to measure durations of time spent at the mirror (in parallel/ perpendicular orientations) and the novel object, the latency to approach the novel object, and counts/tallies to record frequencies of approaches to the novel object (Miller et al. 2016). This software allows one-time event behaviours, or behaviours that require duration values, to be manually defined and quantified.
After 75 minutes a predator stimulus (a 3D silhouette of a fish predator) was transiently (1-3 seconds) passed over the arenas. This allowed for the determination of the degree of reaction to a predator/disturbance and the amount of time taken to return to previous behaviour. During this time, the food and mirror were still present in the arenas. As with the previous assay, the PST was also scored manually to measure durations of time spent nosing the arena edges (escape behaviour) and time spent at the mirror and latency to return to previous behaviour.
They were then recovered in large oxygenated buckets and returned to their troughs. Subsequent sampling from troughs ensured that no fish with clipped fins were assayed again.
Saltwater behavioural assay
From May 18-21, 2015, sea pens were collapsed from 16 duplicated stock pens to 8 stock pens. The empty 8 net pens were shallowed in depth (15m x 15m x 10m) and used for the in situ saltwater behavioural assay. Since these assays would be completed at a stock
aggregate level, each individual was tagged for identification. During the net pen
combination, fish from both net pens were seined and each fish was PIT tag scanned and weighed under light anesthesia with clove oil (20 ppm; Sigma). Fish used in the
freshwater behavioural assay were identified and tagged with unique colour-coated spaghetti tags (Floy Tag Inc., Seattle, Wa.) for visual identification. Two tags were used per fish, inserted on either side, below the dorsal fin. After an hour of recovery in an aerated hauler with continuously pumped seawater, fish were gently returned into an empty net pen, separated by stock. A total of 360 fish were tagged, ranging from n = 37 to 51 per stock. The final number of surviving individuals post transfer with reliable behavioural data were n = 122, ranging from 9 to 20 individuals per stock.
views (cameras 1 and 2); and the third on the bottom facing upwards (camera 3)). The entire list of behavioural variables collected can be found in Table 2.2.
The assay began when a weighted net, with a smaller mesh size than the net pen, with a large hole in the centre (30 cm in diameter) was lowered into the water and tied into place dividing the net pen in half with no space to escape, save through the hole. This net was in place for 45 minutes to assess neophilic and escape behaviours (NOT).
Cameras 1 and 2 captured interactions of fish approaching both the net and the hole. Both videos were observed and manually recorded with Solomon coder to determine latency of approach to the net and hole, durations of time spent inspecting the net and hole (within one body-length distance), and counts/tallies to measure frequencies of approaches to the net, inspections of the hole and ‘escapes’.
After the net was removed, the 15-minute OFT began, but only the final 10 minutes were used to code behaviours (on average it took fish five minutes to recover from the disturbance of net removal). We measured the proportion of time spent in designated zones (peripheral and centre), styles of swim (immobile, mobile, burst swimming and shoaling), the latency to travel to the centre zone and the frequency of visits to the various zones.
recovery post-predator. Immediately after it was removed, the second scoop of food was administered to the net pen.
Performance metrics
Survival as a performance metric was determined from June 21 to 27, 2014 (time at freshwater assay) to May 18 to 21, 2015. This time period was after recovery of PIT tagging and prior to spaghetti tagging, so one can assume mortality was not due to these events. Saltwater survival (9–19 months post fertilization) was calculated by coding 1 for fish that were alive at both sampling dates, and 0 for fish that were alive at 9 mpf but no longer found at 19 mpf. Body mass (g) at time of the freshwater and saltwater assays for each individual was recorded, and biomass calculated per family (product of average family mass and number of family-level survivors). Freshwater biomass was calculated from post-hatch to transfer to saltwater net pens and saltwater biomass was calculated from saltwater transfer to final sampling.
Statistical Analyses
Statistical analyses were completed using JMP Version 12 (SAS Institute Inc.) or as otherwise indicated. All data were visually inspected for normality and quantile range outlier tests completed prior to analyses. To achieve normality, data were log10
Principal component analysis of behaviour
A principal component analysis (PCA) was conducted on each behavioural assay (i.e., OFT, MT, NOT and PST) to manage the large number of variables recorded for each test and identify trends in fresh/saltwater behaviour. The number of factors retained from each PCA was based on Kaiser criterion (eigenvalue > 1). In the freshwater analyses, two components were identified from behavioural variables produced by the OFT and
accounted for 90.4% of total variance (Table 2.3). PC1 described variables associated with activity level where positive values denoted individuals with higher activity levels (greater distance moved, greater average velocity, and more movement through zones). PC2, labeled as centre preference, was related to variables negatively correlated with distance to centre and positively correlated with duration and frequency in centre zone. Two components were also extracted from behavioural variables produced by the MT, which explained a total variance of 73.5% (Table 2.4). PC1 described variables related to asociality (negatively correlated with interaction with the mirror and positively correlated with duration and frequency in baffle (opposite) zone). PC2 described variables
object). PC2 loaded variables associated with avoidance behaviours from the mock predator by nosing the edges of the arena, assumed to be individuals looking for a point of exit. PC3 described predator sensitivity where a low score was assigned to individuals with no reaction to a predatory disturbance and a high score was assigned to individuals with the greatest response to a predator stimulus. PC4 was associated with sociality, where individuals with positive and high values were more ‘social’, as defined by spending time in the mirror zone before and after the predator stimulus. Finally, each PC generated by the initial three PCAs was loaded into a subsequent aggregate PCA to identify overall behavioural types at the freshwater time point. These PCs resulted in four overall behavioural phenotypes that explained 64.2% of the total variance (Table 2.6). PC1 was associated with exploratory behaviours (positively correlated activity level for OFT and MT and neophilic behaviour). PC2 represented sociality across MT and NOT/PST assays. PC3 represented shy individuals that exhibit escape behaviours
NOT/PST and avoid risky areas of the arena in the OFT (i.e., centre). Predator sensitivity was solely loaded into PC4.
Behaviours collected from the first feeding test produced one component only, which explained 74% of the overall variance (Table 2.8). Individuals with positive values fed more quickly, for a longer time and more frequently. The PCA conducted on PST and the second feeding test produced two components (Table 2.9). Positive values for PC1 describe individuals that have a greater response to a predator stimulus/disturbance as defined by more time spent schooling, taking longer to return to pre-PST behaviour and are quicker to school in response to predator. Positive values for PC2 described
individuals that tended to be motivated by the presence of food (they spent more time feeding post-predator stimulus).
Behavioural traits for the NOT, which produced two components, explained 78% of the total variance (Table 2.10). PC1 described neophilia, with positive values denoting individuals that were more prone to inspect the novel net without exhibiting escape behaviours (positively correlated to the frequency of net inspections and negatively correlated to the latency to approach the net). PC2 described escape behaviours (willingness to approach and then travel through the 30-cm diameter hole).
centre of the arena, exploring novel areas (holes in nets) and were less shy (preferred to be mobile in the centre). Finally, PC4 was solely explained by social behaviour where individuals with positive scores are more likely to spend more time in close proximity with conspecifics during the OFT. The four final saltwater phenotypes were positivized, by adding a constant value to each score to allow for log transformation, and log10 transformed to ensure normal distribution. This was not done for freshwater phenotypes as distribution was normal.
Variation in behavioural types among stocks
Using the R package MCMCglmm (Hadfield 2010), we analyzed behavioural differences between stocks in a multivariate context. This is a Bayesian approach to generalized linear mixed models to assess covariation of behaviours across stocks and control for random effects, as a MANOVA cannot. The cbind function (R Team 2014) accounts for covariance that may be present between our response variables (PCA-derived behavioural phenotypes). Stock was a fixed effect while individual ID, family ID, and barrel/sea pen ID were random effects. We used an uninformative inverse Wishart prior for the run models. We used the default settings for number of iterations, burn-in functions and thinning to yield an effective sample size of 1000, 95% confidence intervals and posterior means of the estimate. Trace and density plots were visually inspected to check for convergence and autocorrelation of chains.
Effect of behaviour on growth within life-history stages
metrics within each respective life-history stage: freshwater mass, saltwater mass, and change in mass. Specific growth rate (SGR) in saltwater (9–19 months post fertilization, mpf) was calculated using the formula SGR=100(ln W1 – ln W0) t-1 where W1
represented final body mass at 19 mpf, W0 represented initial body mass at 9 mpf, and t represented number of days between the initial and final masses (average 328 days). For each model, all behavioural types (aggregate PC’s from fresh or salt water), stock, and interactions between type and stock were included as fixed effects. Family ID, barrel ID and sea pen ID (where appropriate) were also included as random effects for both models.
Consistency of behavioural types across life-history stages
LMMs were used to explore the effects of freshwater behavioural phenotypes of juveniles (i.e., aggregate PC’s: exploratory, sociality, shy, predator sensitivity) on saltwater
behavioural phenotypes (exploratory, sociality, risk averse, food motivation) of adults, with stock and stock × behavioural phenotype interactions included as fixed effects, and family included in the model as a random effect.
Behavioural effects on performance traits across environments
survival data (1-alive, 0-mortality) using the glmer function in the lme4 package in R (Bates et al. 2015). Freshwater barrel ID, family ID and stock were included as random effects in this model.
Performance across environments
A LMM was used to examine whether individual mass or family-level biomass at the freshwater stage can be predictive of future adult mass, saltwater specific growth rate or family biomass. Fixed effects included freshwater mass, freshwater biomass, stock and stock × mass/biomass with family ID as a random effect. Family level biomass was assigned to each individual and averaged to determine stock differences in biomass for each life stage. A Tukey HSD post-hoc test was completed in JMP and graphically depicted in Figures 2.3 and 2.4 where different letters represent significant differences.
Results
Variation in behavioural types across life-history stages
Behavioural types emerged across the multiple assays fish were subjected to, and differed across life-history stages. Although different assays were used when testing behaviour, the same/similar variables were measured during video analysis (Tables 2.1 and 2.2). PCAs were conducted similarly as well and resulted in some qualitatively different behavioural phenotypes. The behaviours transitioned from exploratory, sociality, shyness and predator reactivity (explaining 64% of variance) in fresh water to exploratory,
Variation in behavioural types among stocks
At the freshwater stage, there was a moderate significant stock effect on our co-varying traits (exploratory, sociality, shyness, predator reactivity) where two of eight stocks (Nitinat and Robertson Creek) differed significantly from the model mean (pMCMC’s ≤ 0.004). At the saltwater stage, there was also a moderate significant stock effect on our co-varying traits (exploratory, sociality, risk averse and food-motivated) for salt water where Capilano and Robertson Creek differed significantly from the model mean (pMCMC’s < 0.001; Table 2.12).
Behavioural effects on performance traits within life-history stages
Most freshwater behavioural phenotypes predicted individual mass at the freshwater stage, but not family-level freshwater biomass (all p-values = 1.00). Shy and exploratory behavioural phenotypes had significant negative linear relationships with mass, where being more shy or exploratory resulted in smaller mass (F1, 258=12.0, P<0.001; F1,
258=8.13, P=0.004, respectively). Social behavioural phenotype had a significant positive relationship with mass, where being more social resulted in greater mass (F1, 254 =12.24, P<0.001). Additionally, exploratory (Capilano and Nititnat) and social (Robertson Creek) behavioural phenotypes interacted significantly with stock (F7, 258=2.23, P=0.03;
F7, 251=2.38, P=0.02, respectively). More exploratory individuals in Nitinat and social
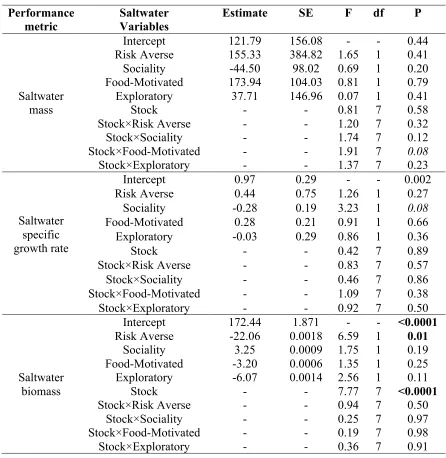
In salt water, stock x saltwater food-motivation behaviour was marginally significant (P=0.08) in explaining saltwater mass, where three stocks (Chilliwack,
Puntledge and Robertson Creek) that scored high values for food-motivation tended to be of smaller size. Saltwater biomass was explained by the risk-averse behavioural type (F1,75=-22.06, P=0.01), where the more risk-averse the individual, the smaller the saltwater biomass. There was also a significant stock effect on saltwater biomass (F7,35= 9.91, P<0.0001; Table 2.14). Lastly, being more social in salt water resulted in a
marginally significant lower specific growth rate (P=0.08).
Consistency of behavioural types across life-history stages
Freshwater sociality significantly interacted with stock to explain saltwater exploratory behaviour (p=0.046; Table 2.15) where the more social individuals in fresh water were less exploratory in salt water for individuals from Robertson Creek, and the opposite for individuals from Quinsam stock. Predator reactivity also had a marginally significant effect on saltwater exploratory behaviour (p=0.06) depending on the stock, where
individuals from Puntledge stock with a greater predator reaction were less exploratory in salt water whereas individuals from Robertson Creek were more exploratory in saltwater. No behavioural types in freshwater could predict saltwater food motivation-
Behavioural effects on performance traits across environments
A subset of freshwater behavioural types were capable of explaining saltwater
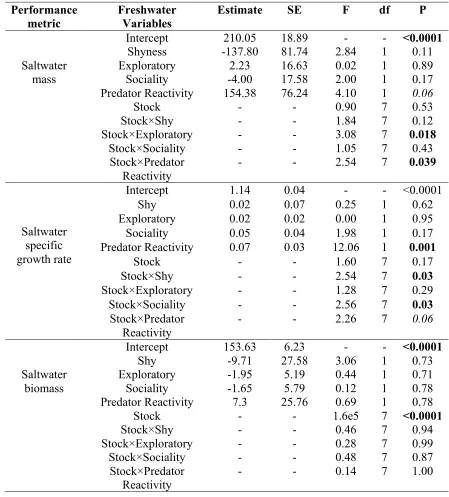
performance metrics. Both freshwater predator reactivity (F1, 24=4.10, P=0.06; individuals more reactive to a predator stimulus had a greater adult mass) and the interaction between stock and freshwater exploratory behaviour (F7,26=3.08 P=0.018; more exploratory
individuals from Quinsam stock had a greater adult mass) predicted adult mass at the time of the saltwater assay. Specific growth rate in salt water was explained by freshwater predator reactivity (F1, 30=12.06, P=0.001; individuals more reactive to a predator
stimulus had a greater specific growth rate), the interaction between stock x freshwater shy behaviour (F7,32=2.54, P=0.03; more shy individuals in fresh water had a greater specific growth rate) and stock x freshwater sociality behaviour (F7,31=2.56, P=0.03; more social individuals from Nitinat stock resulted in lower specific growth rates). Saltwater biomass was not explained by any behavioural phenotypes (P>0.09; Table 2.16);
however, survival from 9mpf to 19mpf was positively related to being less shy (P=0.06; Table 2.18).
Performance across environments
At the individual level, saltwater mass can be predicted by freshwater mass (F1, 89=7.36, P=0.008). Similarly, saltwater biomass can be predicted by freshwater biomass
Discussion
When choosing among outbreeding sources to provide an aquaculture production stock with new genetic material, the ideal phenotype expressed from the crosses would be one that transitions well to life in a new (captive) environment. Because behaviour both reflects the underlying genotype and drives its ability to adapt to the environment, behavioural variation is closely linked to growth-survival tradeoffs (Dingemanse and Réale 2005). As such, “maladaptive aquaculture” behaviours can result in low body size and even diminished biomass. Our outcrossing breeding design resulted in behavioural variation across Chinook salmon offspring stocks and life history stages, and a subset of the behavioural types expressed by individuals were indicative of flexibility (high exploratory values, low predatory sensitivity and risk-averse values), where there is a response to the novel stimuli and recovered/reacted adaptively. Exploratory behaviour in juveniles did have effect on performance, but not in the way we predicted. Risk-averse behaviour, which is comprised of neophobic behaviour and high responsiveness to a predator stimulus, had an effect on performance, but low-values (more flexible) resulted in increased performance.