ABSTRACT
FRAZIER, MALCOM ANDREW. Employee Perceptions of the Deployment and Effectiveness
of Management Practices in Eight State Revenue Agencies. (Under the direction of James E.
Swiss.)
The purpose of this study is to twofold. The first purpose is to determine if employees in state revenue agencies perceive a relationship between the deployment of nine different management practices and their perceptions of results. The nine management practices are: strategic planning, performance measures, performance feedback, customer service, empowerment, teamwork, training, rewards and recognition and process improvement. The result measures are: taxpayer satisfaction, improvement in processes leading to improved services, service delivery, job satisfaction and morale.
The second purpose is to determine if employees’ favorable perception of the management practices and results is dependent upon their position in the agency (i.e., senior executives, managers, front-line supervisors and non-supervisors). Employee opinions were collected from eight different state revenue agencies using a 44-item web-based survey. There were 4,186 completed surveys, for a total response rate of 50.5 percent.
EMPLOYEE PERCEPTIONS OF THE DEPLOYMENT AND EFFECTIVENESS OF DIFFERENT MANAGEMENT PRACTICES IN EIGHT STATE REVENUE AGENCIES
by
MALCOM ANDREW FRAZIER
A dissertation submitted to the Graduate Faculty of North Carolina State University
in partial fulfillment of the requirements for the Degree of
Doctor of Philosophy
POLITICAL SCIENCE AND PUBLIC ADMINISTRATION
Raleigh 2004
APPROVED BY:
__________________________ __________________________ William A. Smith, Jr. Charles K. Coe
__________________________ __________________________ Michael L. Vasu James E. Swiss
DEDICATION
BIOGRAPHY
Malcom Andrew (Andy) Frazier was born in Lawton, Oklahoma on April 27, 1952, and grew up in Woodstock, Virginia, graduating from Central High School in 1971. He is a 1975 graduate of James Madison University with a B.S. Degree in Political Science, and received a Masters Degree in Public Administration from North Carolina State University in 1989. He is married to the former Pamela Ann Yeatman of Birmingham, Alabama and they have a son named William.
Andy Frazier is a former Executive Director of the North Carolina Republican Party, and served in the administration of Governor James G. Martin as his workforce preparedness advisor. During his tenure in the Governor’s office, he assisted Martin in the creation of the Governor’s Commission on Workforce Preparedness. He also assisted the Commission in conducting the first inventory of North Carolina's workforce preparedness programs and preparing its first biennial strategic plan for 1993-95.
In addition to his duties as workforce preparedness advisor, Andy Frazier was a consultant to the NC Business Committee for Education. As staff consultant to the 90-member Business Committee for Education, Andy played a key role in re-defining the Committee's mission and rejuvenating the organization to take a more pro-active role in education reform. Andy assisted the Business Committee in organizing a coalition of statewide business and education organizations to support legislative proposals for education reform, and the development and management of several statewide programs, including the N.C. School-to-Work Initiative, and the N.C. Total Quality Partnership Project.
After leaving the Governor’s office in 1993, Andy was a partner in the consulting firm WorkPrep Connections, Inc. He is the author of a book entitled, A Roadmap for Quality Transformation in Education: A Guide for Local Education Reform Leaders, published in 1997 by St. Lucie Press. He served three years as a member of the Board of Examiners for the N.C. Quality Leadership Awards Council.
TABLE OF CONTENTS
LIST OF TABLES Page xvi
LIST OF FIGURES Page xx
CHAPTER 1: INTRODUCTION TO THE STUDY Page 1
INTRODUCTION Page 1
RECENT HISTORY OF MANAGEMENT REFORM IN GOVERNMENT Page 1
Total Quality Management Page 1
Reinventing Government Page 4
Reinventing Government in State Agencies Page 6
Results-based Management Page 7
Results-based Management in State Agencies Page 8
The Malcolm Baldrige National Quality Award Page 11
PURPOSE OF THE STUDY Page 12
BASIC RESEARCH METHODOLOGY OF THE STUDY Page 12
UNIT OF ANALYSIS: STATE REVENUE AGENCIES AND THEIR
EMPLOYEES Page 13
SIGNIFICANCE OF THIS STUDY Page 15
RELEVANCE TO PUBLIC ADMINISTRATION Page 16
PREVIEW OF UPCOMING CHAPTERS Page 16
CHAPTER 2: LITERATURE REVIEW Page 18
INTRODUCTION Page 18
Research Hypotheses Page 18
OVERVIEW OF THE CHAPTER Page 19
THEORETICAL GROUNDING OF THE STUDY Page 20
Empirical Evidence on the Strategic Planning and Performance
Link in the Private Sector Page 22
Empirical Evidence on the Strategic Planning and Performance
Link in the Non-Profit Sector Page 23
Summary of the Empirical Evidence on the Link Between
Strategic Planning and Organizational performance Page 24 PERFORMANCE MEASURES AND ORGANIZATIONAL PERFORMANCE Page 24
Empirical Evidence on the Goal-Setting and Performance Link Page 24 Empirical Evidence on the Management-by-Objective and
Performance Link Page 26
Empirical Evidence of Goal-Setting and Performance Feedback
In the Public Sector: The High Performance Cycle Page 27 Summary of the Empirical Evidence on the Link between Goal-
Setting, MBO and Organizational Performance Page 28 PERFORMANCE FEEDBACK AND ORGANIZATIONAL PERFORMANCE Page 28
Empirical Evidence on the Performance Feedback and Performance
Link Page 29
Summary of the Empirical Evidence on the Link Between
Performance Feedback and Organizational Performance Page 30 CUSTOMER SERVICE AND ORGANIZATIONAL PERFORMANCE Page 30
Empirical Evidence on the Customer Service and Performance
Link in the Private Sector Page 31
Empirical Evidence on the Customer Service and Performance
Link in the Public Sector Page 32
Summary of the Empirical Evidence on the Link Between
Customer Service and Organizational Performance Page 32
EMPOWERMENT AND ORGANIZATIONAL PERFORMANCE Page 33
Empirical Evidence on the Empowerment and Performance
Link in the Private Sector Page 33
Empirical Evidence on the Empowerment and Performance
Link in the Public Sector Page 36
Summary of the Empirical Evidence on the Link Between
TEAMWORK AND ORGANIZATIONAL PERFORMANCE Page 39 Empirical Evidence on the Teamwork and Performance
Link in the Private Sector Page 39
Summary of the Empirical Evidence on the Link Between
Teamwork and Organizational Performance Page 40
TRAINING AND ORGANIZATIONAL PERFORMANCE Page 40
Empirical Evidence on the Training and Performance
Link in the Private Sector Page 41
Summary of the Empirical Evidence on the Link Between
Training and Organizational Performance Page 42
REWARDS AND RECOGNITION AND ORGANIZATIONAL
PERFORMANCE Page 42
Empirical Evidence on the Financial Incentives and
Performance Link in the Private Sector Page 43
Empirical Evidence on the Financial Incentives and
Performance Link in the Public Sector Page 44
Summary of the Empirical Evidence on the Link Between Rewards and Recognition and Organizational
Performance Page 46
PROCESS IMPROVEMENT AND ORGANIZATIONAL PERFORMANCE Page 46 Empirical Evidence on the Process Improvement and
Performance Link Page 47
Summary of the Empirical Evidence on the Link Between
Process Improvement and Organizational Performance Page 49 TOTAL QUALITY MANAGEMENT (TQM) AND ORGANIZATIONAL
PERFORMANCE Page 50
Empirical Evidence on the TQM and Performance Link
in the Private Sector Page 50
Quality Award Winners and Performance Page 51 Baldrige and Performance Page 52
Empirical Evidence on the TQM and Performance Link
Summary of the Empirical Evidence on the Link between
TQM and Organizational Performance Page 55
DIFFERENCE IN PERCEPTION TO CHANGE AT DIFFERENT
ORGANIZATIONAL LEVELS Page 56
Summary of the Empirical Evidence on the Difference in
Perception to Change at Different Organizational Levels Page 58 THE CORRELATION BETWEEN PERCEPTUAL AND
OBJECTIVE MEASURES OF ORGANIZATIONAL PERFORMANCE Page 58 Empirical Evidence on the Perceptual and Objective
Correlation Page 59
Summary of the Empirical Evidence on the Perceptual
And Objective Correlation Page 60
CONCLUSIONS Page 60
CHAPTER 3: RESEARCH DESIGN Page 61
INTRODUCTION Page 61
METHODOLOGY EMPLOYED Page 61
Preliminary Survey Page 62
Employee Survey Page 63
Objective Data Page 63
Follow-up Interviews Page 65
RESULTS OF PRELIMINARY SURVEY Page 65
LIMITATION OF RESEARCH DESIGN Page 66
Threats to Internal Validity Page 66
Qualitative Threats to Internal Validity Page 67
Threats to External Validity Page 68
CONTROL Page 69
SAMPLING DESIGN Page 70
Unit of Analysis Page 70
Survey Method Page 70
Response Rates Using Electronic Surveys via Internet Page 71 Survey Procedures to Improve Response Rate Page 73
HYPOTHESES AND VARIABLES Page 74
Control Variables Page 78
DATA ANALYSIS AND PROCEDURES Page 78
Statistical Reliability Page 78
Frequency Tables Page 79
Hypotheses 1 through 11: The Association between Employee Perceptions of Management Practices and Their Perception of
Results and Job Satisfaction Page 79
Hypothesis 12: The Relationship between Management
Practices and Objective Performance Data Page 81 Hypothesis 13 and 14: The Association between Position
and Employee Perceptions of Management Practices and Results Page 81
Follow-up Interviews Page 82
PRETEST Page 82
ACTUAL RESPONSE Page 83
Lessons Learned from Initial Three Agencies Page 85 LESSONS LEARNED FROM WEB-BASED SURVEYS ACROSS
AGENCIES Page 86
CHAPTER 4: ANALYSIS -- THE ASSOCIATION BETWEEN MANAGEMENT
PRACTICES AND RESULTS, BOTH PERCEIVED AND OBJECTIVE Page 87
RESPONSE RATES Page 87
INTERNAL CONSISTENCY OF THE SURVEY: STATISTICAL
RELIABILITY Page 87
RE-CAP OF DATA ANALYSIS PROCEDURES Page 89
Interviews Page 90
FREQUENCIES Page 91
DOES THE PERCEIVED DEPLOYMENT OF STRATEGIC Page 92 PLANNING HAVE A POSITIVE ASSOCIATION WITH PERCEIVED
RESULTS?
Analysis by Agency Page 92
Analysis by All Agencies Collectively Page 94
Findings Page 95
DOES THE PERCEIVED DEPLOYMENT OF PEFORMANCE MEASURES HAVE A POSITIVE ASSOCIATION WITH PERCEIVED
RESULTS? Page 97
Analysis by Agency Page 97
Analysis by All Agencies Collectively Page 99
Findings Page 100
DOES THE PERCEIVED DEPLOYMENT OF PERFORMANCE FEEDBACK HAVE A POSITIVE ASSOCIATION WITH PERCEIVED
RESULTS? Page 100
Analysis by Agency Page 100
Analysis by All Agencies Collectively Page 102
Findings Page 103
DOES THE PERCEIVED DEPLOYMENT OF CUSTOMER SERVICE HAVE A POSITIVE ASSOCIATION WITH PERCEIVED
RESULTS? Page 104
Analysis by Agency Page 104
Analysis by All Agencies Collectively Page 105
Findings Page 106
DOES THE PERCEIVED DEPLOYMENT OF EMPOWERMENT HAVE A POSITIVE ASSOCIATION WITH PERCEIVED
RESULTS? Page 107
Analysis by Agency Page 107
Findings Page 109 DOES THE PERCEIVED DEPLOYMENT OF TEAMWORK
HAVE A POSITIVE ASSOCIATION WITH PERCEIVED
RESULTS? Page 110
Analysis by Agency Page 110
Analysis by All Agencies Collectively Page 111
Findings Page 111
DOES THE PERCEIVED DEPLOYMENT OF TRAINING HAVE A POSITIVE ASSOCIATION WITH PERCEIVED
RESULTS? Page 113
Analysis by Agency Page 113
Analysis by All Agencies Collectively Page 114
Findings Page 115
DOES THE PERCEIVED DEPLOYMENT OF REWARDS AND
RECOGNITION HAVE A POSITIVE ASSOCIATION WITH PERCEIVED
RESULTS? Page 115
Analysis by Agency Page 115
Analysis by All Agencies Collectively Page 117
Findings Page 117
DOES THE PERCEIVED DEPLOYMENT OF HUMAN RESOURCES HAVE A POSITIVE ASSOCIATION WITH PERCEIVED
RESULTS? Page 118
Analysis by Agency Page 118
Analysis by All Agencies Collectively Page 120
Findings Page 120
DOES THE PERCEIVED DEPLOYMENT OF PROCESS
IMPROVEMENT HAVE A POSITIVE ASSOCIATION WITH PERCEIVED
RESULTS? Page 121
Analysis by Agency Page 121
Findings Page 123 DOES THE PERCEIVED DEPLOYMENT OF ALL MANAGEMENT
PRACTICESS HAVE A POSITIVE ASSOCIATION WITH PERCEIVED
RESULTS? Page 124
Analysis by Agency Page 124
Analysis by All Agencies Collectively Page 126
Findings Page 126
MULTIPLE REGRESSION Page 127
Findings Page 132
CONCLUSIONS: THE PERCEPTIONS OF MANAGEMENT PRACTICES
AND RESULTS Page 132
INTERVIEWS: HARD VS. SOFT? Page 135
Why Hard Components More Effective Page 136
What Works Page 137
THE RELATIONSHIP BETWEEN EMPLOYEES’ PERCEPTION OF MANAGEMENT PRACTICES AND OBJECTIVE PERFORMANCE
DATA Page 139
Which Agencies Collect Which FTA Measures Page 139
Average Call Center Queue Time Page 140
Call Center Abandon Rate Page 141
Percent Dollars Deposited on the Same Day as Receipt Page 143
Conclusions Page 145
CHAPTER 5: ANALYSIS -- THE ASSOCIATION BETWEEN POSITION AND EMPLOYEE PERCEPTIONS OF MANAGEMENT PRACTICES AND
RESULTS Page 148
IMPORTANCE OF RESEARCH QUESTION Page 148
RECAP OF DATA ANALYSIS PROCEDURES Page 149
DOES THE PERCEIVED DEPLOYMENT OF STRATEGIC
PLANNING DIFFER BY THE LEVEL OF HIEARCHY? Page 151
Analysis of All Agencies Collectively Page 153
Findings Page 157
DOES THE PERCEIVED DEPLOYMENT OF PERFORMANCE
MEASURES DIFFER BY THE LEVEL OF HIEARCHY? Page 158
Analysis by Agency Page 158
Analysis of All Agencies Collectively Page 160
Findings Page 164
DOES THE PERCEIVED DEPLOYMENT OF PERFORMANCE
FEEDBACK DIFFER BY THE LEVEL OF HIEARCHY? Page 164
Analysis by Agency Page 164
Analysis of All Agencies Collectively Page 166
Findings Page 168
DOES THE PERCEIVED DEPLOYMENT OF CUSTOMER SERVICE
DIFFER BY THE LEVEL OF HIEARCHY? Page 169
Analysis by Agency Page 169
Analysis of All Agencies Collectively Page 170
Findings Page 173
DOES THE PERCEIVED DEPLOYMENT OF EMPOWERMENT
DIFFER BY THE LEVEL OF HIEARCHY? Page 174
Analysis by Agency Page 174
Analysis of All Agencies Collectively Page 175
Findings Page 177
DOES THE PERCEIVED DEPLOYMENT OF TEAMWORK
DIFFER BY THE LEVEL OF HIEARCHY? Page 178
Analysis by Agency Page 178
Analysis of All Agencies Collectively Page 179
DOES THE PERCEIVED DEPLOYMENT OF TRAINING
DIFFER BY THE LEVEL OF HIEARCHY? Page 182
Analysis by Agency Page 182
Analysis of All Agencies Collectively Page 184
Findings Page 185
DOES THE PERCEIVED DEPLOYMENT OF REWARDS AND
RECOGNITION DIFFER BY THE LEVEL OF HIEARCHY? Page 186
Analysis by Agency Page 186
Analysis of All Agencies Collectively Page 187
Findings Page 189
DOES THE PERCEIVED DEPLOYMENT OF HUMAN RESOURCES
DIFFER BY THE LEVEL OF HIEARCHY? Page 190
Analysis by Agency Page 190
Analysis of All Agencies Collectively Page 191
Findings Page 192
DOES THE PERCEIVED DEPLOYMENT OF PROCESS
IMPROVEMENT DIFFER BY THE LEVEL OF HIEARCHY? Page 192
Analysis by Agency Page 192
Analysis of All Agencies Collectively Page 193
Findings Page 196
DOES THE PERCEIVED DEPLOYMENT OF ALL MANAGEMENT
PRACTICES DIFFER BY THE LEVEL OF HIEARCHY? Page 197
Analysis by Agency Page 197
Analysis of All Agencies Collectively Page 198
Findings Page 198
PERCIEVED RESULTS BY PERCEIVED LEVEL OF HIERARCHY Page 198 DOES THE PERCEIVED LEVEL OF TAXPAYER SATISFACTION
DIFFER BY THE LEVEL OF HIERARCHY? Page 199
Analysis of All Agencies Collectively Page 201
Findings Page 202
DOES THE PERCEIVED LEVEL OF IMPROVEMENTS IN
PROCESSES BY THE LEVEL OF HIERARCHY? Page 202
Analysis by Agency Page 203
Analysis of All Agencies Collectively Page 204
Findings Page 205
DOES THE PERCEIVED LEVEL OF SERVICE DELIVERY
DIFFER BY THE LEVEL OF HIERARCHY? Page 206
Analysis by Agency Page 206
Analysis of All Agencies Collectively Page 208
Findings Page 209
DOES JOB SATISFACTION DIFFER LEVEL OF HIERARCHY? Page 210
Analysis by Agency Page 210
Analysis of All Agencies Collectively Page 211
Findings Page 212
DOES THE PERCEIVED LEVEL OF MORALE DIFFER BY THE
LEVEL OF HIERARCHY? Page 213
Analysis by Agency Page 213
Analysis of All Agencies Collectively Page 214
Findings Page 215
CONCLUSIONS Page 217
INTERVIEWS: WHAT EXPLAINS THE DIVERGENCE OF
OPINION BETWEEN THE TOP AND THE BOTTOM? Page 219
The “Ivory Tower,” “Mushroom” and “Ostrich” Syndromes Page 220
Ineffective Communicators Page 221
What the Interviews Tell Us Page 222 CHAPTER 6: SUMMARY OF FINDINGS, PRACTICAL APPLICATIONS
AND FUTURE RESEARCH Page 226
SUMMARY OF FINDINGS Page 226
The Association between Management Practices and Results,
Both Perceived and Objective Page 226
The Association between Position and Employee Perceptions
of Management Practices and Results Page 228
The Findings Relative to the Literature Page 229 PRACTICAL APPLICATIONS AND IMPLICATIONS OF THE FINDINGS Page 230
Hard Components versus Soft Components Page 230
Specific Implications: What Improves Results Page 231
FUTURE DIRECTIONS IN RESEARCH Page 233
Refining Perceived Result Measures Page 233
Using Objective Performance Data Page 234
Third Party Assessment and Objective Performance Data Page 235 What Motivates Employees Within A “Hard Framework”? Page 235
IN CONCLUSION Page 235
LIST OF REFERENCES Page 237
APPENDICES Page 243
PRELIMINARY SURVEY Page 244
COVER LETTER Page 247
PRELIMINARY SURVEY RESULTS Page 258
COMPARISON OF RESULTS BETWEEN SELF-SELECTED AGENCIES
AND ALL REVENUE AGENCIES Page 250
DRAFT ADVANCE NOTICE MEMO Page 253
LIST OF TABLES
CHAPTER 3: RESEARCH DESIGN Page 61
3-1 Taxes Administered Page 69
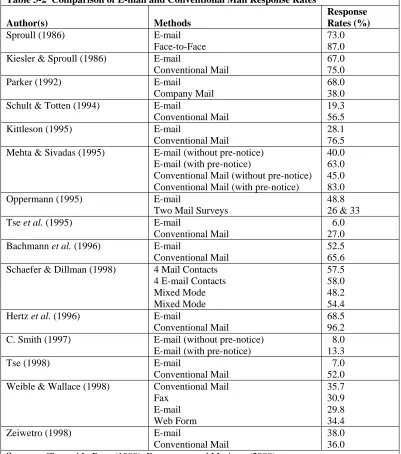
3-2 Comparison of E-Mail and Conventional Mail Response Rates Page 72 3-3 Inter-Agency Contact on Web-Based Survey Page 83
3-4 Web-based Survey Dates Page 84
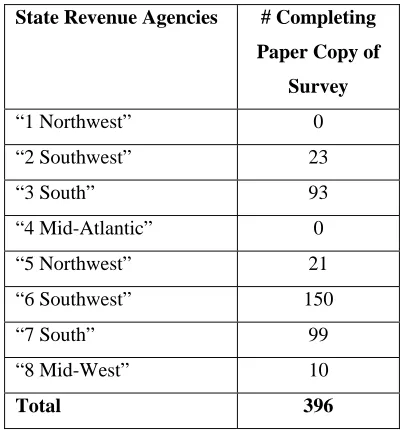
3-5 Response Rates for Each State Revenue Agency Page 84 3-6 Number Completing Paper Copy of Survey Page 85 3-7 Response Rate per Page for Each State Revenue Agency Page 85 CHAPTER 4: ANALYSIS -- THE ASSOCIATION BETWEEN MANAGEMENT
PRACTICES AND RESULTS, BOTH PERCEIVED AND OBJECTIVE Page 87
4-1 Reliability Coefficients Page 88
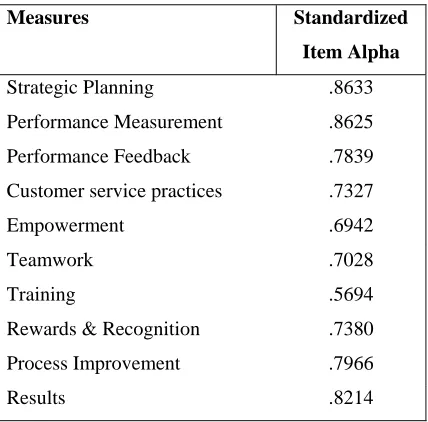
4-2 Standardized Item Alpha Page 89
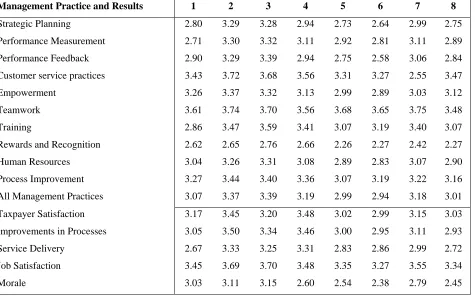
4-3 Mean Scores for Each Agency Page 90
4-4 Mean Scores for All Responses Collectively, Management Practices Page 91
4-5 Strategic Planning by Result Page 94
4-6 Strategic Planning by Result Page 94
4-7 Strategic Planning Items by Result Page 95
4-8 Performance Measures by Result Page 98
4-9 Performance Measures by Result Page 99
4-10 Performance Measure Items by Result Page 99
4-11 Performance Feedback by Result Page 102
4-12 Performance Feedback by Result Page 102
4-13 Performance Feedback Items by Result Page 103
4-14 Customer Service by Result Page 105
4-15 Customer Service by Result Page 105
4-16 Customer Service Items by Result Page 106
4-17 Empowerment by Result Page 108
4-18 Empowerment by Result Page 108
4-19 Empowerment Items by Result Page 109
4-20 Teamwork by Results Page 110
4-21 Teamwork by Result Page 111
4-22 Teamwork Items by Result Page 111
4-23 Training by Result Page 114
4-24 Training by Result Page 114
4-25 Training Items by Result Page 114
4-26 Rewards and Recognition by Result Page 116 4-27 Rewards and Recognition by Result Page 117 4-28 Rewards and Recognition by Items by Result Page 117
4-29 Human Resources by Result Page 120
4-30 Human Resources by Result Page 120
4-31 Process Improvement by Result Page 122
4-32 Process Improvement by Result Page 122
4-36 Correlation Matrix of Independent Variables (Pearson’s r) Page 128
4-37 Regression Coefficients Page 128
4-38 Adjusted R Square Values for Each State Revenue Agency Page 129
4-39 “1 Northwest” Page 129
4-40 “2 Southwest” Page 130
4-41 “3 South” Page 130
4-42 “4 Mid-Atlantic” Page 130
4-43 “5 Northwest” Page 131
4-44 “6 Southwest” Page 131
4-45 “7 South” Page 131
4-46 “8 Mid-West” Page 132
4-47 Correlations between Management Practices and Results Page 134
4-48 Median Scores for Each Agency Page 146
4-49 Standard Deviation Scores for Each Agency Page 147 CHAPTER 5: ANALYSIS -- THE ASSOCIATION BETWEEN POSITION
AND EMPLOYEE PERCEPTIONS OF MANAGEMENT PRACTICES AND
RESULTS Page 148
5-1 Frequencies for 3 Levels of Position Page 149
5-2 Frequencies for 4 Levels of Position Page 149
5-3 Frequencies for 4 Levels of Position for Each Agency Page 149 5-4 Strategic Planning by Levels of Position Page 151 5-5 Strategic Planning by Position at “3 South” Page 152 5-6 Strategic Planning by Position at “6 Southwest” Page 153 5-7 Strategic Planning by Level of Position Page 153
5-8 Three Levels of Position Page 154
5-9 Four Levels of Position Page 155
5-10 Each Survey Item for Strategic Planning by Position Page 156 5-11 Performance Measures by Levels of Position Page 158 5-12 Performance Measures by 3 Levels of Position at “2 Southwest” Page 160 5-13 Performance Measures by 4 Levels of Position at “2 Southwest” Page 160 5-14 Performance Measures by Level of Position Page 161
5-15 Three Levels of Position Page 162
5-16 Four Levels of Position Page 162
5-17 Each Survey Item for Performance Measures by Position Page 163 5-18 Performance Feedback by Levels of Position Page 165 5-19 Performance Feedback by Position at “5 Northwest” Page 166 5-20 Performance Feedback by Level of Position Page 166
5-21 Four Levels of Position Page 167
5-22 Each Survey Item for Performance Feedback by Position Page 168 5-23 Customer Service Practices by Levels of Position Page 169 5-24 Customer service practices by Level of Position Page 170
5-25 Four Levels of Position Page 171
5-26 Each Survey Item of Customer service practices by Position Page 172
5-27 Empowerment by Levels of Position Page 174
5-28 Empowerment by Level of Position Page 175 5-29 Each Survey Item for Empowerment by Position Page 175
5-30 Teamwork by Levels of Position Page 178
5-31 Teamwork by 4 Levels of Position at “3 South” Page 179
5-33 Three Levels of Position Page 180 5-34 Survey Items for Teamwork by Position Page 181
5-35 Training by Levels of Position Page 183
5-36 Training by 4 Levels of Position at “6 Southwest” Page 183
5-37 Training by Level of Position Page 184
5-38 Four Levels of Position Page 184
5-39 Each Survey Item for Training by Position Page 185 5-40 Rewards and Recognition by Levels of Position Page 186 5-41 Rewards and Recognition by 3 Levels at “6 Southwest” Page 187 5-42 Rewards and Recognition by Level of Position Page 187
5-43 Four Levels of Position Page 187
5-44 Each Survey Item for Rewards and Recognition by Position Page 188 5-45 Human Resources by Levels of Position Page 191 5-46 Human Resources by Level of Position Page 191
5-47 Four Levels of Position Page 191
5-48 Process Improvement by Levels of Position Page 193 5-49 Process Improvement by Level of Position Page 193 5-50 Survey Items for Process Improvement by Position Page 194 5-51 All Management Practices by Levels of Position Page 197 5-52 All Management Practices by Level of Position Page 198 5-53 Taxpayer Satisfaction by Levels of Position Page 199 5-54 Percent Agreement (Agree and Strongly Agree) on Improved Taxpayer
Satisfaction by Agency Page 200
5-55 Taxpayer Satisfaction by Level of Position Page 201 5-56 Taxpayer Satisfaction by Four Levels of Position Page 201 5-57 Improvements in Processes by Levels of Position Page 203 5-58 Percent Agreement (Agree and Strongly Agree) on Improvements in
Processes by Agency Page 204
5-59 Improvements in Processes by Level of Position Page 204 5-60 Improvements in Processes by Four Levels of Position Page 205 5-61 Service Delivery by Levels of Position Page 206 5-62 Percent Agreement (Agree and Strongly Agree) on Service Delivery
by Agency Page 207
5-63 Service Delivery by Level of Position Page 208 5-64 Service Delivery by Four Levels of Position Page 209 5-65 Job Satisfaction by Levels of Position Page 210 5-66 Percent Agreement (Agree and Strongly Agree) on Job Satisfaction
by Agency Page 211
5-67 Job Satisfaction by Level of Position Page 212 5-68 Job Satisfaction by Four Levels of Position Page 212
5-69 Morale by Levels of Position Page 213
5-70 Percent Agreement (Agree and Strongly Agree) on Improved Taxpayer
Satisfaction by Agency Page 214
5-71 Morale by Level of Position Page 215
5-72 Morale by Four Levels of Position Page 215
5-73 Mean Scores Analysis by Agency Page 216
5-74 Median Response for Management Practice and Result by Position Page 224 5-75 Interquartile Response (First and Third Quartiles) for Management
Practices and Results by Position Page 224
5-76 Minimum and Maximum Response for Management Practices and
CHAPTER 6: SUMMARY OF FINDINGS, PRACTICAL APPLICATIONS
AND FUTURE RESEARCH Page 226
6-1 Ranking of Management Practices by Regression Coefficients Page 227 6-2 Management Practices Ranked by Table 6-1; Spearman Correlations
between Management Practices and Results and Ranked According
LIST OF FIGURES
CHAPTER 4: ANALYSIS -- THE ASSOCIATION BETWEEN MANAGEMENT
PRACTICES AND RESULTS, BOTH PERCEIVED AND OBJECTIVE Page 87
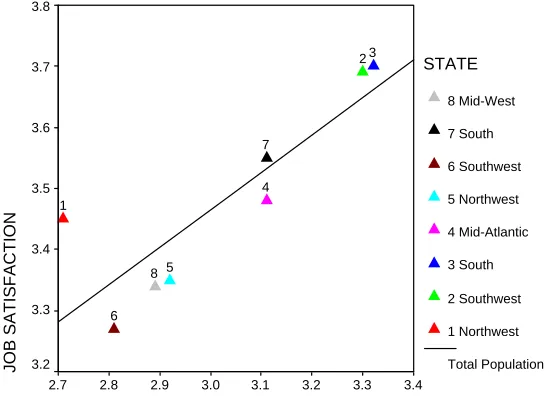
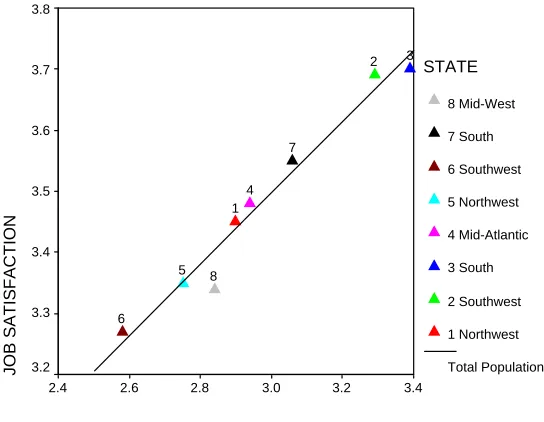
4-1 Strategic Planning and Job Satisfaction Page 92 4-2 Strategic Planning and Improvements in Processes Page 93
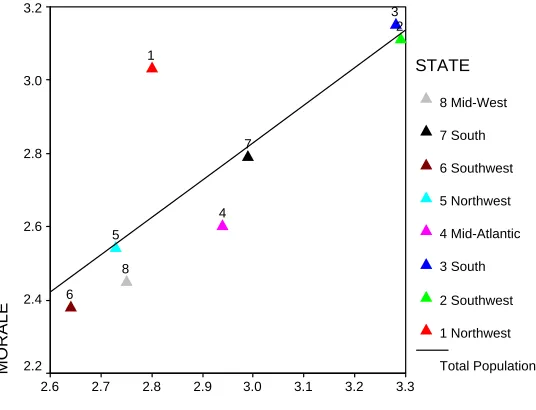
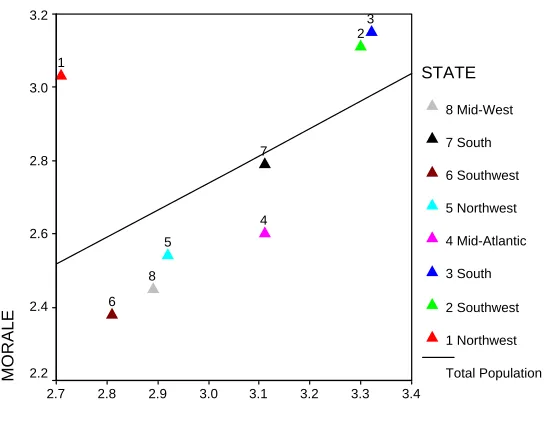
4-3 Strategic Planning and Morale Page 93
4-4 Performance Measures and Job Satisfaction Page 97
4-5 Performance Measures and Morale Page 98
4-6 Performance Feedback and Job Satisfaction Page 101
4-7 Performance Feedback and Morale Page 101
4-8 Customer Service and Taxpayer Satisfaction Page 104
4-9 Empowerment and Morale Page 107
4-10 Training and Service Delivery Page 113
4-11 Rewards and Recognition and Morale Page 116 4-12 Human Resources and Job Satisfaction Page 119
4-13 Human Resources and Morale Page 119
4-14 Process Improvement and Service Delivery Page 121 4-15 All Management Practices and Improvements in Processes Page 125 4-16 All Management Practices and Job Satisfaction Page 125 4-17 Customer Service Practices and Average Call Center Queue Time Page 140 4-18 Empowerment and Call Center Abandon Rate Page 142 4-19 Customer Service Practices and Call Center Abandon Rate Page 142 4-20 Performance Feedback and Percent Dollars Deposited Same Day
Received Page 143
4-21 Strategic Planning and Percent Dollars Deposited Same Day Received Page 144 4-22 Process Improvement and Percent Dollars Deposited Same Day
Received Page 144
CHAPTER 5: ANALYSIS -- THE ASSOCIATION BETWEEN POSITION AND EMPLOYEE PERCEPTIONS OF MANAGEMENT PRACTICES AND
RESULTS Page 148
5-1 Strategic Planning by Position at “3 South” Page 152 5-2 Strategic Planning by Position at “6 Southwest” Page 153 5-3 Strategic Planning by Three Levels of Position Page 154 5-4 Strategic Planning by Four Levels of Position Page 155 5-5 “The work that employees do is clearly tied to their division’s
long-term goals and objectives.” Page 156
5-6 “Management seeks the opinions of employees on the long-term
direction of the department.” Page 157
5-14 “Management routinely seeks the opinions of employees on issues
related to their job and their work environment.” Page 168 5-15 Customer service practices by Four Levels Position Page 171 5-16 “We take taxpayer complaints very seriously and we act to resolve
them in a timely fashion.” Page 172
5-17 “Improving taxpayer access to our services is an important priority
for our department.” Page 173
5-18 “I am involved in decisions that affect my work.” Page 176 5-19 “Promising ideas and suggestions made by employees are
implemented.” Page 176
5-20 Teamwork by 4 Levels of Position at “3 South” Page 179 5-21 Teamwork by Three Levels of Position Page 180 5-22 “My co-workers and I work in groups to solve problems.” Page 181 5-23 “Developing the skills of all employees is a priority for managers
and supervisors.” Page 185
5-24 “Recognizing employees’ for their achievements are important
activities for managers and supervisors.” Page 188 5-25 “I can expect to receive a pay raise or bonus if I perform exceptionally
well.” Page 189
5-26 “Managers and supervisors encourage employees to simplify and
streamline their work processes and/or procedures.” Page 194 5-27 “The needs of employees in other divisions or work units are taken
into consideration when we make improvements to our most important
work processes and/or procedures.” Page 195
CHAPTER 1
INTRODUCTION TO THE STUDY
INTRODUCTION
The purpose of this study is to determine whether the implementation of certain management practices have effects on state agencies. Those management practices include: strategic planning; performance measures; performance feedback; customer service; empowerment; teamwork; training; rewards and recognition; and process improvement.
This chapter begins with a discussion of recent history regarding two major trends in public management reform known as Total Quality Management and Reinventing Government. In this section, we discuss the basic concepts of these two movements. We also discuss two of their more lasting contributions: The first being Results-based Management and the other the Malcolm Baldrige National Quality Award, both of which have been established in federal law. The next sections of this chapter discuss the purposes of this study and its major goals. Finally, we conclude with a preview of the upcoming chapters.
RECENT HISTORY OF MANAGEMENT REFORM IN GOVERNMENT
Management reform has been described as first and foremost an “explicit and rational activity” to make “administrative repairs.” (Arnold, 1995, p. 408) Since the 1970s, executive reorganizations and management reforms have become a means by which politicians could respond to public dissatisfaction with government operations. For that reason, management reforms have taken on a “populist accent, promising to change government to make it more acceptable to popular American expectations.” (Arnold, 1995, p. 412)
The latest management reformation, which began in the early 1980s and continues to this day, has emerged in response to a perception among American citizens that government has failed to meet its obligations. This reformation is made up of at least two separate, but overlapping movements, known as Total Quality Management and Re-inventing Government.
Total Quality Management
years. The most prominent proponent of the philosophy, W. Edwards Deming, articulated 14 points that he believed every organization should adapt to its organizational culture:
1. Creating constancy of purpose in improving products and services. 2. Adopt the new “quality” philosophy.
3. Building quality into the product during production rather than inspecting for quality when the product comes off the production line.
4. End the practice of awarding business on the lowest bid alone; instead look for the best quality and establish a long-term relationship with suppliers.
5. Constantly and forever improve the system of production and service. 6. Institute training for workers in statistical methods of control.
7. Institute modern supervisory methods by which supervisors can help workers to do their jobs. 8. Drive out fear by building a culture that encourages workers to contribute their ideas and
suggestions for improvement.
9. Break down barriers between departments so workers can work together in improving products and services and reducing costs.
10. Eliminate numerical goals for the workforce. 11. Eliminate work standards and numerical quotas.
12. Remove barriers that hinder employees from producing quality work. 13. Institute a vigorous program of education and self-improvement.
14. Put everybody to work to accomplish the transformation. (Deming, pp. 23-24)
Deming also equated quality with customer satisfaction. (Deming, p. 5) Special note should be made of his tenth and eleventh points. Unlike other TQM proponents and the Reinventing Government movement, Deming was diametrically opposed to numerical performance standards and management-by-objective. Instead, Deming argued that the focus should be on improving the process and results would take care of themselves.
Other TQM “pioneers” like Joseph M. Juran argued that the growth of mass production and the separation of different functions into departments led top management to delegate responsibility for quality which eventually led to negative effects on quality. Juran proposed that top management needed to once again become involved in the quality issue to signal its importance to subordinates through mechanism such as quality councils, establishing a quality policy and quality goals. Once goals were established then management needed to provide the necessary resources to achieve them. (Kruger, pp. 150-151)
performance. Crosby argued that management was under a number of erroneous assumptions about quality. First, it is assumed that “quality means luxury or goodness signifying the relative worth of things.” However, Crosby believed that the absence of quality was non-conformance. The second assumption is that “quality is not measurable.” Crosby argued that the cost of non-conformance (doing it wrong) is very measurable. Third, it is assumed that quality problems originate with workers.” Crosby maintained that management leads by example and the workers follow. The final erroneous assumption is that “quality originates in the quality department.” Crosby argued that it is the responsibility of every worker. Crosby proposed a “quality vaccine” including: “do it right the first time; the system of quality is prevention; the performance standard is ‘zero defects’; and, the measurement of quality is the price of non-conformance.” (Kruger, pp. 152-153)
In addition to Deming, Juran and Crosby, other important TQM pioneers are Armand V. Feigenbaum and Koaru Ishikawa. It was Feigenbaum who contributed the notion that quality was the responsibility of everyone in the company and that the “costs of non-quality have to be categorized if they are to be managed.” (Kruger p. 151) Ishikawa’s contribution to the quality movement are quality circles and the now Fishbone diagram. Ishikawa also articulated the importance of not only meeting the needs of external customers, but also the needs of internal customers by championing the idea that “the next process is your customer.” (Kruger, pp. 154-155)
Among all the tenets of TQM, arguably, customer focus is the first among equals because TQM aims to meet or even exceed the expectations of customers. To put it another way, it is customer’s who define quality. Consequently, another important focus of TQM is “doing it right the first time,” and doing so means the continuous improvement of the methods of production and delivery of service, as well as the products and services themselves.1 Nevertheless, it must be noted that TQM is not a quick fix because implementing TQM requires a cultural transformation of the organization and that can take years. TQM has to be seen as an incremental approach that requires a great deal of commitment and patience on the part of the organization’s senior leadership.
What we know today as TQM first emerged as a new management philosophy in the private sector in the early 1980s in response to increasing foreign competition. However, as with most
management reforms, TQM began to find its way into the public sector shortly thereafter. Madison, Wisconsin began applying the principles of TQM as early as 1983.2
Reinventing Government
The other management reform movement sprang from a 1992 book by David Osborne and Ted Gaebler entitled, Reinventing Government. Their manifesto decried American bureaucratic institutions as failing because they were products of the industrial age. Osborne and Gaebler (1992) claimed that the current bureaucratic model was “developed in slower-paced society, when change proceeded at a leisurely gait. It developed in an age of hierarchy, when only those at the top of the pyramid had enough information to make informed decisions. It developed in a society of people who worked with their hands, not their minds.” (Osborne and Gaebler, 1992, p. 15) In their opinion, the bureaucratic model had become inefficient, ineffective and unresponsive. In contrast, Osborne and Gaebler (1992) pointed out that we now live in a different time of “breathtaking change.”
In the new information society, everyone has equal access to information and educated workers demand autonomy. “Today’s environment,” argued Osborne and Gaebler (1992), “demands institutions that are extremely flexible and adaptable. It demands institutions that deliver high-quality goods and services, squeezing ever more bang out of every buck. It demands institutions that are responsive to their customers, offering choices of non-standardized services; that lead by persuasion and incentives rather than commands; that give their employees a sense of meaning and control, even ownership. It demands institutions that empower citizens rather than simply serving them.” (Osborne and Gaebler, 1992 p. 15)
Osborne’s and Gaebler’s book was very influential in government circles at all levels when it first appeared in 1992, especially with the new Clinton-Gore Administration in Washington, D.C. Recurring federal deficits and a citizenry discontented with the federal bureaucracy led President Clinton to create the National Performance Review (NPR) shortly after his inauguration in January, 1993. (Notably, Osborne was a consultant to the effort throughout much of its lifetime.) On March 3, 1993 Clinton asked then Vice-President Gore to lead a 6-month review of the federal government. The mission of the NPR was to “reinvent the systems of government, redesign agencies and programs to make them more responsive to their customers, and streamline the government. The system reinvention work (was to) result in a framework for the development and delivery of cost effective policies and programs by the federal government. This framework (would) clarify managers’ accountability for achieving results,
create a focus on clearly identifying and serving the customer, and provide managers the tools and incentives to focus on results.” (Kamensky, 1996, p. 252)
At the end of the 6-month review, Vice President Gore delivered 1,250 recommendations to President Clinton in over 38 reports consisting of approximately 2,500 pages. The overall recommendations were entitled, From Red Tape to Results: Creating a Government that Works Better and Costs Less. The NPR continued its operations after these initial reports to monitor the implementation and progress of the recommendations. A central focus of the recommendations was on changing internal federal agency cultures by empowering front-line staff and holding them accountable for results. The results as measured by the “customer” included “better and more efficiently delivered services.” To accomplish this empowerment meant reducing the number of people in “overhead functions,” cutting in half the number of regulations, and “developing and publishing customer service standards.” (Kamensky, 1996, p. 252) A second review was initiated in 1994 producing another set of recommendations.3
More recently, some empirical evidence has emerged regarding the power of reinvention strategies to actually improve organizational performance. A study by Gene Brewer and Sally Selden (2000) developed a model for predicting organizational performance using data from the 1996 Merit Principles Survey of the U.S. Merit Systems Protection Board. The 1996 survey sampled 18,163 full-time employees in the 23 largest federal agencies. This particular survey of government employees included statements about job-related behaviors and attitudes, agency characteristics, and the NPR.
Brewer and Selden (2000) hypothesized that a high performance organization were “clear on their missions, define outcomes and focus on results, empower employees, motivate and inspire people to succeed, are flexible and adjust nimbly to new conditions, are competitive in terms of performance, restructure work processes to meet customer needs, and maintain communications with stakeholders.” (Brewer and Selden, 2000, p. 687)
The dependent variables in the model developed by Brewer and Selden (2000) measured employee perceptions of organizational performance and was operationally defined as follows:
1. My organization has made good use of my knowledge and skills in looking for ways to become more efficient.
2. In the past 2 years, the productivity of my work unit has improved.
3
3. The work performed by my work unit provided the public a worthwhile return on their tax dollars.
4. In general, people of my race/national origin group are treated with respect in my organization. 5. Overall, how would you rate the quality of work performed by your current coworkers in your
immediate work group?
6. My organization provides fair and equitable treatment for employees and applicants in all aspects of personnel management without regard to their political affiliation, race, color, religion, national origin, sex, marital status, age, or handicapping condition.4
The independent variables in the model included both agency-level factors and individual-level factors. The agency-level factors included measures of organizational culture, human capital and capacity, agency support for NPR, leadership and supervision, and red tape (i.e., number of management layers). The individual-level factors were: structure of task (flexibility given for accomplishing work); task motivation; public service motivation; and, individual performance.
The model was tested using ordinary least squares regression. Overall, the test showed that the independent variables explained 70 percent of the variation in the employee perceptions of organizational performance. The most influential agency-level factor was organizational culture. Among the individual-level factors, all four of the variables were “modestly important predictors” with “structure of work” the most important and “individual performance” the least important. Overall, the results showed that the most important variables among the factors that influenced organizational performance were efficacy, teamwork, building human capital, structure of task, protection of employees, concern for the public interest, and task motivation. In conclusion, Brewer and Selden (2000) perceived that “These variables have one thing in common: They are elements of a high-involvement workplace strategy. Performance is higher in agencies that empower employees, clients, and other stakeholders.” (p. 706)
Re-inventing Government in State Agencies
Although reinvention reforms may have first taken hold in the federal government, state governments were not far behind during the early half of the 1990s. A 1995 study by Jeffrey Brudney, Ted Herbert, and Deil Wright (1999) investigated 93 types of agencies in all 50 states. Brudney and his colleagues sought to determine the extent and variation that state agencies were implementing 11 different reinvention reforms aggregated from major proponents of reinvention, including Osborne and Gaebler.5
4
The study found that the implementation of these reforms in state agencies were rather limited. (Of course, what became known as reinvention had only emerged three years prior with the publication of Osborne and Gaebler’s book.) The reforms that state agencies claimed to have fully implemented were strategic planning (39.3%), customer service training (20.4%), quality improvement programs (16.7%), and reduction in hierarchical levels (16.6%). The least likely to be fully implemented were greater discretion in procurement (7.1%), greater discretion to carry over funds (5.4%), privatization (5.2%), and simplification of human resource rules (5.0%). When the categories for fully implemented and partially implemented were combined, most state agencies claimed to have deployed customer service training (81.5%), strategic planning (79.4%), quality improvement programs (76.6%), benchmarking (62.0%), decentralization of decision making (54.7%), and measuring customer satisfaction (51.7%). (Brudney et al., 1999, p. 23) However, it must be kept in mind that self-reports are always overstated.
One of the major findings of this study showed that state agencies have a tendency to implement some of these reforms as a package. The 11 reforms were “positively intercorrelated minimally at the .001 level of statistical significance.” (Brudney et al., 1996, pp. 23) Another significant finding was that agency type has a relationship with implementation. Staff agencies, such as finance and human resources, are more likely to implement these reforms than regulatory agencies. Likewise, larger agencies, agencies where the Governor appoints the director, and agencies experiencing dramatic shifts in priorities were more likely to implement reinvention reforms. Finally, certain features of the administrator’s background had a relationship with implementation. Administrators were more likely to implement reinvention reforms if they place a high value on organizational leadership, value customer service, and were more conservative. (Brudney et al., 1999, pp. 27-28)
Results-based Management
While the NPR did not outlive the Clinton-Gore Administration, a more lasting contribution of the reinvention movement was the passage of the federal Government Performance and Results Act of 1993 (GPRA). This legislation “enshrined” strategic planning, performance measurement, and evaluation
1. Training programs to improve client or customer service;
2. Quality improvement programs to encourage team problem solving and to empower employees; 3. Benchmarks for measuring program outcomes or results;
4. Strategic planning that produces clear agency mission statements; 5. Systems for measuring client or customer satisfaction;
6. Simplification and relaxation of human resource (personnel) rules;
7. Increasing manager’s discretion to transfer funds or carry over year-end funds; 8. Privatization of major programs;
9. Reduction in the number of levels in the agency hierarchy;
10. Decentralization of decision making to lower organizational levels; and
of results as a recurring sequence of activities for every federal agency. The intent was to shift focus away from the “activities” or processes of government and to a focus on the results of those processes. Congress articulated several purposes for enacting the legislation, which include:
1. Improving the “confidence of the American people” by holding federal agencies accountable for results;
2. Improving the efficiency and effectiveness of each agency through a new focus on results, service quality, and customer satisfaction;
3. Helping federal managers to improve service delivery through planning and monitoring of results; 4. Improving Congressional decision-making by providing more objective information; and
5. Improving the internal management of each federal agency.
The legislation, enacted with “overwhelming” bipartisan support, was constructed around three distinct processes that include strategic planning, annual performance plans, and annual program performance reports.
Under the Act, every federal agency was required to develop a 5-year strategic plan by September 30, 1997. Each plan was to contain a comprehensive mission statement, general goals and objectives (including outcome-related goals), strategies, key external factors that could affect the achievement of the agency’s general goals, and the method for evaluating and revising goals and objectives. By 1999, each agency was expected to prepare an annual performance plan that established annual, quantifiable performance goals and set out the level of performance (targets) to be achieved. Beginning in March of 2000, and every year thereafter, each federal agency was expected to issue a program performance report to the President and Congress. Each report, beginning in fiscal year 2001, was to include results from the previous two fiscal years for each performance goal. If the performance goal is not met, the report has to explain why and what action is to be taken to meet it.
In spirit with the GPRA, the Bush Administration used performance analyses in making decisions about the 2003 federal budget. This was the first time an administration has done so. The Bush Administration used the review to reward programs that were high performing at the expense of programs that were low performing or duplicative. In addition, reviews were used to set performance targets for some programs and to eliminate others.
Results-Based Management in State Agencies
they use it in their agency.6 (p. 160)
In addition, Berry and Wechsler (1995) noted 5 trends in the evolution of strategic planning in state agencies. First, a “substantial number” said that the process had become more inclusive of both internal and external stakeholders. (p. 163) Second, respondents generally cited that strategic planning was becoming more formalized, such as establishing a staff capacity to manage the process. Third, there is a move to longer time horizons for strategic planning. Generally, respondents indicated they were moving from a 1- or 2-year cycle to a 5-year cycle. Fourth, the integration of strategic planning and a “broader, organization-wide total quality management initiative” (TQM) was cited by a number of respondents. Finally, “several” respondents indicated that it was easier to “update and revise plans” than to start over from scratch. (Barry and Wechsler, 1995, p. 164) In their conclusions, Berry and Wechsler (1995) said they found “very little disillusionment” with strategic planning among those state agencies that use it. (p. 165)
In addition to strategic planning, successful results-based management requires the development and management of performance measures. In a survey of state budget officers and state agency staff, Julia E. Melkers and Katherine G. Willoughby of Georgia State University, and in association with Government Accounting Standards Board staff, sought data in response to five basic questions:
1. To what extent are performance measures being used? 2. In what ways are performance measures being used?
3. How effective are the performance measures that are being used? 4. How are performance measures being maintained and communicated? 5. How are performance measures being implemented?
6 Some of Berry and Wechsler’s (1995) other major findings included:
1. Almost all the respondents (96%) cited the desire to set program and policy direction as an important objective of the strategic planning process. A majority (55%) identified program and policy direction as the most important objective they hoped to achieve. (p. 162)
2. Nearly 2 in 3 (65%) cited “cutback management” pressures and 60 % the “need to resolve competing agency resource allocation priorities” as very important objectives in adopting strategic planning. However, only 1 in 10 cited these factors as the most important objective of strategic planning in their agency. (p. 162)
3. Over half said that the most important objective of strategic planning in their agency was to “assert their personal leadership.” (p. 162)
4. Approximately 3 out of 4 respondents said that the agency used SWOT in their strategic planning process. (p. 162)
5. Three-fourths of the respondents claimed that they do link the strategic planning process with the agency’s budget process. However, some respondents indicated that linkages were usually made 1 or more years after implementing strategic planning. (p. 163)
6. Although somewhat uncommon, some agencies link “strategic planning to budgeting and evaluation processes by undertaking benchmarking and establishing outcome performance measures in the strategic plan.” (p. 163)
The survey showed that most state agencies were using input (63.1%), activity/process (60.1%), and output measures (62.9%). A little more than half said they were using outcome measures (51.9%). One-third (33.6%) claimed to be using “cost/efficiency measures, and approximately one-fourth said “quality/customer satisfaction measures” (24.8%), “explanatory measures” (23.2%), and benchmarks (26.7%). (GASB/NAPA, 1997, p. 6)
When asked if they used performance data for comparison purposes, while 42.3% of state agencies said they “always” compared “with prior periods,” only 27.0% said they always compared “with established targets,” 11.9% said they always compared “with national standards or guidelines from federal agencies, accreditation, and/or professional groups,” and 3.1% said they always compared “with programs/services of other governments.” (GASB/NAPA, 1997, p. 12)
The survey respondents were also asked the effectiveness of their measures. Among state agencies, most (58.1%) claimed that their measures helped to increase “awareness of, and focus on, results.” Approximately 60% of state agencies agreed or strongly agreed that performance measures have increased efficiency. (GASB/NAPA, 1997, pp. 15-16)
Less than half of state agencies claimed the following benefits: • Improved the effectiveness of the agency’s program (43.7%) • Changed strategies to achieve desired results (47.0%)
• Improved communications between departments and programs (43.4%) • Improved communications with the public about agency performance (34.0%) • Improved responsiveness to customers (44.3%)
• Improved program/service quality (38.8%)
• Improved cross agency cooperation/coordination (29.6%)
• Improved external government cooperation/coordination (23.9%) • Increased awareness of factors that affect performance results (40.6%)
On the issue of how performance measures are communicated, while most (84.2%) said that they were communicated by budget requests, or by annual reports (67.8%), only 35.5% said that they were communicated by “reports to citizens, stakeholders, or clients/customers.” (GASB/NAPA, 1997, p. 22)
In terms of the “important aspects of a successful performance measurement system,” state agencies rated the following aspects the highest:
• “Performance measures that help staff monitor progress toward intended program/service results,” (71.2%)
• “A link of performance measures to the strategic plan,” (63.9%)
• “Adequate technology for collecting, analyzing, and reporting performance measures,” (63.7%) • “Regular use of performance measures by executive leadership,” (61.6%)
• “Staff participation in the process of developing performance measures,” (58.2%) (GASB/NAPA, 1997, pp. 23-24)
The Malcolm Baldrige National Quality Award
Although rooted in Total Quality Management, the federally sanctioned awards criteria known as the Malcolm Baldrige National Quality Award now encompasses most of the management practices under discussion, including results-based management.
Federal law established the Baldrige National Quality Award in 1987 (Public Law 100-107) to recognize organizations that demonstrated quality practices and performance excellence and to promote quality management practices. The Award was created in response to America’s declining productivity growth relative to foreign competition during the 1970s and 1980s. The Award is integrated into seven basic categories which today include: (1) Leadership; (2) Strategic Planning; (3) Customer and Market Focus; (4) Information and Analysis; (5) Human Resource Focus; (6) Process Management; and (7) Business Results. Winners of the Baldrige Award are chosen only if they exceed the standards for performance excellence, and not if they happen to score the most points on the criteria. In other words, if an award category does not have an applicant that exceeds the performance standards, then an award is not given in that category. For example, even though educational organizations became eligible in 1999, an educational organization was not recognized until 2001. To date, no healthcare organization (which also became eligible in 1999) has been recognized.
The Baldrige Award criteria under went major changes in its first seven years, with fewer significant changes in the years leading up to the present day. However, in the spirit of continuous process improvement (as would be expected), some modifications are made each year with more significant changes taking place on a two-year cycle. (Vokurka, 2001, p. 16) Although most of the seven categories have changed in name, they have not changed in concept. Over the years, the number of items has been reduced from 62 to 19 (18 in 2002) and the areas to address from 278 to 27 (34 in 2002). (Vokurka, 2001, p. 17) Perhaps the most significant change has been the growing emphasis placed on business results. In 1988, Customer Satisfaction held the most points in the Baldrige score. However, by 1997 the emphasis switched to business results where today it is 45% of the total score.
Although the Baldrige does not presently have a category for government, most of the state quality award organizations do recognize government agencies for the quality initiatives. A survey of state quality award organizations, conducted by the author of this dissertation in 2000, found hundreds of local, state and federal agencies having received a quality award or having been recognized as early as the late 1980s. (Frazier, unpublished) In state government alone, at least 122 state departments and agencies have either won a quality award or been recognized for their quality achievements since 1993.
PURPOSE OF THE STUDY
Some of the major themes in the reform movements previously discussed include: long-range planning, management-by-fact, customer-focus, employee empowerment, different approaches to organizing and inspiring employees, and continuous improvement. The purpose of this study is to determine whether the implementation of these major themes produces any perceived effects on a group of state agencies. The specific management practices being assessed include strategic planning (long-range planning), performance measures and performance feedback (management-by-fact), customer service (customer focus), empowerment, teamwork, training, rewards and recognition (approaches to organizing and inspiring employees) and process improvement (continuous improvement). Each of these strategies represents one of five Baldrige categories (i.e., Strategic Planning; Customer and Market Focus, Information and Analysis, Human Resource Focus, and Process Management).
Specifically, this study examines two aspects of the effects of management practices among employees of state agencies.
First, this study correlates the perceptions of state revenue employees regarding the extent the nine management practices are deployed with their perceptions of results to determine if there is a positive relationship and the strength of that relationship. The result indicators include taxpayer satisfaction, improvements in processes, service delivery, job satisfaction and morale.
Second, it compares state revenue employee perceptions of deployment and results by employees’ position within the agencies (e.g., manager, front-line supervisor, and non-supervisor). Employee perceptions of deployment and results were compared to their position in the agency in order to determine whether different levels have differences of opinion.
BASIC RESEARCH METHODOLOGY OF THIS STUDY
practices and whether they have won or received recognition for being a quality organization. Another purpose of the survey was to identify at least eight state revenue agencies that would be willing to participate in a survey of their employees.
Any agency that agreed to participate was asked to circulate a survey to its employees that measured employee perceptions as to the degree the nine management practices were deployed within their agency, and their perceptions of certain results. The employees were given the opportunity to complete a web-based survey that they entered through a URL address embedded in an e-mail message. Comparing the eight state revenue agencies provides evidence as to whether the perceived deployment of the nine management practices leads to better, worse or no significant difference in perceived results; and, whether different levels of authority within the agencies have different perceptions of deployment and results.
In addition, objective performance data was collected. Again, a comparison provides evidence as to whether the impact of these management practices, as perceived by employees, leads to better, worse or no significant difference in actual performance.
Once the analysis of the employee survey was concluded, a number of employees were interviewed among the participating agencies to probe for explanations of key findings.
UNIT OF ANALYSIS: STATE REVENUE AGENCIES AND THEIR EMPLOYEES
Unlike the private sector, public organizations are often plagued with goal ambiguity; uncertainty about what it is they are expected to achieve. Expectations can be varied and conflicting because of poorly written legislative mandates, inadequate funding, changes in political leadership, or pressure from outside groups. Even when expectations are clear, those expectations may be very difficult to measure. Consequently, public agencies have more difficulty than private organizations in assessing their performance.
In his book, Inside Bureaucracy, Anthony Downs describe private organizations as being two-sided. On one side they buy inputs to produce outputs. On the other side, private organizations face output markets to sell what they produce. If they can sell what they produce for more than what they paid for the input, private organizations remain in business. This provides a “voluntary quid pro quo” which allows for an “automatic evaluation of the work of the producer.” (p. 29)
“As a result,” the bureau’s ability to obtain income in a market cannot serve as an objective guide to the desirability of extending, maintaining, or contracting the level of expenditures it undertakes. Nor can it aid the bureau in determining how to use the resources it controls, or in appraising the performance of individual bureaucrats. In short, the major yardsticks for decisionmaking used by private nonbureaucratic firms are completely unavailable to men who run bureaus.” (p. 30)
Anthony Downs astutely describes the fundamental differences between private and public organizations and the difficulty of gauging when a public agency is successful in accomplishing its mission. The problem is compounded when attempting to find a “yardstick” by which to compare the performance of two or more agencies. Differences in legislative mandates, administrative rules and organizational structure make it very difficult to find common measures to make comparisons on agency performance.
The reason for selecting state revenue agencies as the unit of analysis is because these agencies generally have a clear technology. In other words, the links between input, process, outputs, and results are “clearly and tightly connected.” A program is said to have a clear technology when the “inputs clearly and consistently lead to the processes and then to specific early, intermediate and final outcomes.” (Swiss, 1998, p. 430) The processes among state revenue agencies are also essentially the same. These agencies issue tax forms, educate and assist taxpayers, process returns and deposit tax revenue, audit returns for fairness and accuracy, detect, investigate and seek prosecution of tax-related fraud, and issue refunds of overpayment. Because these agencies have clear technology it was hoped that common measures could be found to compare across agencies.
The types of tax revenue collected by these agencies include income, sales, property, estate, and excise taxes (e.g., gasoline, cigarette, beer wine, and liquor, tobacco). It should also be noted that some state revenue agencies have responsibility for functions other that tax administration. The other functions most common are the regulation of motor vehicles and child support enforcement.
Another reason why state revenue agencies were selected is because they have been active in seeking recognition and awards from state quality awards organizations that use a Baldrige-based criteria. In seeking recognition, an organization has to conduct a self-assessment using either the current Baldrige criteria or something very similar, in order for a state team of examiners to provide feedback on strengths and areas for improvement. The Baldrige criteria models’ all of the management practices being considered in this study. At least ten state revenue agencies have sought state-level recognition or awards from their respective state quality organizations since 1994 and others have used the Baldrige criteria to do organizational assessments of their practices.
impressive innovation and experimentation in tax administration . . . States are testing and adopting new services and (in) auditing and collection powers and procedures, and they are experimenting with methods to mold taxpayer attitudes. Computer technology is fast being installed, not only in tax form processing and auditing but in collections and services functions as well.” (p. 909)
SIGNIFICANCE OF THIS STUDY
While there has been research on management reforms in the public sector, most of that research falls into the category of descriptive or single-case research. Contrary to the wide-spread use of these practices in public sector organizations, there has been little empirical research conducted on the impact of management reforms on their performance. (Brewer and Selden, p. 686) Likewise, there is little evidence that the nine management practices in question have any impact on public sector performance, and whether employees at different levels in public sector organizations perceive them differently.
More importantly, little, if any, research has been conducted on the impact of management reforms as a comprehensive and integrated whole. Proponents claim that while any of these reforms may produce higher outcomes in isolation, achieving optimal organizational performance would require the implementation of all these reforms in a symbiotic relationship. In their 1985 book, Toward a Systemic Education of Systems Scientists, Jamshid Gharajedaghi and Russell K. Ackoff argued that a system as a whole couldn’t be studied by their separate parts. “Because the effects of the behavior of the parts of a system are inter-dependent, it can be shown that if each part taken separately is made to perform efficiently as possible, the system as a whole will not function as effectively as possible . . . The performance of a system is not the sum of the independent effects of its parts; it is the product of their interactions. Therefore, effective management of a system requires managing the interactions of its parts, not the actions of its parts taken separately.” (Patton 1990, pp. 79-80)
Even though the state revenue agencies are self-selected and the data collected is largely based on employee perceptions, this study provides more empirical evidence than previously available regarding the effectiveness of each of the nine management practices on results within a public sector agency. It also provides empirical evidence of the symbiotic effects of these practices as a whole on results. In addition, the study provides empirical evidence (where little currently exists) regarding the deployment of these nine management practices from the perspective of employees at different levels within the organization, especially rank-and-file employees.