ISSN(Online): 2320-9801
ISSN (Print) : 2320-9798
I
nternational
J
ournal of
I
nnovative
R
esearch in
C
omputer
and
C
ommunication
E
ngineering
(An ISO 3297: 2007 Certified Organization)
Vol. 4, Issue 10, October 2016
Fuzzy Logic Based Sparse Coding Outlier
Detection Using Root Mappings and Density
Clustering Framework in Unsupervised Data
A.Subhasheni1, R.Rangaraj2
M.Phil Scholar, Hindusthan College of Arts and Science, Coimbatore, India1
Associate Professor & Head, Hindusthan College of Arts and Science, Coimbatore, India2
ABSTRACT: Anomaly detection is a fundamental issue in data mining, specifically it has been used to detect and remove anomalous objects from data. Outliers arise due to mechanical faults, changes in system behavior, fraudulent behavior, network intrusions or human error. In this paper, proposed an optimal “Fuzzy logic based sparse coding outlier detection using root mappings and Density clustering framework in Unsupervised data (FSRD)” incorporates clustering concept, which is the process of deriving the information from the unsupervised dataset. An efficient outlier detection and data clustering capabilities in the presence of outliers, and based on filtering of the data after clustering process. The proposed algorithm detects the outlier experiments into three stages namely (i) Saliency Detection in Images; (ii) Abnormal Event Detection in Video Streams; and (iii) Real-world UCI benchmark datasets. Through extensive simulations and verification proposed mechanism achieves significantly better detection accuracy than conventional methods such as a negative log activity ratio (NLAR) strategy based detection.
KEYWORDS: Outlier Detection, Sparse, Fuzzy logic, kernel mapping.
I. INTRODUCTION
Data Mining consists of more than collecting and managing data; it also includes analysis and prediction. Data Mining can be performed on data represented in quantitative, textual, or multimedia forms. Data Mining applications can use a variety of parameters to examine the data. They include association, sequence or path analysis, classification, clustering, and forecasting. Many simpler analytical tools utilize a verification-based approach, where the user develops a hypothesis and then tests the data to prove or disprove the hypothesis.
The period of high dimensional data has guided in an unprecedented interest in efficient detection of abnormal data in multiple scientific disciplines. Outlier detection algorithms play a crucial role in detecting the abnormal patterns that significantly deviate from the norm. Over the last few decades, the problem of outlier detection has continued to garner interest from both academic researchers and practitioners working on real-world applications. Outlier detection is fundamental to many real-world applications, such as fraud detection [1], network intrusion [2], clinical diagnosis [3], customer relations management [4] and biological data analysis [5], [6].
Anomaly detection is the identification of abnormal events or patterns that do not conform to expected events or patterns. Detecting anomalies is important in a wide range of disparate fields, such as, diagnosing medical problems, bank and insurance fraud, network intrusion, and object defects. Generally anomaly detection algorithms are designed based on one of three categories of learning: unsupervised, supervised, and semi-supervised. These techniques range from training the detection algorithm using completely unlabelled data to having a pre-formed dataset with entries labeled normal or abnormal. A common output of these techniques is a trained categorical classifier which receives a new data entry as the input, and outputs a hypothesis for the data points abnormality.
ISSN(Online): 2320-9801
ISSN (Print) : 2320-9798
I
nternational
J
ournal of
I
nnovative
R
esearch in
C
omputer
and
C
ommunication
E
ngineering
(An ISO 3297: 2007 Certified Organization)
Vol. 4, Issue 10, October 2016
anomalous compared to the rest of the dataset. The final type, contextual, occurs when a record is only considered anomalous when it is compared within the context of other meta-information.
Clustering is an unsupervised pattern recognition technique which automatically seeks to gather objects in "natural" groups. In addition to providing a natural classification, clustering gives an insight into the underlying structure of the data. The goal is that the objects in each cluster are similar while the different clusters are dissimilar. To do this we need to define a proximity measure that quantifies what we mean by these terms. A proximity measure is either a similarity measure or a dissimilarity measure, where a much used example of the latter is the Euclidean distance. The different ways of defining proximity is part of the reason why many different clustering procedures have been developed, ranging from simple heuristics suitable for a particular type of dataset to general iterative schemes which seeks to optimize some associated optimality criterion.The rest of this paper is organized as follows. In Section 2 review the existing related work. The proposed models and descriptions are described in Section 3. Finally conclude the paper in Section 4.
II. LITERATURE SURVEY
In [1] authors discussed robust procedures for univariate, low-dimensional, and high-dimensional data such as estimation of location and scatter, linear regression, principal component analysis, and classification. PCA is a very popular dimension-reduction method. It tries to explain the covariance structure of the data by a small number of components. These components are linear combinations of the original variables and often allow for an interpretation and a better understanding of the different sources of variation. PCA is often the first step of the data analysis, followed by other multivariate techniques. In [2] authors presented an efficient algorithm for learning SISC bases. The method is based on iteratively solving two large convex optimization problems: The first, which computes the linear coefficients, is an L1-regularized linear least squares problem with potentially hundreds of thousands of variables. Existing methods typically use a heuristic to select a small subset of the variables to optimize, but we present a way to efficiently compute the exact solution. The second, which solves for bases, is a constrained linear least squares problem. In [3] authors proposed framework uses a novel measurement for the quality of the sparse representation, inspired by the robustness of the
ℓ1 regularization term in sparse coding. In the case of unsupervised classification and/or clustering, a new initialization based on combining sparse coding with spectral clustering is proposed. This initialization clusters the dictionary atoms, and therefore is based on solving a low dimensional eigen-decomposition problem, being applicable to large datasets. In [4] authors proposed a method for detecting distance-based outliers in data streams under the sliding window model. The novel notion of one-time outlier query is introduced in order to detect anomalies in the current window at arbitrary points-in-time.
III. PROPOSED METHODOLOGY
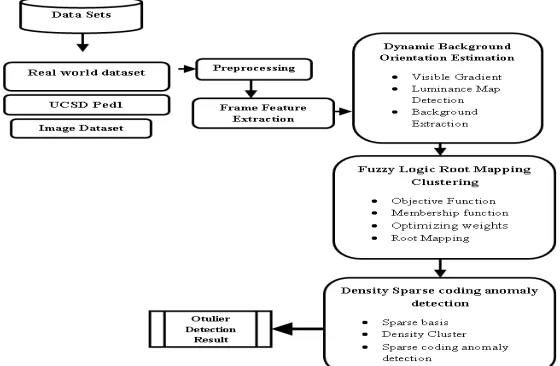
The proposed architecture accepts the Anomaly detection parameters as input which contains the MATLAB simulation where the novel Fuzzy logic based sparse coding outlier detection algorithm is applied to the synthetic and real-world dataset. This overall proposed architecture in figure 1.1 follows a high dimensional classification from the begin to end state.
ISSN(Online): 2320-9801
ISSN (Print) : 2320-9798
I
nternational
J
ournal of
I
nnovative
R
esearch in
C
omputer
and
C
ommunication
E
ngineering
(An ISO 3297: 2007 Certified Organization)
Vol. 4, Issue 10, October 2016
A. FEATURE EXTRACTION
Feature extraction is done without local decision making, the result is often referred to as a feature image. Consequently, a feature image can be seen as an image in the sense that it is a function of the same spatial (or temporal) variables as the original image, but where the pixel values hold information about image features instead of intensity or color. Image Data preprocessing is a Image mining technique that involves transforming raw data into an understandable format. Real-world data is often incomplete, inconsistent, and/or lacking in certain behaviors or trends, and is likely to contain many errors. Data preprocessing is a proven method of resolving such issues.
The input images are first separated into amount of pixels, which are separated into non-overlapping pixels. The image pixel orientation and magnitude are computed for each pixel. A image vectors variation of these bin orientations is formed for each shape. The magnitude of the bin is used as a vote weight. The resulting mean shift grouping pixels are concatenated to form the image descriptor.
Video summarization is a compact representation of a video sequence. It is useful for various video applications such as video browsing and retrieval systems. A video summarization can be a preview sequence which can be a collection of key frames which is a set of chosen frames of a video. Key-frame-based video summarization may lose the spatio-temporal properties and audio content in the original video sequence; it is the simplest and the most common method.
B. DYNAMIC BACKGROUND ORIENTATION ESTIMATION
The orientation field search of particular patterns among the areas in structural real images can be considered as equivalent to figure out a preferential information flux through a net of nodes belonging to a fully-connected graph, being each node a particular anatomical region and each edge a similarity (or dissimilarity) measure between regions. If an image is partitioned and its parts are somehow related together as a fully-connected graph, the interaction process between an user and the image can be modelled as a privileged path of that graph. Some approaches have taken into account the possibility of using graphs and induced Markov chains to model saliency and attention fixations in natural images.
The basic scheme of background subtraction is to subtract the image from a reference image that models the background scene. Typically, the basic steps of the algorithm are as follows:
Background modelling constructs a reference image representing the background.
Threshold selection determines appropriate threshold values used in the subtraction operation to obtain a desired detection rate. Subtraction operation or pixel classification classifies the type of a given pixel, i.e., the pixel is the part of background (including ordinary background and shaded background), or it is a moving object.
C. FUZZY LOGIC ROOT MAPPING CLUSTERING
The objective function of Fuzzy logic is to discover the data points as cluster centroid has to the optimal membership Link for estimating the centroids, and typicality is used for improving the disagreeable effect of anomalies.
The fuzzy aggregation assigns data points to c partitions by using optimal memberships. Let X = {x1, x2, x3… xn} denote a set of data points to be portioned into c clusters, where xi (i = 1, 2, 3 ... n) is the data points. The objective function is to discover nonlinear relationships among the data, kernel (root) methods use embedding linking’s that connectivity features of data to new feature spaces. The proposed technique Fuzzy based kernel mapping (FKM) algorithm is an iterative clustering technique that minimizes the objective function.
Given an dataset, X = {x1…xn}⊂Rp, the original root mapping algorithm partitions X into c fuzzy partitions by
minimizing the following objective function as,
( , , ) =∑ ∑ ‖ − ‖ eqn.(1)
Where c is the number of clusters and selected as a specified value, n the number of data points, uik the membership
link of xk in class i, satisfying the 1
1
c i k i
u
, m the quantity scheming clustering fuzzification, and V the set of cluster
centers or prototypes (vi∈Rp).
D. DENSITY SPARSE CODING ANOMALY DETECTION
The video training 3D data location gradient features in all frames are denoted as X = {x1, x2,…, xn} ∈ Rp×n, collected temporally for Fuzzy training in eq. (3). The research goal is to find a sparse combination set Sparse = {S1,
ISSN(Online): 2320-9801
ISSN (Print) : 2320-9798
I
nternational
J
ournal of
I
nnovative
R
esearch in
C
omputer
and
C
ommunication
E
ngineering
(An ISO 3297: 2007 Certified Organization)
Vol. 4, Issue 10, October 2016
combination, where sparse (S) ≪ query. Each Si belongs to a closed, convex and bounded set, which ensures
column-wise unit standard to prevent over-fitting.
The sparse combination classification has two goals. The first goal – effective representation – is to find K root combinations, which enjoy a small reconstruction error e. It is roughly expressed as,
≜ , , ∑ ∑ || − || eqn. (2)
ℎ ℎ ∑ = 1, = {0, 1} eqn. (3)
where γ = {γ1, γ2, …, γn}and j = {γj1, γj2,…, γjk}.. Each γji indicates whether or not the ith combination Si is chosen for data xj. βji is the corresponding coefficient set for representing xj with combination Si. The constraints Σγji = 1 and γji =
{0, 1} require that only one combination is selected. The objective function makes each training cube x constructible by
at least one basis combination in S.
IV.PERFORMANCEEVALUATION
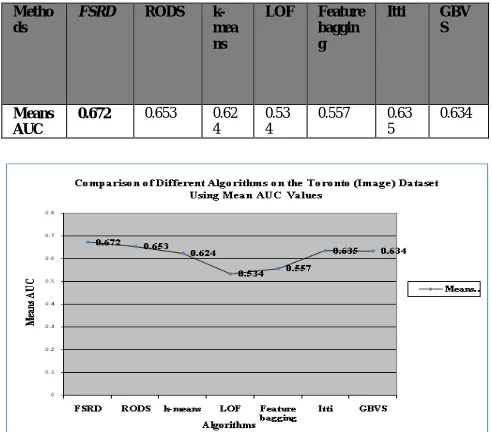
Using the Toronto dataset, the saliency maps generated from the Fuzzy based sparse coding algorithm (FSA) are compared with those from RODS, k-means–, LOF, Feature Bagging and two other well known saliency detection algorithms including Itti [5] and GBVS [6]. It should be noted that the Active-Outlier algorithm cannot be used for this problem since it is supervised and hence was excluded from the comparison.The AUC (Area Under Curve) scores have also been used to evaluate the performance. Table 1 and 2 compares the mean AUC scores (averaged over all the images in the Toronto dataset) along with the average time taken to obtain the results for each algorithm. It can be seen that FSA not only produces the best AUC scores but also achieves it much faster than the competing algorithm.
Table 1: Comparison of Different Algorithms on the Toronto (Image) Dataset Using Mean AUC Values
Metho ds
FSRD RODS
k-mea ns
LOF Feature baggin g
Itti GBV S
Means AUC
0.672 0.653 0.62 4
0.53 4
0.557 0.63
5
0.634
Figure 1.2: Comparison of Comparison of Different Algorithms on the Toronto (Image) Dataset Using Mean AUC Values
ISSN(Online): 2320-9801
ISSN (Print) : 2320-9798
I
nternational
J
ournal of
I
nnovative
R
esearch in
C
omputer
and
C
ommunication
E
ngineering
(An ISO 3297: 2007 Certified Organization)
Vol. 4, Issue 10, October 2016
detection in streaming videos have been used: RODS [7], Sparse [8], MPPCA [9], Social force [10] and LMH [11].Table 2 shows the quantitative performance comparison of the FSRD model with other existing models of RODS. It can be clearly seen that FSRD outperforms other algorithms.
Algorithms FSRD RODS Sparse MPPCA Social force
LMG
Frame-level EER
18.9 19.2 19 35.6 36.5 38.9
Pixel-level EER
30.54 31.7 54 76.8 59.1 67.4
Figure 1.3: Performance of Outlier Detection on the USCD Ped1 Datasets
V.CONCLUSIONANDFUTUREWORK
In this paper proposed an optimal method of FSRD: Fuzzy logic based sparse coding outlier detection using root mappings and Density clustering framework in Unsupervised data which combines Image, video and Real-world data's. The outlier detection using fuzzy logic with sparse combination for clustering has not previously been attempted. This research work shown that using outlier to approximate local data centers is not only a feasible option, but also frequently leads to improvement over the centroid-based approach. The proposed Sparse combination method had proven to be more robust than the Spatial and temporal anomaly maps baseline on real-world data, as well as in the presence of high levels of artificially introduced noise.In future work requires modifications that can make it applicable for textual mining also. The approach needs to be implemented on more complex datasets using digital processors.
REFERENCES
[1] P. J. Rousseeuw and M. Hubert, “Robust statistics for outlier detection,” Wiley Interdisciplinary Rev.: Data Mining Knowl. Discovery, vol. 1, no. 1, pp. 73–79, 2011.
[2] R. Grosse, R. Raina, H. Kwong, and A. Y. Ng, “Shift-invariance sparse coding for audio classification,” arXiv preprint arXiv:1206.5241, 2012.
[3] I. Ramirez, P. Sprechmann, and G. Sapiro, “Classification and clustering via dictionary learning with structured incoherence and shared features,” in Proc. IEEE Conf. Comput. Vis. Pattern Recog., 2010, pp. 3501–3508.
[4] F. Angiulli and F. Fassetti, “Distance-based outlier queries in data streams: the novel task and algorithms,” J. Data Mining Knowl. Discovery, vol. 20, no. 2, pp. 290–324, 2010.
[5] L. Itti, C. Koch, and E. Niebur, “A model of saliency-based visual attention for rapid scene analysis,” IEEE Trans. Pattern Anal. Mach. Intell., vol. 20, no. 11, pp. 1254–1259, Nov. 1998.
[6] J. Harel, C. Koch, and P. Perona, “Graph-based visual saliency,” in Proc. Adv. Neural Process. Syst., 2006, pp. 545–552.
[7] Jayanta K. Dutta, Bonny Banerjee and Chandan K. Reddy, "RODS: Rarity based Outlier Detection in a Sparse Coding Framework", IEEE TRANSACTIONS ON KNOWLEDGE AND DATA ENGINEERING, VOL. 28, NO. 2, FEBRUARY 2016.
[8] Y. Cong, J. Yuan, and J. Liu, “Abnormal event detection in crowded scenes using sparse representation,” Pattern Recog., vol. 46, no. 7, pp. 1851–1864, 2013. [9] J. Kim and K. Grauman, “Observe locally, infer globally: A spacetime MRF for detecting abnormal activities with incremental updates,” in Proc. IEEE Conf. Comput. Vis. Pattern Recog., 2009, pp. 2921–2928.
[10]R. Mehran, A. Oyama, and M. Shah, “Abnormal crowd behavior detection using social force model,” in Proc. IEEE Conf. Comput. Vis. Pattern Recog., 2009, pp. 935–942.