Evaluation of constraint in semi-large scale experiments performed on
specimens with underclad cracks
Dana Lauerova, Vladislav Pistora, Ales Kacor, Milan Brumovsky
Nuclear Research Institute Rez plc, Rez, Czech Republic
ABSTRACT
During years 2005 – 2006, a series of semi-large scale experiments on specimens containing underclad (embedded) crack were performed in NRI Rez. The experiments were performed within EU PHARE project EUROPAID/116529/D/SV/CZ, in cooperation with VTT, FNS, TVONS (Finland) and Tecnatom (Spain). The aim of the project was to investigate fracture mechanics properties of cladding, in particular, to establish the role of cladding in the fracture/failure process of the specimens, and to exploit the obtained knowledge in the procedure for evaluation of integrity of WWER reactor pressure vessels.
Experimental results of the project are described in details in a parallel paper [1] of this conference (SMIRT 19). In the presented paper, FE evaluation of experiments is described, with focus on prediction of cleavage fracture. This covers, among others, evaluation of J-integral in the moment of 1st pop-in (sudden fracture through) for both upper and lower crack fronts, and evaluation of some type of constraint parameter. Three types of constraint parameter were considered: T-stress based on elastic calculation, T-stress based on elastic-plastic calculation and Q-stress parameter. In the paper, values of these three constraint parameters are compared. Besides of that, approach of effective stress intensity factor KIeff allowing for including constraint
effect into Master Curve concept, as well as approach of J-Q locus were used in considerations aiming to answer the question “which crack front initiated first, upper or lower?”, and the result of these considerations was compared with records of high-speed video camera taken during some of experiments, as described in the parallel paper [1].
INTRODUCTION
The main goal of the project EUROPAID/116529/D/SV/CZ was to investigate fracture mechanics behavior of semi-large specimens with underclad (embedded) cracks, and, based on the results obtained, to select proper failure criteria to be used in reactor pressure vessel integrity evaluation. Total number of 11 experiments were performed on specimens with cladding, containing underclad through thickness cracks. The specimens were manufactured from material 15Kh2MFA of Cr-Mo-V type, specially heat treated to simulate the embrittlement of reactor pressure vessel at the end of design life. Several blocks of this material (before heat treatment) were cut from decommissioned not operated reactor pressure vessel of WWER 440 Type NPP Nord. Each of the specimen contained through-thickness crack embedded in the base material, with 3 mm ligament separating the upper crack front from cladding, and was loaded by 4-point-bending at room temperature. During loading, majority of specimens exhibited pop-ins followed by ductile tearing of cladding and final failure, only 3 specimens fractured through suddenly, without preceding pop-ins. Evaluation of the experiments within the project concentrated on both process of cleavage fracture in the base material and process of ductile tearing in cladding. In the paper, only results concerning cleavage fracture initiation in base metal are described.
GEOMETRY AND LOADING OF THE SPECIMENS
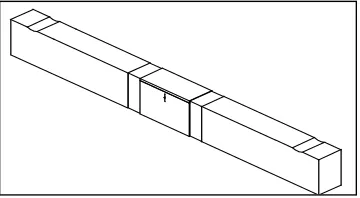
Test specimens are bars for 4-point bending with nominal dimensions 40 x 85 x 670 mm (B x W x L). Two types of specimens were tested: (1) “normal” specimens (Fig.1) with nominal crack depth 15 mm and (2) “abnormal” ones (Fig. 2) with nominal crack depth 40 mm and lower crack front blunted to prevent fracture initiation from this crack front. Total number of specimens tested was eleven, eight of them were normal specimens (1E2 – 1E5, 1E9 – 1E12), three were abnormal ones (1E6 – 1E8). Typical real shape of the crack may be seen in Fig. 3.
Specimens were subject to 4-point bending, the details of experimental set up are described in the parallel paper [1].
BRIEF SUMMARY OF EXPERIMENTAL RESULTS
moment of 1st pop-in (or sudden fracture through) are summarized further in the text, in Table 1. Majority of specimens exhibited pop-ins during experiments (normal specimens 1E2, 1E3, 1E5, 1E11, 1E12, and all abnormal ones 1E6, 1E7, 1E8), only three specimens fractured through without preceding pop-ins (1E4, 1E9, 1E10). In case of specimens that exhibited pop-ins, the crack propagated towards both bottom and top surfaces of the specimen (in the latter case, into cladding), and arrested. The “depths” of crack propagation into cladding were different for different specimens, and depended, in general, on the energy accumulated in the specimen before the pop-in.
Fig. 1. Scheme of normal specimen. Fig. 2. Scheme of abnormal specimen.
Fig. 3. Detail of fracture surface showing Fig. 4. FE mesh for normal specimen crack shape and corresponding FE mesh.
FE EVALUATION OF THE EXPERIMENTS
FE post test analyses were performed using FE code SYSTUS. For each of the specimens, 3D FE mesh was constructed, containing approx. 5000 isoparametric quadratic elements. Mesh refinement near the crack front was relatively high, element size was 0.2 mm. Due to approximate symmetry of the specimens, only one quarter of the body was modeled (Fig. 4). Shapes of the both crack fronts (upper and lower) were modeled according to their actual shapes based on post-test photos (Fig. 3).
MATERIAL PROPERTIES USED IN FE CALCULATIONS
For each of the materials modeled (heat treated base metal, heat treated cladding), full stress-strain curves were available. The following values of tensile material properties were used: RP0.2(BM) = 887.8 MPa,
Rm(BM) = 984 MPa, RP0.2(cladding) = 338 MPa, Rm(cladding) = 594 MPa. For modeling plastic properties in FE
calculation, flow theory with isotropic hardening and large deformations (updated Lagrangian formulation) were used.
To model residual stresses present in the specimens due to cladding procedure applied to the inner reactor pressure vessel surface, the approach of stress free temperature was used. Stress free temperature of 350 ºC was assumed, and corresponding volumetric strains were analytically calculated and then used as input strains (loading) in FE calculation.
RESULTS OF FE CALCULATIONS
In what follows, results of FE analysis appropriate only for the stage of experiments until 1st pop-in (sudden fracture through) are presented. Problems associated with ductile tearing of the cladding are not dealt with in this paper and the attention is paid only to the cleavage fracture process.
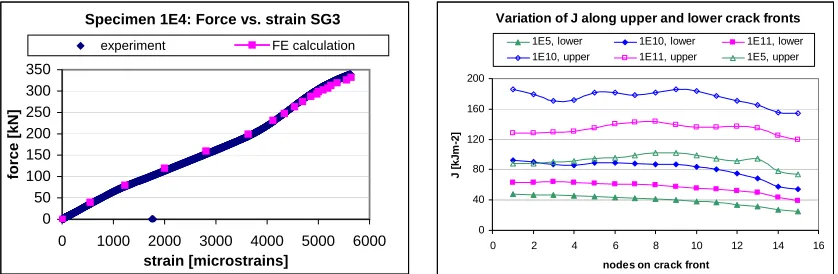
For all specimens, the force vs. LLD and force vs. strain curves were calculated and compared with the experimental ones. In majority of cases, a good accordance between experimental and computational curves was reached (Fig. 5).
Variation of J along upper and lower crack fronts
0 40 80 120 160 200
0 2 4 6 8 10 12 14 16
nodes on crack front
J [kJm
-2]
1E5, lower 1E10, lower 1E11, lower 1E10, upper 1E11, upper 1E5, upper Specimen 1E4: Force vs. strain SG3
0 50 100 150 200 250 300 350
0 1000 2000 3000 4000 5000 6000
strain [microstrains]
force [kN]
experiment FE calculation
Fig. 5. Comparison of computational force vs. strain Fig. 6. Variation of J along crack fronts for 3 selected curve with experimental one for specimen 1E4. specimens at moment of 1st pop-in (sudden fracture)
For all specimens, values of J-integral along both lower and upper crack fronts at the moment of 1st pop-in (sudden fracture through) were determined, using SYSTUS post-processing module based on theta method (in 3D). The corresponding KJ values at 1
st
pop-in (sudden fracture through) were determined using plane strain formula KJ = √(EJ/(1-ν2)). Variations of J-integral along both upper and lower crack fronts are, for
three selected specimens, seen in Fig. 6. In this figure, node No. 1 corresponds to the center of crack front, node No. 15 corresponds to the specimen flank. For all specimens, average values of J-integral over upper and lower crack fronts are summarized in Table 1.
DETERMINATION OF KIeff-VALUES
J-values determined at the moments of 1st pop-in (sudden fracture through) cannot be directly used for description/prediction of cleavage fracture, since due to constraint effect some kind of two-parametric fracture mechanics is necessary. To evaluate the constraint, three types of constraint parameters were calculated: (1) “Elastic T-stress”, (2) “Elastic-plastic T-stress” and (3) Q-stress parameter. Below in the text, procedures for evaluation of these parameters are briefly described, and their values are compared mutually.
As main tool for including the effect of constraint into the evaluation of experiments, the effective stress intensity factor, KIeff, [2] was selected. In calculation of KIeff, values of elastic-plastic T-stress were used. For
calculation of KIeff, the following formulas were used [2]:
min min 0 4 1 0 0 4 min 0
min .( )
) ( ) ( K K K B ds K s K K s K K Tref S I
Ieff − +
⎪⎭ ⎪ ⎬ ⎫ ⎪⎩ ⎪ ⎨ ⎧ ⎟⎟ ⎠ ⎞ ⎜⎜ ⎝ ⎛ − −
=
∫
(1)where the integration is performed along the crack front (of length S), and
KI(s) is the value of calculated stress intensity factor along the crack front,
⎥ ⎦ ⎤ ⎢ ⎣ ⎡ ⎟⎟ ⎠ ⎞ ⎜⎜ ⎝ ⎛ ° − − − ⋅ ⋅ + = C MPa stress T T T s K / 12 019 . 0 exp 77 31 ) ( 0
0 (2)
(
)
[
0]
0 31 77 exp0.019 T T
KTref = + ⋅ ⋅ ref − , (3)
where Tref is a selected temperature for which the resulting KIeff is compared to KIC determined according the
Master Curve formulae; Tref = 20 ºC,
K0 is a position parameter in statistical evaluation of the data, corresponding to probability 0.632,
B0 = 25.4 mm (1T thickness),
Kmin= 20 MPam1/2.
In the calculation of KIeff, experimentally determined values of MC reference temperature T0 appropriate
for the positions of upper and lower crack fronts were used; these values differ only slightly, in particular, T0 =
22.8 ºC for position of upper crack front, and T0 = 19 ºC for position of lower crack front.
Effective stress intensity factor KIeff [2] takes into account possible variation of both KI and K0 with
both temperature and position on crack front, and, moreover, considers effect of constraint expressed in terms of T-stress. In our case, temperature was constant along the crack front, and K0, depending on T-stress in general,
was also taken constant along crack front, since only average values of T-stress (over the crack front) were considered in the calculation of K0. The advantage of using effective stress intensity factor consists in the fact
that its values may be compared directly to fracture toughness values determined experimentally and evaluated in a standard way using Master Curve approach. (KIeff in the presented paper is denoted by KIeffTref in [2].)
Along with KIeff-values also probabilities of fracture were calculated for all specimens according to the
following formula [2]:
⎪⎭ ⎪ ⎬ ⎫
⎪⎩ ⎪ ⎨ ⎧
⎟ ⎟ ⎠ ⎞ ⎜
⎜ ⎝ ⎛
− − − − = ⎪⎭ ⎪ ⎬ ⎫ ⎪⎩
⎪ ⎨ ⎧
⎟⎟ ⎠ ⎞ ⎜⎜
⎝ ⎛
− − −
−
=
∫
4
min 0
min
0 0
4
min 0
min 1 exp
) (
) ( exp
1
K K
K K B
ds K s K
K s K P
Tref Ieff S
I
f (5)
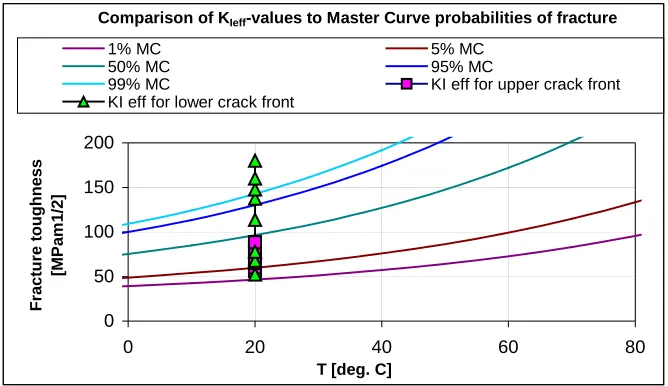
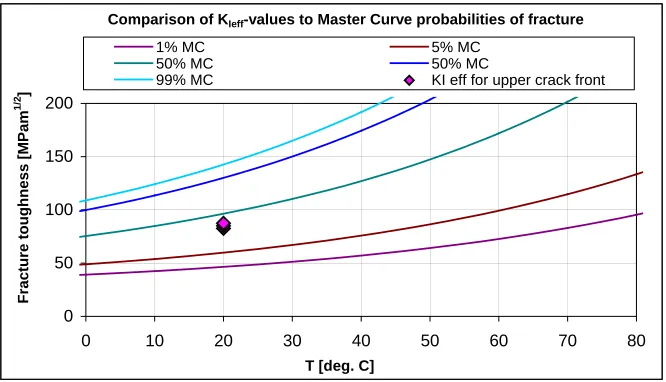
The result of evaluation of KIeff may be seen in Figs. 7 and 8 for normal and abnormal specimens,
respectively. From these figures, it may be concluded that KIeff approach produced data that are, in general, in
relatively good accord with Master Curve theory (despite the fact that three KIeff-values relevant for lower crack
front lie above 99% MC probability of fracture). In Table 1, numerical values of KIeff are summarized for normal
specimens, for both upper and lower crack fronts. From this Table it may be seen that for specimen 1E3 that exhibited 1st pop-in at the lowest load (203 kN), KIeff-value at lower crack front is smaller than that one at upper
crack front, for two other specimens 1E12 and 1E2 exhibiting 1st pop-in at only slightly higher loads (221 and 260 kN, respectively), the KIeff-values at lower crack front are approximately comparable to those at the upper
crack front, and for all remaining normal specimens the KIeff-values at the lower crack front are significantly
higher then those at the upper crack front. Since values of T0 differ only insignificantly for upper and lower crack
fronts, the same conclusion may be drawn, using Eqs. (3) and (5), for probabilities of fracture, i.e., for all specimens with exception of 1E3 the probability of initiation of fracture is higher at the lower crack front than at the upper one, and for specimens 1E12 and 1E2 the difference is not too much high.
Comparison of KIeff-values to Master Curve probabilities of fracture
0 50 100 150 200
0 20 40 60
T [deg. C]
Fracture t
oughness
[MP
a
m
1
/2
]
80
1% MC 5% MC
50% MC 95% MC
99% MC KI eff for upper crack front KI eff for lower crack front
Fig. 7. Position of KIeff -values for both upper and lower crack fronts in standard MC scheme (1T), for normal
Comparison of KIeff-values to Master Curve probabilities of fracture
0 50 100 150 200
0 10 20 30 40 50 60 70 80
T [deg. C]
Fracture toughness [MPam
1/2
]
1% MC 5% MC
50% MC 50% MC
99% MC KI eff for upper crack front
Fig. 8. Position of KIeff -values for upper crack front in standard MC scheme (1T), for abnormal specimens
DETERMINATION OF T-STRESSES
As mentioned above, values of T-stress based on (1) elastic FE calculations and (2) elastic-plastic FE calculations were determined, for all specimens at the moment of 1st pop-in (sudden fracture through). Elastic T-stresses correspond better to the original definition of T-stress as second term in Williams expansion series, nevertheless elastic calculation cannot produce good accordance between experiment and FE calculation, if the response of the specimen is not purely elastic, which was the case for all specimens tested.
The procedure for evaluation of T-stress was similar in both cases of elastic and elastic plastic-calculations: T-stress was obtained as linear extrapolation of “regular” values of σyy on crack face towards the
crack front (“singular” values of σyy in the vicinity of crack front were not taken into account), where σyy is
component of stress tensor parallel to the direction of crack propagation; for illustration of this procedure see Fig. 9 relevant for determination of elastic-plastic T-stress values. In this figure, variations of σyy on crack face in
different sections along specimen half-thickness are plotted. Determination of T-stress is shown for two selected sections, in particular, section denoted by “0” and that one denoted by “18.333”. The first one means mid-plane section of the specimen, while the second one means plane parallel to the specimen flank surface, in distance of 1.667 mm from it. Performing linear extrapolation of the selected “regular” values of σyy (large red and green
triangles) to the upper crack front (x=0), the values of elastic-plastic T-stress appropriate for these sections (for upper crack front) are obtained, i.e. –643 MPa and –900 MPa, respectively.
For the lower crack front, analogous procedure of linear extrapolation was used to determine the T-stress at lower crack front, for both elastic and elastic-plastic calculations. Shapes of elastic-plastic T-T-stress variations on the upper and lower crack fronts did not differ substantially for different specimens; examples of these variations for 3 selected specimens 1E5, 1E10 and 1E11 are seen in Fig. 10.
Values of elastic-plastic T-stresses attached in Table 1 are average values of T-stress (over appropriate crack fronts) for individual specimens. KIeff-values mentioned in previous paragraph were determined based on
these average values of elastic-plastic T-stress. Using elastic-plastic T-stress values for calculation of KIeff
produced better accordance with experiments than using elastic T-stress values.
In Fig. 11, the situation with determination of elastic or elastic plastic T-stress in Full Model (here, specimen 1E12) with respect to determination of T-stress in SSY solution (elastic, or elastic-plastic) is visualized. In this figure, distance “0” on x-axis means crack front (SSY) or upper crack front (1E12), distance approx. “14” means lower crack front (1E12). This figure clearly demonstrates that, when using the procedure of determination T-stress described above, elastic T-stress at the upper crack front is higher than the elastic-plastic one at the upper crack front, and, simultaneously, at the lower crack front the situation is opposite, i.e., elastic T-stress is lower than the elastic-plastic one. This result is relevant to specimen mid-plane section, and is typical for all normal specimens, as may be seen from Fig. 12.
1E10: Variations of sigma yy on crack face
y = 14.554x - 643.01 y = 108.14x - 900.2
-1200 -1000 -800 -600 -400 -200 0
0 1 2 3 4 5 6 7 8 9 10 11 12 13 14 15 16
Distance from the upper crack tip [mm]
S
ig
m
a yy
[
M
P
a]
0 3.333 6.667 10 13.333 16.667 18.333 20
Fig. 9. Elastic-plastic calculation: Variations of sigma yy on crack face in different sections along specimen half-thickness, for specimen 1E10.
Variation of elastic-plastic T-stresses over crack fronts
-1200 -900 -600 -300 0 300
0.00 5.00 10.00 15.00 20.00 1E5 upper 1E5 lower 1E10 upper 1E10 lower 1E11 upper 1E11 lower
1E12: Variations of sigma yy on crack face
-1000 -800 -600 -400 -200 0 200 400
0 2 4 6 8 10 12 14
Distance from the crack front [mm]
Si
g
m
a yy [MPa]
SSY, elastic-plastic SSY, elastic
FM, elastic-plastic FM, elastic
Fig. 10. Variations of elastic-plastic T-stress on upper Fig. 11. Comparison of σyy variations in FM and
and lower crack fronts for selected specimens and SSY model, for elastic and elastic-plastic calculations
Elastic-plastic T-stress vs elastic T-stress
-1000 -800 -600 -400 -200 0 200
-1000 -800 -600 -400 -200 0 200
Elastic T-stress [M Pa]
E
last
ic-p
last
ic
T
-st
re
s
s
[M
P
a
]
lower crack front upper crack front 1:1 line
1E11: Stress opening crack vs. rsig0/J
0 500 1000 1500 2000 2500 3000 3500
0 1 2 3 4 5 6 7 8 9 10 11 12
rsig0/J
S
tr
ess
o
p
en
in
g
cr
ac
k [
M
P
a]
SSY FM, 1E11, lower FM, 1E11, upper
Fig. 12. Comparison between elastic and elastic-plastic Fig. 13. Determination of Q-stress parameter for T-stress (in mid-thickness section), normal specimens upper and lower crack fronts of specimen 1E11.
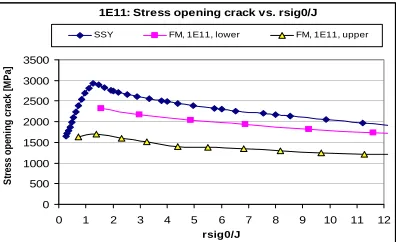
DETERMINATION OF Q-STRESS PARAMETER
Q-stress parameter was determined (based on elastic-plastic calculations), for the specimen mid-thickness section only, for each of normal specimens. For calculation of Q the following formula based on crack opening stress (σxx) was used:
0
0 ,
) ( ) (
σ σ
σ − =
= xx FM xx SSYT
Q (6)
where (σxx)FM is the stress opening the crack in the “Full Model”, i.e. in the examined specimen;
(σxx)SSY, T=0 is the stress opening the crack in the reference 2D SSY solution (with T-stress=0);
(both stress components were calculated in front of the crack front, on the symmetry plane, i.e. in the “middle” of the specimen, on line parallel to direction of crack propagation);
σ0 is the yield stress of the base metal, i.e. σ0=887 MPa .
For all normal specimens, similar diagrams as that one seen in Fig. 13 (specimen 1E11) were constructed (r means distance from the crack front), and Q-values for both upper and lower crack fronts were determined according to Eq. (6). Since Q depends moderately on in which value of non-dimensional distance rσ0/J it is determined, different values of rσ0/J were considered (rσ0/J = 2, 4, 6, 8, 10). The result may be seen in
Figs. 14 and 15, where graphs of J-Q locus are plotted, for both upper and lower crack fronts, respectively, for all normal specimens. From these figures it is seen that for the upper crack front the particular graphs of J-Q locus have usual shape, i.e. relation “the lower is Q, the higher is J” is approximately valid. For the lower crack front, this relation is true only for couples of values (Q, J) corresponding to low loads (approximately for three couples of values (Q, J) with lowest J-values, for each of J-Q locus graphs of rsig0/J = 2, 4, 6 and approximately also 8), and for the other data-points the opposite tend is observed. This situation at the lower crack front may be characterized as change in trend in J-Q locus between lower and higher loads, with value of J distinguishing between these trends equal to approx. 30 or 40 kJm-2. This result may be associated with the fact that at higher loads the stress fields of both crack fronts may affect each other (in some sense, the effect of upper crack front prevails, in consequence of which the relation between Q-and J mentioned above remains valid for the upper crack front and is partially violated for the lower one). Nevertheless, disregarding the reason for such behavior, it follows from Fig. 15 that for higher loads (for J above approx. 30 kJm-2) the constraint at the lower crack front increases with loading, making thus the fracture initiation at the lower crack front more likely. This result supports the idea arising from both experimental results (fast video camera records [1]) and evaluation of experiments based on KIeff (as described above), i.e. the idea that lower crack front initiated first, at least for
specimens exhibiting 1st pop-in (sudden fracture through) at higher loads.
J-Q locus, lower crack front
0 20 40 60 80 100 120 140
-0,6 -0,5 -0,4 -0,3 -0,2
Q
J [
k
Jm
-2
]
rsig0/J=2 rsig0/J=4 rsig0/J=6 rs ig0/J=8 rs ig0/J=10 J-Q locus, upper crack front
0 50 100 150 200 250 300
-1.4 -1.2 -1 -0.8 -0.6
Q
J
[
kJm
-2]
rs ig0/J=2 rsig0/J=4 rsig0/J=6 rs ig0/J=8 rsig0/J=10
Fig. 14. J-Q locus graphs for upper crack front Fig. 15. J-Q locus graphs for lower crack front
Q*sig0 (in rsig0/J=6) vs. elastic-plastic T-stress
-1000 -800 -600 -400 -200 0 200
-1000 -800 -600 -400 -200 0 200
Elastic-plastic T-stress [MPa]
Q
*si
g
0
(i
n
r
s
ig
0/
J
=
6)
[M
P
a
]
lower crack front upper crack front 1:1 line
Q*sig0 (in rsig0/J=6) vs. elastic T-stress
-1000 -800 -600 -400 -200 0 200
-1000 -800 -600 -400 -200 0 200
Elastic T-stress [MPa]
Q*sig0 [MPa]
lower crack front upper crack front 1:1 line
Fig. 16. Comparison between Q-stress parameter and Fig. 17. Comparison between Q-stress parameter and elastic-plastic T-stress for normal specimens elastic T-stress for normal specimens
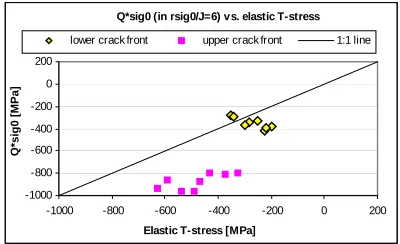
Comparison between constraint parameter Q and elastic-plastic T-stress is seen in Fig. 16, where values of Q*σ0 (with Q determined, for the sake of uniqueness, in rσ0/J = 6) were plotted against elastic-plastic T-stress.
In addition to Figs. 12 and 16, Fig. 17 showing comparison between elastic T-stress values and Q-values for both upper and lower crack fronts, was constructed. All data points in Figs. 16 and 17 are relevant for specimen mid-thickness section.
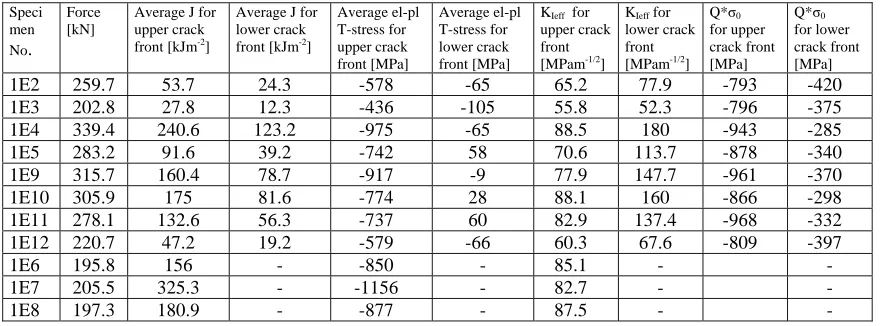
Table 1. Values of selected characteristics at the moment of 1st pop-in (sudden fracture through)
Speci men No.
Force [kN]
Average J for upper crack front [kJm-2
]
Average J for lower crack front [kJm-2
]
Average el-pl T-stress for upper crack front [MPa]
Average el-pl T-stress for lower crack front [MPa]
KIeff for upper crack front [MPam-1/2
]
KIeff for lower crack front [MPam-1/2
]
Q*σ0 for upper crack front [MPa]
Q*σ0 for lower crack front [MPa]
1E2 259.7 53.7 24.3 -578 -65 65.2 77.9 -793 -420
1E3 202.8 27.8 12.3 -436 -105 55.8 52.3 -796 -375
1E4 339.4 240.6 123.2 -975 -65 88.5 180 -943 -285
1E5 283.2 91.6 39.2 -742 58 70.6 113.7 -878 -340
1E9 315.7 160.4 78.7 -917 -9 77.9 147.7 -961 -370
1E10 305.9 175 81.6 -774 28 88.1 160 -866 -298
1E11 278.1 132.6 56.3 -737 60 82.9 137.4 -968 -332
1E12 220.7 47.2 19.2 -579 -66 60.3 67.6 -809 -397
1E6 195.8 156 - -850 - 85.1 - -
1E7 205.5 325.3 - -1156 - 82.7 - -
1E8 197.3 180.9 - -877 - 87.5 - -
DISCUSSION AND CONCLUSION
Using KIeff-approach (with including constraint effect via elastic-plastic T-stress) in evaluation of
experiments produced relatively good accordance between the obtained KIeff-values and Master Curve
predictions made for experimentally determined values of T0. This result may be considered as confirmation of
applicability of both Master Curve and KIeff-approach. Besides that, evaluation of experiments based on KIeff
-approach indicated that initiation of cleavage fracture is more probable to occur first at the lower crack front, mainly for specimens that exhibited 1st pop-in (or sudden fracture through) at higher loads. This result seems to be supported by fast video camera records taken during some of experiments [1].
Results of determination Q-stress parameter show typical shape of J-Q locus for upper crack front, and indicate a change in trend in J-Q locus for the lower crack front (as seen in a most pronounced way in the case of J-Q locus based on rsig0/J = 2, and in a less pronounced way in the cases of J-Q locus based on rsig0/J = 4 and 6). In these cases, for higher loads (values of J at lower crack front higher than approx. 30 or 40 kJm-2), Q increases with increasing J. This means that for higher loads the constraint at lower crack front increases with increasing loading, which, in turn, increases the probability of fracture at this crack front. The reason why the J-Q locus for the lower crack front exhibits the change in trend is not dealt with in the paper, only a hypothesis is mentioned that it could be a consequence of mutual affecting of the stress fields of both crack fronts.
In association with calculation of KIeff, procedure for determination of elastic and elastic-plastic
T-stresses was proposed and described. Values of three constraint parameters were mutually compared (for specimen mid-thickness sections), the result of comparison (Figs. 12, 16 and 17) is in accord with expectations, mainly as far as relation between Q and elastic T-stress is concerned, as can be seen e.g. from paper [3] (Fig. 3 of [3]). As far as elastic-plastic T-stress are concerned, some modifications in the procedure of their determination are possible, and the authors in the presented paper tried to contribute to elucidation, at least partial, of the situation with both their determination and possibility of their applicability.
REFERENCES
[1] Pistora, V., Brumovsky, M., Kohopaa, J., Lauerova, D., Wallin, K.: “Semi-Large Scale Experiments Performed on Specimens with Underclad Cracks”, paper No. 2029 in SMIRT 19 Conference, Toronto, 2007. [2] Wallin, K., Rintamaa, R.: “Use of the Master Curve Methodology for Real Three-Dimensional Cracks”, 18th International Conference on Structural Mechanics in Reactor Technology (SMIRT 18), Beijing, China, August 7-12, 2005.