FATIGUE CRACK GROWTH AND STRESS INTENSITY FACTOR
SIMULATION OF SUBSURFACE FLAWS CLOSE TO COMPONENT
SURFACE
Pierre Dulieu1, Valéry Lacroix2, and Kunio Hasegawa3
1
Design Engineer, Tractebel Engineering, BE 2
Principal Engineer, Tractebel Engineering, BE 3
CAIT, VSB-Technical University of Ostrava, CZ
ABSTRACT
The fracture mechanics behaviour of a subsurface flaw is known to be affected by the proximity of a component free surface. To account for this interaction, the subsurface flaw is transformed to a surface flaw in accordance with flaw-to-surface proximity rules of fitness-for-service (FFS) Codes. However, the specific criteria of re-characterization process from subsurface to surface flaw are different among the FFS Codes. The objective of this paper is to confront these criteria through X-FEM simulations of stress intensity factor and fatigue crack growth. The impacts of the subsurface flaw shape and ligament distance to free surface are assessed. Besides, the forced evolution from subsurface flaw to surface flaw is compared to a free evolution of the subsurface flaw.
1. INTRODUCTION
The structural integrity assessment of a flawed component requires above all an appropriate characterization of the flaw, as described in FFS codes. When subsurface flaws are detected close to the component free surface, flaw-to-surface proximity rules are used to determine whether it has to be considered as a subsurface flaw as is, or recharacterized as a surface flaw. In the flaw assessment procedure, this recharacterization is essential to predict reliable results applicable to fatigue crack growth calculation and fracture assessment. While the recharacterization concept is generic, the proximity rules involve criteria and parameters which differ among FFS codes, resulting in significant differences in the recharacterized surface flaw.
The differences between subsurface and surface flaws have been highlighted in terms of stress intensity factors (SIF) by Hasegawa et al. (2008). Differences between FFS codes can also be quantified from a fatigue crack growth point of view, in the framework of the determination of the remaining life of a component containing a subsurface flaw. For that purpose, cyclic tensile tests were conducted by Hasegawa et al. (2015) on carbon steel flat plate specimens with subsurface flaws located near the plate surfaces.
23rd Conference on Structural Mechanics in Reactor Technology Manchester, United Kingdom - August 10-14, 2015 Division II
2. FATIGUE ASSESSMENT OF PLATE WITH SUBSURFACE FLAW
Experiments
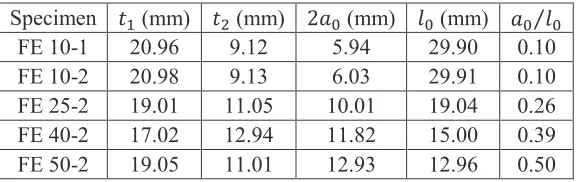
Fatigue crack growth tests have been conducted by using flat plate specimens with subsurface flaws (Hasegawa et al., 2015). For that purpose, two plate blocks including the same semi-elliptic surface flaw manufactured by EDM were joined by brazing. Figure 1 illustrates the specimen with the resulting elliptic subsurface flaw. The subsurface EDM notch is characterized by a total depth ʹܽ and a length ݈. The width of the EDM is about 0.3mm. The position of the centre of the subsurface notch in the plate thickness is given by ݐଵ and ݐଶ. Before penetrating the subsurface flaw, ܽଵ and ܽଶ are the measured depths. After penetration, the flaw becomes a surface flaw and the depth is given as ܽ. All these parameters are presented in Figure 1. The geometrical properties of the 5 considered specimens, covering aspect ratios between 0.1 and 0.5, are provided in Table 1.
This specimen is submitted to 3 Hz cyclic tensile test at ambient temperature. The maximum applied load
ܲ௫ is 320kN and the minimum applied load ܲ is 0kN1. The nominal applied tensile stress due to ܲ௫ is about 222MPa. This stress voluntary corresponds to low SIF in order to properly observe the flaw
evolution without failure of the remaining ligament to free surface.
Figure 1 : Experimental configuration and definition of subsurface flaw and surface flaw.
Table 1 : Notch geometries of considered specimens.
Specimen ݐଵ (mm) ݐଶ (mm) ʹܽ (mm) ݈ (mm) ܽΤ݈ FE 10-1 20.96 9.12 5.94 29.90 0.10 FE 10-2 20.98 9.13 6.03 29.91 0.10 FE 25-2 19.01 11.05 10.01 19.04 0.26 FE 40-2 17.02 12.94 11.82 15.00 0.39 FE 50-2 19.05 11.01 12.93 12.96 0.50
In order to observe the fatigue crack growth behaviour, beach marks were produced from time to time by changing the stress ratio. These beach marks are highlighted in Figure 2 for specimen FE 25-2. The final shape of the crack is clearly delimited by the brittle fracture area.
1
For the specific case of FE 25-2, the minimum load ܲ is 160kN for the first cycles until N=120,050 (N being the number of cycles) and 0kN for the rest of the test.
Braize joint
Braize joint
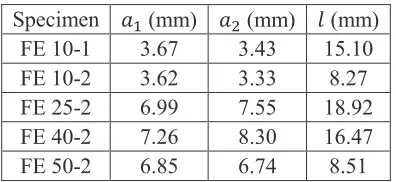
In some specimens, fatigue crack growth did not initiate at the entire front of the EDM notch front, as illustrated for FE 10-2 in Figure 2. Therefore, the geometrical properties of the first visually clear beach marks are provided in Table 2. This state is treated as corresponding to the initial state (ܰ ൌ Ͳ, ܰ being the number of cycles).
Table 2 : Initial state of crack propagation (ܰ ൌ Ͳ).
Specimen ܽଵ (mm) ܽଶ (mm) ݈ (mm) FE 10-1 3.67 3.43 15.10 FE 10-2 3.62 3.33 8.27 FE 25-2 6.99 7.55 18.92 FE 40-2 7.26 8.30 16.47 FE 50-2 6.85 6.74 8.51
As expected, fatigue crack growth amount in the thickness direction at the lower part of the specimen (ܽଶ) is greater than that at the upper part (ܽଵ) due to interaction with the plate free surface.
Figure 2 : Fracture surface of flat plate specimen FE25-2 and FE10-2.
Fatigue Crack Growth calculations with X-FEM
The results from the flat plate specimens described before are confronted to X-FEM calculations performed with Morfeo Crack software. The X-FEM is an extension of the conventional finite element method (Duflot et al., 2008). It allows for the introduction of some knowledge (called enrichment) of the solution into the approximation space. In linear fracture mechanics, the enrichments are the displacement jump across the crack surface, representing the crack opening, and functions spanning the leading term of the asymptotic expansion of the linear elastic solution in the vicinity of the front, accurately capturing the stress singularity. Therefore, the X-FEM permits the mesh not to match the crack faces thanks to the addition of a term to the discretization that represents the crack opening.
Morfeo Crack is a software product for the computation of the SIF along the front of three-dimensional cracks and the prediction of crack propagation under fatigue loading. Morfeo Crack implements the X-FEM for the modelling of cracks in a mesh-independent fashion. Moreover, thanks to the Level-set method (Duflot, 2007), it offers unique algorithms for modelling multiple 3D cracks with no limitation on the crack shape. These advantages give the ability to perform accurate computations with a reduced set up time, computation cost and user intervention compared to conventional finite element analysis with crack boxes.
Beach marks
FE10-2
FE25-2
Initial crack front
23rd Conference on Structural Mechanics in Reactor Technology Manchester, United Kingdom - August 10-14, 2015 Division II
In the framework of the present analysis, using X-FEM allows to better assess the actual behaviour of the crack:
· Account for the asymmetry of the initial flaw configuration. The flaw is not modelled with an elliptical shape, but with two semi-ellipses with the actual measured thicknesses ܽଵ and ܽଶ (Figure 3a).
Figure 3 : Crack models for X-FEM calculations.
· Account for the limited crack initiation on the EDM notch. When the initial observed flaw length ݈ is smaller than the EDM notch length ݈ (Figure 3b), the notch is explicitly modelled as a hole in the mesh and the crack geometry is accurately defined based on the measured dimensions.
· Calculate a free evolution of the crack shape. The initially defined flaw shape is free to evolve according to the value of the SIF calculated by X-FEM at each point of the crack front (Figure 4).
Figure 4 : Free crack growth according to SIF (MPaÖm) over the whole crack front (FE 25-2).
The fatigue crack growth calculations have been conducted using crack growth rates assessed on the specimens receiving brazing process (Hasegawa et al., 2015), and expressed with Paris law. See Equation 1 below:
ௗ
ௗே
ൌ ʹǤͳͲ ൈ ͳͲ
ିଵସοܭ
ସǤ଼ଷ (1)Where ݀ܽ ݀ܰΤ is the crack growth rate in m/cycle and οܭ is the stess intensity factor range in MPaÖm. The mesh of the X-FEM model is refined in the vicinity of the crack front to properly catch the crack growth, as depicted in Figure 5.
ܽ
ଵܽ
ଶ݈
݈
ʹܽ ܽଵ
ܽଶ
݈
(a) Specimens with ݈݈ (FE 25-2, 40-2)
Division II
Figure 5 : X-FEM model of specimen FE 25-2, mesh slice in the flaw plane.
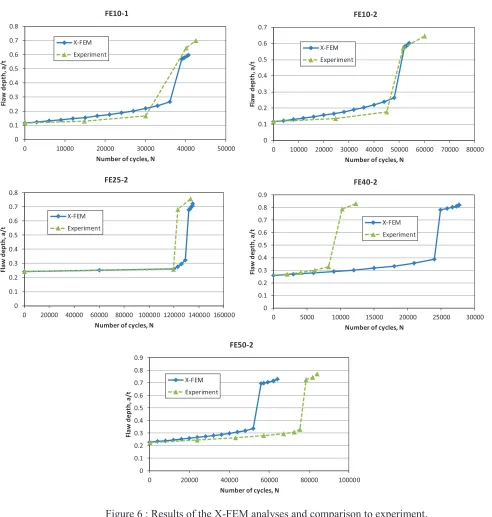
Results of the X-FEM calculations in terms of flaw depth ܽȀݐ as a function of the number of cycles ܰ for all specimens are provided in Figure 6. The step that can be observed in each graph corresponds to the transformation from subsurface flaw to surface flaw.
The two first specimens (i.e. FE 10-1 and 10-2) show a very good agreement between calculations and experiment. Although the calculations overestimate the subsurface crack growth rate, the moment at which the crack reaches the free surface is correctly caught by simulations. This is also the case for FE 25-2 specimen which also faithfully follows the experimental subsurface crack growth. While the calculation for FE 40-2 shows a clear overestimation of the number of cycles at crack penetration, the calculation for FE 50-2 is less than 30% below the experimental result in terms of number of cycles, which is within scatter of fatigue analyses. For these two latter specimens (FE 40-2 and 50-2) with high aspect ratios, the net-section areas at the cracked sections are small and crack growth during testing might be affected by specimen deformation.
Based on this discussion, it can be stated that fatigue crack growths are in fairly good agreement between experiments and X-FEM calculations. This confirms that Morfeo Crack is able to give a picture close to the reality.
3. COMPARISON OF FFS CODES
Proximity rules
As required in all FFS codes, subsurface flaws located near a component free surface (Figure 7a) are transformed to surface flaws (Figure 7b) according to proximity rules. The reason of this transformation resides in the high stress acting in the ligament ܵ which can potentially induce ligament failure. Therefore, to cover this phenomenon, the subsurface flaw is conservatively replaced by a surface flaw.
Flaw-to-surface proximity rules in FFS codes have been presented by Hasegawa et al. (2010). The proximity rules applicable to flaws with aspect ratio ܽȀ݈ ͲǤͷ considered in the present analysis are summarized in Table 3. The proximity rules are presented from the most stringent proximity condition (French RSE-M code, 2010) to the less severe one (Czech VERLIFE code, 2005). The ASME code section XI (2013), the JSME code S NA1 and Swedish SSM (2008) all have the same proximity condition. The WES 2085 (1997) of Japan Welding Engineering Society is intermediate between ASME code and VERLIFE code. As far as the subsurface flaw is concerned, while the transformed flaw depth
23rd Conference on Structural Mechanics in Reactor Technology Manchester, United Kingdom - August 10-14, 2015 Division II
Figure 6 : Results of the X-FEM analyses and comparison to experiment.
Figure 7 : Transformation from subsurface flaw to surface flaw.
0 0.1 0.2 0.3 0.4 0.5 0.6 0.7 0.8
0 10000 20000 30000 40000 50000
Fl a w d e p th , a /t
Number of cycles, N FE10-1 X-FEM Experiment 0 0.1 0.2 0.3 0.4 0.5 0.6 0.7
0 10000 20000 30000 40000 50000 60000 70000 80000
Fl a w d e p th , a /t
Number of cycles, N FE10-2 X-FEM Experiment 0 0.1 0.2 0.3 0.4 0.5 0.6 0.7 0.8
0 20000 40000 60000 80000 100000 120000 140000 160000
Fl a w d e p th , a /t
Number of cycles, N FE25-2 X-FEM Experiment 0 0.1 0.2 0.3 0.4 0.5 0.6 0.7 0.8 0.9
0 5000 10000 15000 20000 25000 30000
Fl a w d e p th , a /t
Number of cycles, N FE40-2 X-FEM Experiment 0 0.1 0.2 0.3 0.4 0.5 0.6 0.7 0.8 0.9
0 20000 40000 60000 80000 100000
Fl a w d ep th , a /t
Number of cycles, N FE50-2
X-FEM
Experiment
(a) Subsurface flaw near component surface
Proximity rule satisfied
Division II Table 3 : Flaw-to-surface proximity rules of FFS codes.
Codes and standards Condition Transformed flaw length
RSE-M
(Nuclear Components) ܵȀܽ ൏ ͳǤͲ
݈௦ൌ ൫݈ǡ ʹሺʹܽ ܵሻ൯ if ܽȀ݈ ൏ ͲǤͷ ݈௦ൌ ʹሺʹܽ ܵሻ if ܽȀ݈ ͲǤͷ
ASME, JSME, SSM
(Nuclear Components) ܵȀܽ ൏ ͲǤͶ
݈௦ൌ ݈ if ܽௌȀ݈ௌ ͲǤͷ ݈௦ൌ ʹሺʹܽ ܵሻ if ܽௌȀ݈ௌ ͲǤͷ
WES 2805
(Welded Joint Steels) ܵȀܽ ൏ ͲǤʹͷ
݈௦ൌ ݈ if ݈ ʹܽ ܵ ݈௦ൌ ʹܽ ܵ if ݈ ʹܽ ܵ VERLIFE
(Nuclear Components) ܵȀܽ ൏ ͲǤͳͳ ݈௦ൌ ݈
FCG calculations in thick wall component
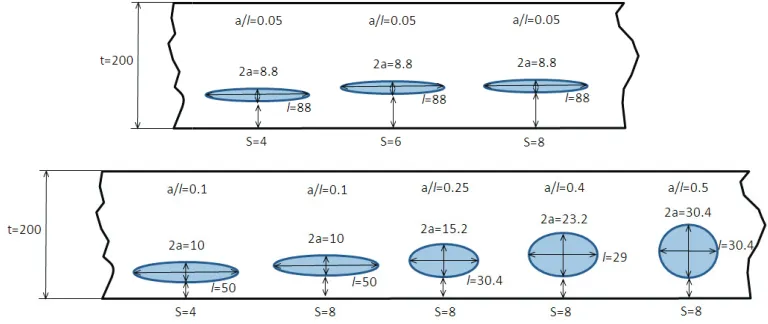
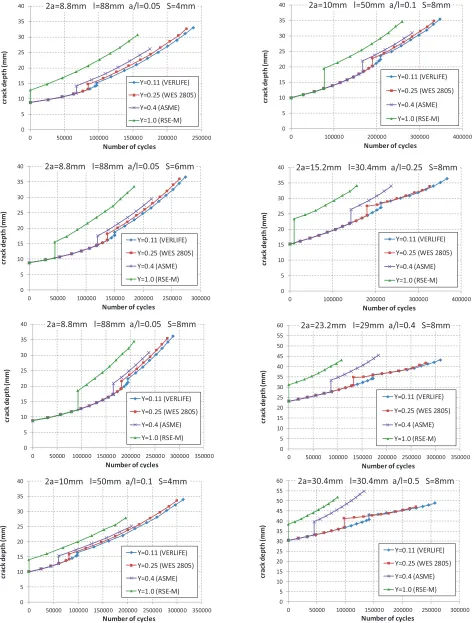
It was shown by Hasegawa et al. (2010) that the remaining lives for components containing subsurface flaws due to fatigue crack growth can be considerably different among FFS codes. While these calculations were performed on thin wall components, the objective of this section is to illustrate the differences between the proximity criteria in thick wall components. For that purpose, 8 subsurface flaw configurations in thick wall component have been considered (Figure 8). The initial flaw dimensions are around the dimensions given in the Table IWB-3510-1 (Allowable Planar Flaws in Ferritic steels) of ASME Code Section XI (2013) Acceptance Standards. It has to be noted that these configurations include cases with different aspect ratios ܽȀ݈ whith a fixed ligament ܵ. Besides, as FCG evolution is more sensitive to ligament ܵ for small aspect ratios, cases with different initial positions with respect to component surface have been considered for small aspect ratios (ܽȀ݈ ൌ ͲǤͲͷ and ͲǤͳ)
Fatigue crack growth calculations with X-FEM have been performed on each of these configurations, considering first subsurface flaw propagation. For each FFS code mentioned in Table 3, the subsurface flaw was transformed to the appropriate surface flaw once the condition of the proximity criteria was met.
Figure 8 : Definition of flaw configurations for comparison of proximity rules.
23rd Conference on Structural Mechanics in Reactor Technology Manchester, United Kingdom - August 10-14, 2015 Division II
Figure 9 : Comparison of proximity rules from FFS codes with X-FEM FCG analyses 0 5 10 15 20 25 30 35 40 45 50 55 60
0 50000 100000 150000 200000 250000 300000
cr a ck d e p th ( m m )
Number of cycles
2a=30.4mm l=30.4mm a/l=0.5 S=8mm
Y=0.11 (VERLIFE) Y=0.25 (WES 2805) Y=0.4 (ASME) Y=1.0 (RSE-M) 0 5 10 15 20 25 30 35 40
0 100000 200000 300000 400000
cr a ck d e p th ( m m )
Number of cycles 2a=10mm l=50mm a/l=0.1 S=8mm
Y=0.11 (VERLIFE) Y=0.25 (WES 2805) Y=0.4 (ASME) Y=1.0 (RSE-M) 0 5 10 15 20 25 30 35 40
0 100000 200000 300000 400000
cr a ck d e p th ( m m )
Number of cycles
2a=15.2mm l=30.4mm a/l=0.25 S=8mm
Y=0.11 (VERLIFE) Y=0.25 (WES 2805) Y=0.4 (ASME) Y=1.0 (RSE-M) 0 5 10 15 20 25 30 35 40 45 50 55 60
0 50000 100000 150000 200000 250000 300000 350000
cr a ck d e p th ( m m )
Number of cycles
2a=23.2mm l=29mm a/l=0.4 S=8mm
Y=0.11 (VERLIFE) Y=0.25 (WES 2805) Y=0.4 (ASME) Y=1.0 (RSE-M) 0 5 10 15 20 25 30 35 40
0 50000 100000 150000 200000 250000
cr a ck d e p th ( m m )
Number of cycles
2a=8.8mm l=88mm a/l=0.05 S=4mm
Y=0.11 (VERLIFE) Y=0.25 (WES 2805) Y=0.4 (ASME) Y=1.0 (RSE-M) 0 5 10 15 20 25 30 35 40
0 50000 100000 150000 200000 250000 300000
cr a ck d e p th ( m m )
Number of cycles
2a=8.8mm l=88mm a/l=0.05 S=6mm
Y=0.11 (VERLIFE) Y=0.25 (WES 2805) Y=0.4 (ASME) Y=1.0 (RSE-M) 0 5 10 15 20 25 30 35 40
0 50000 100000 150000 200000 250000 300000 350000
cr a ck d e p th ( m m )
Number of cycles
2a=8.8mm l=88mm a/l=0.05 S=8mm
Y=0.11 (VERLIFE) Y=0.25 (WES 2805) Y=0.4 (ASME) Y=1.0 (RSE-M) 0 5 10 15 20 25 30 35 40
0 50000 100000 150000 200000 250000 300000 350000
cr a ck d e p th ( m m )
Number of cycles 2a=10mm l=50mm a/l=0.1 S=4mm
Division II Several conclusions can be drawn from these calculations:
· The results of the fatigue crack growths can be considerably different among FFS codes. For
example, for the case with ܽ ݈Τ ൌ ͲǤͷ, the calculated number of cycles needed to reach a flaw depth of 45mm following RSE-M code (50,000 cycles) is 4 times lower than following WES 2805 and VERLIFE codes (200,000 cycles). This corresponds to substantial discrepancies in the assessment of remaining life of components.
· Despite the different transformed flaw length definitions among the FFS codes, the hierarchy
related to the severity of the proximity conditions from Table 3 is respected for all FCG configurations. Indeed, for a given crack depth, the RSE-M corresponds to the lowest number of cycles, and consequently the lowest remaining life of component. This tendency is however less pronounced between the WES 2805 and VERLIFE codes for the largest aspect ratios (ܽȀ݈
ͲǤʹͷ).
· For cases with small initial aspect ratios (ܽȀ݈ ͲǤͳ), the crack growth rate is similar for all
proximity rules because the definition of the transformed flaw length is similar (݈௦ൌ ݈). The only difference is the proximity conditions which lead to earlier or later transformations.
For cases with large initial aspect ratios (ܽȀ݈ ͲǤʹͷ), the crack growth rate of the surface flaw is higher for RSE-M and ASME proximity rules than for WES 2805 and VERLIFE proximity rules. This is because the definition of the transformed flaw length is different. Indeed, for a given crack depth, the aspect ratio of the surface flaw is higher for RSE-M and ASME, leading to larger SIF and crack growth rate.
· Although the WES 2805 and VERLIFE proximity rules include different proximity conditions
(ܵȀܽ ൏ ͲǤʹͷ vs. ܵȀܽ ൏ ͲǤͳͳ respectively), they finally lead to similar surface crack growth after transformation, for cases with large initial aspect ratios (ܽȀ݈ ͲǤʹͷ).
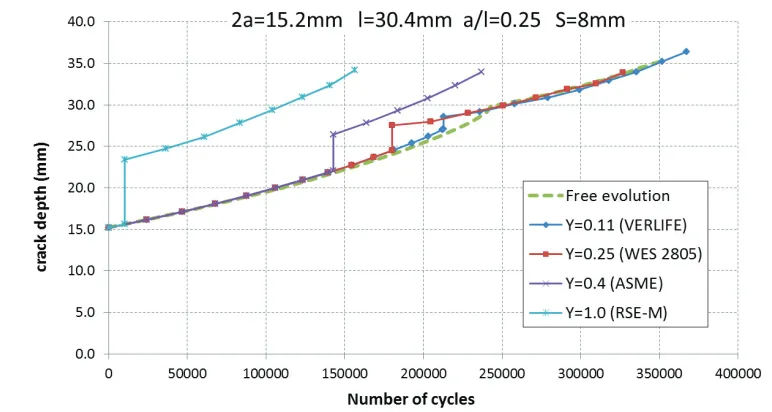
4. COMPARISON OF TRANSFORMATION WITH FREE EVOLUTION
Given the large discrepancies observed in the proximity rules comparison with respect to fatigue crack growth, one can wonder where the reality is compared to the FFS codes. As no experiments have been conducted on thick plates yet, reality is assumed to be properly modelled by X-FEM calculations with a free crack evolution (intersecting and penetrating the component free surface), as described in §1. In the framework of this paper, the comparison has been made on one case (with ܽȀ݈ ൌ ͲǤʹͷ). Results are given in Figure 10.
The transformation from subsurface to surface and the characterization of the transformed flaw RSE-M and ASME codes are clearly conservative in terms of FCG compared to the free crack evolution. On the other hand, the crack growth rate of the surface flaw defined in WES 2805 and VERLIFE codes are very similar to the free crack evolution. This conclusion has to be handled carefully as it is only applicable to one specific flaw configuration. A more exhaustive assessment is expected in a future work.
5. CONCLUSION
Fatigue crack growth calculations of the tested specimens have been performed through eXtended Finite Element Method (X-FEM) simulations. From the limited studied configurations, it can be concluded that:
· The calculations faithfully represent the actual evolution of the crack observed in experiments.
· There are significant discrepancies in the assessment of component remaining life between the FFS codes with respect to the definition of proximity rules.
· A free crack evolution (intersecting and penetrating the component free surface) can be used as a
23rd Conference on Structural Mechanics in Reactor Technology Manchester, United Kingdom - August 10-14, 2015 Division II
Figure 10 : Comparison of FFS codes with free crack evolution.
ACKNOWLEDGEMENT
The authors appreciate Koich Saito, Hitachi-GE, and Katsumasa Miyazaki, Hitachi, for their fruitful discussions and experiments.
REFERENCES
A16 (1995), Commission of Energy Atomic, “Guide for Defect Assessment and Leak Before Break Analysis”, Paris, France.
ASME Code Section XI (2013), “Rules for Inservice Inspection of Nuclear Power Plant Components”, ASME Boiler & Pressure Vessel Code, Section XI, Division 1, Edition 2013.
Dulfot, M., Wyart, E., Lani, F., Martiny, P. and Sagnier, S. (2008), “Application of XFEM to multi-site crack propagation”.
Duflot, M. (2007), “A study of the representation of cracks with level sets”, International Journal for Numerical Methods in Engineering, 70:1261—1302.
Hasegawa, K., Li, Y. and Saito, K. (2015). “Study on Flaw-to-Surface Proximity Rule for Transforming Subsurface Flaws to Surface Flaws Based on Fatigue Crack Growth Experiments”, Journal of Pressure Vessel Technology, AUGUST 2015, Vol. 137 / 041101.
Hasegawa, K. and Li, Y. (2010). “Assessment of Fatigue Ccrack Growths for Transformed Surface Flaws using FFS Codes”, ASME PVP Conference, Belle-vue, WA, July 18-22, ASME Paper No. PVP2010-25247.
Hasegawa, K. and Kikuchi, M. (2008), “Rules on Transforming Embedded Flaws to Surface Flaws”, ASME PVP Conference, Chicago IL, July 27-31, ASME Paper No. PVP2008-61007.
RSE-M (2010), AFCEN, French Association for Design, Construction and In-Service Inspection Rules for Nuclear Island Components, Paris, France.
SSM (2008), Swedish Radiation Safety Authority, “A Combined Deterministic and Probabilistic Procedure for Safety Assessment of Components With Cracks – Handbook”, Stockholm, Sweden. VERLIFE (2005), Association of Mechanical Engineers, Section VI, “Calculation of Residual Life of
Equipment and Piping in Nuclear Power Plants”, Prague, Czech Republic.