$%675$&7
6&2**,16ñý+2//<ý/<11(ïýý'HYHORSPHQWýRIýWKHý3UHVVý([WUDFWLRQý0HWKRGýIRUý3OXJ 6XEVWUDWHý$QDO\VLVïýýõ8QGHUýWKHýGLUHFWLRQýRIý'RXJODVý$ïý%DLOH\ýDQGý3DXOý9ïý1HOVRQïô
7KHýJRDOýRIýWKLVýUHVHDUFKýZDVýWRýGHYHORSýDQGýDVVHVVýWKHýHIIHFWLYHQHVVýRIýWKHýSUHVV H[WUDFWLRQýPHWKRGýõ3(0ôýIRUýQXWULWLRQDOýDQDO\VLVýRIýEHGGLQJýSODQWýSOXJýVXEVWUDWHVïý
Conventional testing methods for soilless substrates are either unsuited for plug
production orýLQWHUSUHWLYHýVWDQGDUGVýKDYHýQRWýEHHQýSXEOLVKHGýIRUýS+ñýVROXEOHýVDOWVñýRU
VSHFLILFýQXWULHQWV.ý:LWKýWKHý3(0ñýWKHýURRWLQJýVXEVWUDWHýLVýLUULJDWHGýWRýFRQWDLQHUýFDSDFLW\
DQGýDIWHUýDýSHULRGýRIýRQHýKRXUýWKHýSOXJýVXUIDFHýLVýSUHVVHGýZLWKýDýILQJHUýRUýWKXPEýWRýH[SHO WKHýVROXWLRQïýý7KHýILUVWýVHULHVýRIýH[SHULPHQWVýH[DPLQHGýSRWHQWLDOýYDULDWLRQýLQýS+ñýHOHFWULFDO FRQGXFWLYLW\ýõ(&ôñýDQGýH[WUDFWDEOHýQXWULHQWVý(NO3-N, NH4+-N, P, K, Ca, Mg, Na, B, Cu,
Fe, Mn, and Zn)ýDVVRFLDWHGýZLWKýGLIIHULQJýH[WUDFWLRQýIRUFHVïýý$ýSUHVVýPRGLILHGýIURPýD
IUXLWýSHQHWURPHWHUýZDVýGHVLJQHGýWRýDSSO\ýDýUDQJHýRIýIRUFHýõVLPLODUýWRýZKDWýFRXOGýEH H[HUWHGýPDQXDOO\ôýto a 35 g sample of soilless substrate. Testing done on a peat-based
substrate fertilized with a single fertilizer rate (20N-4.3P-16.6K at 75 mg.L-1 N) and then
fertilized with a range of rates (75, 125, and 175 mg.L-1 N). A coir-based substrate was
also tested at one rate (125 ppm mg.L-1 N). For all experiments, the range of extraction forces within a fertilizer rate did not affect chemical properties. When testing included a
range of fertilizer rates, the method’s ability to detect changes in pH and EC was
demonstrated.
The second study compared the PEM to the saturated media extract (SME) and
the 2:1 water : substrate (v/v) suspension method (2:1). The extraction methods were used
150, and 200 mg.L-1 N. Sample sizes of 20 and 60 plugs were used to determine if similar results could be obtained with the smaller, less destructive sample size.. Values
for pH were similar among the three methods. The PEM method resulted in the highest
EC, NH4+-N, NO3--N, K, Ca, and Mg. Testing 20 plugs was sufficient since sample size accounted for little variation in the results. In a second experiment comparing peat- and
coir-based substrates, the coir extract pH averaged 1.5 units higher with much higher
levels of K and Na regardless of extraction method when compared to the peat. Solution
from the peat substrate was higher in NH4+-N, NO3--N, P, Ca, and Mg. Within each substrate, pH, EC, and nutrients tested were similar between the PEM and SME. The
similarity between the PEM and SME nutrient analysis in the second experiment
suggested existing SME interpretation standards may be used for the PEM but further
investigation was needed.
The third study was designed to provide the necessary correlations between the
methods to allow for development of pH, EC, and nutrient interpretive ranges for actively
growing plugs. First, a wide range of bedding plant plugs grown at various commercial
greenhouses were collected and the substrate solution extracted with the PEM, SME, and
2:1 methods. This quickly and inexpensively provided the varied population necessary to
establish relative comparisons and correlations between the methods when performed on
actively growing plugs. A second experiment provided comparisons of the three
extraction methods performed on plugs grown at low, medium, and high fertility rates
with a variety of bedding plant species; celosia (Celosia argentea L. var. cristata (L.)
Kuntze Plumosa Group), impatiens (Impatiens wallerana Hook. f.), marigold (Tagetes
Sellow ex Roem.& Schult.) Thirty days after planting (DAP), shoots were harvested and
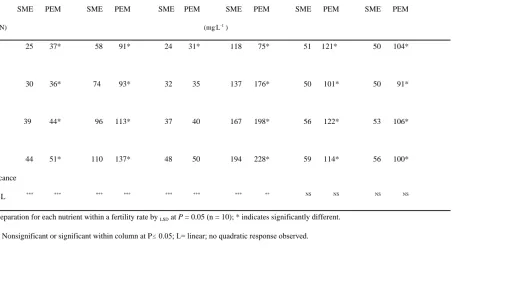
the solution extraction methods were performed on each flat. For both experiments, the
PEM EC was consistently higher and the pH equal to or lower than the SME. The pH
with the 2:1 method was similar to that for the PEM, however EC was consistently low
ith this method due to the dilution effect. Solution NO3--N, P, and K were well-correlated between the PEM and SME. However, between the two experiments, there were
anomalous results for most nutrients extracted by the PEM and SME methods. As found
in previous studies, Ca and Mg levels were consistently higher in the PEM extracted
solution.
The pH and EC relationships between the three extraction methods remained
consistent throughout the study. As a result, quantitative interpretation ranges for these
two analyses were calculated between the PEM and SME. Plug growers can now use the
PEM for on-site pH and EC testing and compare their results with the previously
'
(9(/230(17ý2)ý7+(ý
3
5(66ý
(
;75$&7,21ý
0
(7+2'ý
)25ý
3
/8*ýý
6
8%675$7(ý
$
1$/<6,6
E\
+ROO\ý/ïý6FRJJLQV
$ýGLVVHUWDWLRQýVXEPLWWHGýWRýWKHý*UDGXDWHý)DFXOW\ýRI
1RUWKý&DUROLQDý6WDWHý8QLYHUVLW\ý
LQýSDUWLDOýIXOILOOPHQWýRI
WKHýUHTXLUHPHQWVýIRUýWKHý'HJUHHýRI
'RFWRUýRIý3KLORVRSK\
+RUWLFXOWXUDOý6FLHQFH
5DOHLJK
ìäää
$SSURYHGýE\ã
BBBBBBBBBBBBBBBBBBBBBBBBBBBBB ýýýýýýýýýýýBBBBBBBBBBBBBBBBBBBBBBBBBBBBB
7HGý(ïý%LOGHUEDFNñý3Kï' *RUGRQý6ïý0LQHUñý3Kï'
BBBBBBBBBBBBBBBBBBBBBBBBBBBBBýýýýýýýýýýýýBBBBBBBBBBBBBBBBBBBBBBBBBBBBBB
ýýýýýýýý
'
(',&$7,217KLVýGLVVHUWDWLRQýLVýGHGLFDWHGýWRýP\ýSDUHQWVñý-RKQýDQGý(YHO\Qý6FRJJLQVïý
%
,2*5$3+<+ROO\ý/\QQHý6FRJJLQVýZDVýERUQýLQý2PDKDñý1HEUDVNDýLQýìäçëïýý+HUýQRPDGLF OLIHVW\OHýDVýDý8ï6ïý$UP\ýGHSHQGHQWýFRQWLQXHGýXQWLOýìäæèñýZKHQý/Wïý&ROïý-RKQý6FRJJLQV VHWWOHGýGRZQýWRýWKHýOLIHýRIýWKHýJHQWOHPDQýIDUPHUýLQýWKHýIRRWKLOOVýRIýQRUWKHDVWý*HRUJLDïý +ROO\©VýPRVWýLPSUHVVLRQDEOHý\HDUVýZHUHýVSHQWýLQý$WKHQVñý*HRUJLDïýý+ROO\ýIRUJHGýLQWR KLJKHUýHGXFDWLRQýDWýWKHýORFDOý8QLYHUVLW\ïýý,QýìäåéñýGHVSLWHýDýWKULYLQJýORFDOýPXVLFýVFHQHñ VKHýHDUQHGýDý%ï6ïýLQý$JULFXOWXUDOý(FRQRPLFVïý3LQLQJýWRýEHýDýFRPPRGLWLHVýWUDGHUñýKHU GUHDPVýZHUHýVKDWWHUHGýZKHQýVKHýUHDOL]HGýKRZýIUHH]LQJýFROGý&KLFDJRýZRXOGýEHïýý+ROO\ WXUQHGýWRýDFWXDOýSD\LQJýMREVýLQýZDUPHUýFOLPHVñýVXFKýDVý'HVWLQñý)ORULGDïýý5HWXUQLQJýWR $WKHQVýLQýWKHýPLGðäíöVñýVKHýZHQWýEDFNýWRýWKHý8QLYHUVLW\ýRIý*HRUJLDýWRýVHHNýNQRZOHGJHýRI WKHýKRUWLFXOWXUDOýNLQGïýý$IWHUýWZRý\HDUVýRIýXQGHUJUDGXDWHýOHYHOýFODVVHVñýKHUýLQQHUýJDUGHQHU ZDVýUHYHDOHGýDQGýLQVLVWHGýRQýPRUHýHGXFDWLRQïýý+ROO\ýIRFXVHGýRQýWKHýILHOGýRIýSODQW
QXWULWLRQýLQýIORULFXOWXUHñýDQGýZDVýUHZDUGHGýZLWKýDý0ï6ïýLQý+RUWLFXOWXUHýLQýìääèïýý6KHýZDV DWýWKLVýSRLQWýDGYLVHGýWRý¦JRýVRPHZKHUHýWKHýKHFNýHOVH§ýIRUýKHUýGRFWRUDOýGHJUHHïýý7KH FKRLFHVýZHUHýQDUURZHGýWRýWZRýSUHPLHUýIORULFXOWXUHýSURJUDPVñý1ï&ïý6WDWHýDQGý0LFKLJDQ 6WDWHïý&KRRVLQJý1ï&ïý6WDWHýõDJDLQñýWKHýFROGýZHDWKHUýWKLQJôýZDVýDýIRUWXQDWHýGHFLVLRQñýDVýVKH KDVýKDGýWKHýRSSRUWXQLW\ýWRýZRUNýZLWKýZRQGHUIXOýIDFXOW\ýZKRýZHUHýVXSSRUWLYHýDQG
ý
ý$
&.12:/('*0(176,QýP\ýVHHPLQJO\ýEULHIýWLPHýLQý5DOHLJKñý'Uïý'RXJODVý$ïý%DLOH\ýKDVýEHHQýDýJUHDW DGYLVRUñýSURIHVVLRQDOýLQIOXHQFHñýDQGýIULHQGïýý,ýRZHýKLPýDQGýWKHýORYHO\ý3HJJ\ý%DLOH\
FRXQWOHVVýPHDOVïýý'Uïý3DXOý1HOVRQýKDVýEHHQýNLQGýDQGýSDWLHQWñýZLOOLQJýWRýZLHOGýKLVýH[SHUWLVH DVýUHTXLUHGïý'Uïý7HGý%LOGHUEDFNýDQGý'Uïý*RUGRQý0LQHUýKDYHýSURYLGHGýQHHGHG
HQFRXUDJHPHQWýDQGýVDJHýDGYLFHïýý)ORULFXOWXUHýWHFKQLFLDQý,QJUDPý0F&DOOýLVýWKHý60( 4XHHQï
-RHOý6KXPDQýKDVýEHHQýDVýVXSSRUWLYHýDýIULHQGýDQGýFRPSDQLRQýDVýKXPDQO\ýSRVVLEOHïý +HýDQGý6RSKLHñýP\ý6RIDý'RJñýKDYHýSURYHGýWKHPVHOYHVýH[FHOOHQWýSDUWQHUVýZKRý,ýKRSH FRQWLQXHýZLWKýPHýLQýP\ýMRXUQH\ýWKURXJKýOLIHïýý
,ýDOVRýZRXOGýOLNHýWRýWKDQNýWKRVHýZKRýILUVWýWDXJKWýDQGýLQVSLUHGýPHýLQýWKHýILHOGýRI +RUWLFXOWXUHïýý'Uïý$OODQý$UPLWDJH©VýDQGý'Uïý0LFKDHOý'LUU©VýHQWKXVLDVPýIRUýWKHýJUHDWýZLGH ZRUOGýRIýSODQWVýZDVýWUXO\ýFRQWDJLRXVïýýý,ýDPýVWLOOýJUHDWO\ýLQIOXHQFHGýE\ýZKDWý,ýOHDUQHGýDQG FRQWLQXHýWRýOHDUQýIURPýWKHVHýJUHDWýSODQWVPHQï
7
$%/(ý2)ý&
217(176/LVWýRIý7DEOHVý
ïïïïïïïïïïïïïïïïïïïïïïïïïïïïïïïïïïïïïïïïïïïïïïïïïïïïïïïïïïïïïïïïïïïïïïïïïïïïïïïïïïïïïïïïïïïýYLL
/LVWýRIý)LJXUHVý
ïïïïïïïïïïïïïïïïïïïïïïïïïïïïïïïïïïïïïïïïïïïïïïïïïïïïïïïïïïïïïïïïïïïïïïïïïïïïïïïïïïïïïïïïïýýL[
&KDSWHUý2QHãý,QWURGXFWLRQý
ïïïïïïïïïïïïïïïïïïïïïïïïïïïïïïïïïïïïïïïïïïïïïïïïïïïïïïïïïïïïïïïïïïïïïïýýì
/LWHUDWXUHý&LWHG
ý
ïïïïïïïïïïïïïïïïïïïïïïïïïïïïïïïïïïïïïïïïïïïïïïïïïïïïïïïïïïïïï
ïïïïïïïïïïïïïýýìè&KDSWHUý7ZRã
ýý(IIHFWVýRIý9DULDEOHý([WUDFWLRQý)RUFHýRQýS+ñý(&ñýDQGý1XWULHQWý$QDO\VLV
ý
ïïïïïïïïïïïïïïïïïïïïïïïïïïïïïïïïïïïïïïïïïïïïïïïïïïïïïïïïïïïïï
ïïïïïïïïýýýìä$EVWUDFWý
ïïïïïïïïïïïïïïïïïïïïïïïïïïïïïïïïïïïïïïïïïïïïïïïïïïïïïïïïïïïïï
ïïïïïïïïïïïïïïïïïïïïïïïýýýìä ,QWURGXFWLRQýïïïïïïïïïïïïïïïïïïïïïïïïïïïïïïïïïïïïïïïïïïïïïïïïïïïïïïïïïïïïï
ïïïïïïïïïïïïïïïïïýýýëíýý 0DWHULDOVýDQGý0HWKRGVý
ïïïïïïïïïïïïïïïïïïïïïïïïïïïïïïïïïïïïïïïïïïïïïïïïïïïïïïïïïïïïï
ïýýýëì 5HVXOWVýDQGý'LVFXVVLRQýýïïïïïïïïïïïïïïïïïïïïïïïïïïïïïïïïïïïïïïïïïïïïïïïïïïïïïïïïïïïïï
ýýýëé /LWHUDWXUHý&LWHGýýïïïïïïïïïïïïïïïïïïïïïïïïïïïïïïïïïïïïïïïïïïïïïïïïïïïïïïïïïïïïï
ïïïïïïïïïïïýýýëæ&KDSWHUý7KUHHãý,QYHVWLJDWLRQýRIýWKHý4XDQWLWDWLYHý5HODWLRQVKLSVý
EHWZHHQý6ROXWLRQý([WUDFWLRQý7HFKQLTXHVýïïïïïïïïïïïïïïïïïïïïïïïïïïïïïïïïïïïïïïïïïïýýýêì
&KDSWHUý)RXUãý$VVHVVLQJýWKHý(IILFDF\ýRIýWKHý3UHVVý([WUDFWLRQý0HWKRG
ýIRUý%HGGLQJý3ODQWý3OXJVýïïïïïïïïïïïïïïïïïïïïïïïïïïïïïïïïïïïïïïïïïïïïïïïïïïïïïïïïïïïïïïïïïïïïïïïïýýýèé
$EVWUDFWý
ïïïïïïïïïïïïïïïïïïïïïïïïïïïïïïïïïïïïïïïïïïïïïïïïïïïïïïïïïïïïï
ïïïïïïïïïïïïïïïïïïïïïïïýýýýýèé ,QWURGXFWLRQýïïïïïïïïïïïïïïïïïïïïïïïïïïïïïïïïïïïïïïïïïïïïïïïïïïïïïïïïïïïïï
ïïïïïïïïïïïïïïïïïýýýýèè 0DWHULDOVýDQGý0HWKRGVýïïïïïïïïïïïïïïïïïïïïïïïïïïïïïïïïïïïïïïïïïïïïïïïïïïïïïïïïïïïïï
ïýýýèå 5HVXOWVýDQGý'LVFXVVLRQýýïïïïïïïïïïïïïïïïïïïïïïïïïïïïïïïïïïïïïïïïïïïïïïïïïïïïïïïïïïïïï
ýýýçë /LWHUDWXUHý&LWHGýý
ïïïïïïïïïïïïïïïïïïïïïïïïïïïïïïïïïïïïïïïïïïïïïïïïïïïïïïïïïïïïï
ïïïïïïïïïïïýýýýçç/
,67ý2)ý7
$%/(67DEOHýëïìýýEffect of rate of fertilizer application on pH and electrical conductivity of extracted solution. Extraction force treatments were not significant (data pooled within
fertilizer rates) (expt.2)ïïïïïïïïïïïïïïïïïïïïïïïïïïïïïïïïïïïïïïïïïïïïïïïïïïïýïïïïïïïïïïïïïïïïïïïïïïïïïïïïïïïïïïïïïïïïïïïïïïýëä
Table 2.2 Comparison of chemical properties of peat-based and coir-based substrates
subjected to same fertilizer. Force treatments were not significant, data are pooled means
(expt. 3 & 4)... 30
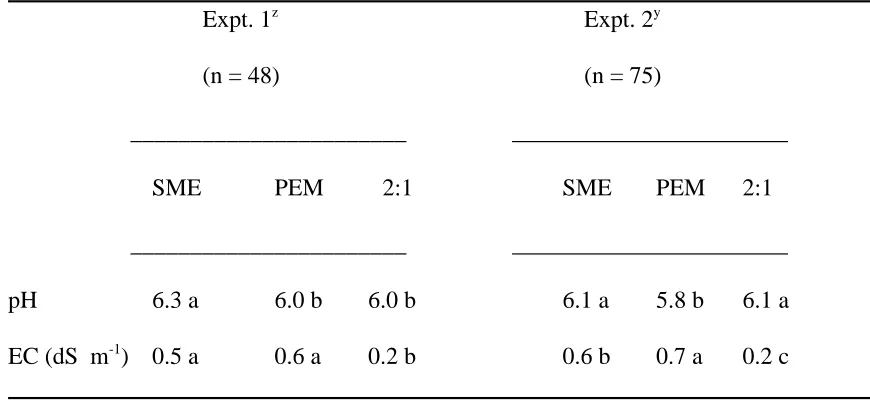
7DEOHýêïìýý$QDO\VLVýRIýYDULDQFHýIRUýFRPSDULVRQýRIýS+ýDQGý(&ýDPRQJý
3(0ñý60(ñýDQGýëãìýõH[SWïýìôýï...ïïïïïïïïïïïïïïïïïïïïïïïïïïïïïïïïïïïïïïïïýéè
7DEOHýêïëýý&RPSDULVRQýRIýH[WUDFWLRQýPHWKRGVýIRU
S+ýDQGý(&ýõH[SWïýëôý...ïïïïïïïïïýéç
7DEOHýêïêýý$QDO\VLVýRIýYDULDQFHýRIýPDFURQXWULHQWVýIRUýFRPSDULVRQý
EHWZHHQýWKHý3(0ýDQGý60(ýõH[SWïýìôýï...ïïïïïïïïïïïïïïïïïïïïïïïïïïïïýéæ
7DEOHýêïéýý&RPSDULVRQVýEHWZHHQýWKHý3(0ýDQGý60(ý
IRUýPDFURQXWULHQWýOHYHOVýõPJ /ðìôýõH[SWïýìôýïïïïïïïïïïïïïïïïïïïïïïïïïïïïïïïïïïïïïïïïïïïïïïïïïïïïïïïïïïïïïïïïïïïïýéå
7DEOHýêïèýý$QDO\VLVýRIýYDULDQFHýIRUýFRPSDULVRQýRIýS+ýDQGý(&ý
DPRQJýPHWKRGVýõH[SWïýëôý...ïïýéä
7DEOHýêïçýý$QDO\VLVýRIýYDULDQFHýIRUýPDFWURQXWULHQWVýLQý
SHDWýYVïýFRLUýVXEVWUDWHýõH[SWïýëôýïïïïïïïïïïïïïïïïïïïïïïïïïïïïïïïïïïïïïïïïïïïïïïïïïïïïïïïïïïïïïïïïïïïïïïïïïïïïïïïïïïïïïýèí
7DEOHýêïæýý0DFURQXWULHQWýOHYHOVýE\ýVXEVWUDWHý
7DEOHýéïìý Table 1. Comparison among methods for pH and EC:
means include all species ...ýçä
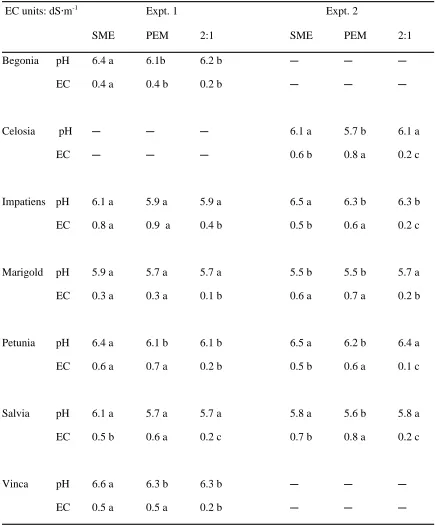
Table 4.2 Comparison among methods for pH and EC by species
(includes all rates) ...ïïïïïïïïïïïïïïïïïïïïïïïïïïïïïïïïïïïïïïïïïýæí
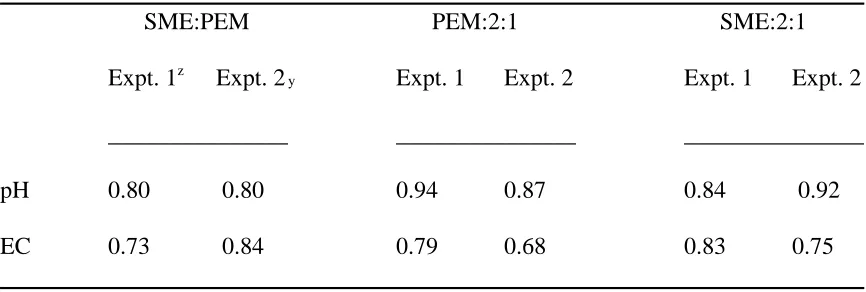
7DEOHýéïêýý&RUUHODWLRQýFRHIILFLHQWVãýLQFOXGHVýDOOýVSSïýõH[SWïýìôý
DQGýDOOýVSSïýDQGýUDWHVõH[SWïëôýïïïïïïïïïïïïïïïïïïïïïïïïïïïïïïïïïïïïïïïïïïïïïïïïïïïïïïïïïïïïïïïïïïïïïïïïïïïïïïïïïïïïïïïïýæì
Table 4.4 Comparison of nutrients extracted with the SME
and PEM: includes all spp. and rates ... 72
Table 4.5 Interpretive scale for pH and EC by testing method;
(PEM values from expt. 2 predictive equations) ...ýæê
7DEOHý$SSHQGL[ïìýý$QDO\VLVýRIýYDULDQFHýIRUýFRPSDULVRQýDPRQJý
3(0ñý60(ýDQGýëãìýPHWKRGVïýõFKDSWHUýéñýH[SWïýëôýïïïïïïïïïïïïïïïïïïïïïïïïïïïïïïïïïïïïïïïïïïïïïïïïïïïïïïïïïïææ
Table Appendix.2 Analysis of variance for comparison of macronutrients
between PEM and SME (chapter 4, expt. 2) ... 78
Table Appendix.3 Analysis of variance for comparison of micronutrients
/
,67ý2)ý)
,*85(6)LJXUHýêïìý([WUDFWLRQýPHWKRGVýFRPSDUHGýRYHUý1ðUDWHVýõPJ /ðìô
IRUýERWKýVXEVWUDWHVýõH[SWïýëôýï... 52
)LJXUHýêïëý5HODWLRQVKLSýEHWZHHQýWKHý3(0ýõ;ôýDQGý60(ýõ<ôý
IRUýERWKýVXEVWUDWHVýõH[SWïýëôýï... 53
Figure 4.1 Relationship between SME and PEM
pH and EC (expt. 2) ... 74
)LJXUHýéïëý5HODWLRQVKLSýEHWZHHQýH[WUDFWHGýVROXWLRQýOHYHOVýRIý
ì
C
HAPTERO
NE:
I
NTRODUCTION"The prime objective in testing a growth medium, whether soil or soilless, is to characterize the nutrient environment as closely as possible to the way the plant root system experiences it." (Warncke, 1990).
Greenhouse crops are grown using intense cultural regimes with frequent
fertilization and watering. Substrate testing for physical and chemical properties is
invaluable for predictive analyses % the most valuable tool the grower has when designing a fertilizer program. Diagnostic analyses also are necessary when problems occur during
the growing cycle. Seedling or vegetative plug production presents additional challenges
to the grower. Of primary concern is the small volume of the substrate in the container in
which the pH can fluctuate, there is a low buffering capacity, nutrients can leach out
quickly, or soluble salts can build up rapidly (Bailey et al; 1995; Fonteno, 1996),
Though the time in the plug stage (sowing to transplanting) for many annual bedding
plants ranges from 6-10 weeks, that for perennial crop plugs averages 8-12 weeks, more
if plugs are pre-cooled (vernalized) by the grower (Styer and Koranski, 1997). Thus,
more time spent in a plug flat cell increases the probability for salt buildup or nutritional
problems to occur.
The three ways to detect nutritional problems in a growing crop are 1) visually;
2) foliar or tissue analysis; and 3) substrate testing (Nelson, 1991). Imparting a visual
ë
short production cycle. Foliar analysis standards are available for most bedding plants
(Mills and Jones, 1996) but not specifically for plug crops. This leaves the plug grower
with nutritional monitoring through substrate analysis. Regardless of the crop grown,
testing the levels of essential and non-essential nutrients, substrate pH, and electrical
conductivity (EC) (soluble salts) provides the grower with important knowledge of
nutrient status below the substrate surface % in the root zone of the crop. There are many variables that can confound the results. Consistency in testing methods, sampling
techniques, and timing after fertilizer application are all crucial to producing reliable
results (Compton and Nelson, 1997). Testing procedures have changed over the years as
growers have moved away from soil-based mixes to completely soilless growth media.
The Evolution of Testing Procedures
Soil testing began as a logical extension of the emerging field of soil chemistry.
By the 1940's, soil testing was a legitimate tool for the development of agronomic liming
and fertilizer programs. (Peck and Soltanpour, 1990). Soil scientists such as Bray,
Morgan and Spurway looked to the soil solution and exchangeable nutrient pool to
provide nutrient availability information instead of the total mineral content of a field
soil. Soil testing has moved from the realm of solely determining nutrient deficiencies.
The maintenance of adequate nutrient supply and the limiting of financial and
environmental costs associated with over-fertilization are also factors to consider.
The horticulture industry also benefitted from soil testing for both field and
ê
media evolved from straight field soils to soil-based substrate amended with organic or
manufactured components, and finally to the soilless substrate used today (Warncke,
1986). The concurrent change in substrate physical and chemical properties necessitated
a change in testing methodology.
Soil-based substrates are still used in the greenhouse industry, particularly for
raised-bed production of cut flowers. The chemical extraction tests remain useful for
testing these substrates for exchange capacities and nutrient levels. Though testing
soil-based substrate is moving toward standardization among laboratories, the fact remains
that no single soil test is appropriate for all soils. The tremendous variation in procedures
renders results that can confuse both growers and grower advisers (Peck and Soltanpour,
1990). Interpretation and recommendation protocol can be even more variable.
Spaghnum peat moss, perlite, pine bark and vermiculite are the standard
components in today’s soilless mix (Fonteno, 1996). Combinations of two or more of
these components, at varying ratios, comprise the substrate. The nutrient holding and
exchange capacity is relative small when compared to that of mineral soils (Warncke,
1986). Testing methods previously used for mineral soils that hold elements tightly were
not necessary or appropriate for these substrates (Bunt, 1986). However, soilless media is
not an inert substrate. Peat, vermiculite, and pine bark all have a good cation exchange
é
Interpretation of test results
Field or agronomic soil testing has traditionally relied on two criteria that are key
to interpretation: first, the correlation between the amount of a nutrient extracted and the
amount taken up by the plant and secondly, a calibration curve relating the amount of the
nutrient extracted to some kind of marketable yield (Corey, 1987). This information
assists growers in predicting the total need or uptake of nutrients by a specific crop
(usually annual - the life cycle is completed in one growing season). This system is
difficult to implement in a horticultural situation. There is insufficient data regarding
nutrient extraction vs. uptake for the seemingly endless variety of greenhouse and nursery
crops. "Yield" of ornamental crops is often difficult to quantify. Therefore, nutrient
management of greenhouse crops has been limited to general guidelines. These
parameters indicate analytical ranges and sufficiency levels for essential nutrients and
other properties such as pH and soluble salts. An additional complication is that these
analytical guidelines are specific to the nutrient extraction method used.
The use of chemical reagents for nutrient extraction
Nutrient extraction employs a chemical reagent solution (or water) to separate all
or a fraction of nutrients available to plants growing in the substrate (Peck and
Soltanpour, 1990). Chemical reagent solutions contain acids, neutral salts, or a
combination of the two (Tan, 1996). Extractants displace ions from colloidal exchange
sites (K, Ca, and Mg); complex nutrients in a process similar to natural chelation (Fe, Mn,
è
comparable to those available to a plant in situ depends on several mechanisms:
cation/anion exchange complexes, degree of solubility/insolubility, ionic chelation,
biological tie-up through uptake and mineralization, or salt interactions and adsorption
(Peck and Soltanpour, 1990)
There are several specific extractants cited for each and every macro- and
micronutrient, but it is beyond the scope of this paper to describe each one. However,
universal extraction reagents that extract most of the essential nutrients with variable
results (Tan, 1996) will be discussed.
Mehlich. Three acid extraction methods for soil-based substrates were developed
by Dr. Adolph Mehlich of the North Carolina Department of Agriculture. The Mehlich-1
(0.05N HCl and 0.025N H2SO4) is widely used throughout the southeastern U.S. and Latin America. The Mehlich-3, a modification of the Mehlich-2, has been used world-wide on
a variety of soils since the mid-1980's (Tucker et al., 1996). A combination of several
reagents, the Mehlich-3 is considered the most universally applicable.
Spurway. The Spurway weak acid extraction method (0.018 N HOAc, pH of 3.3) has been used on both soil-based and soilless substrates since the 1940's (Markus, 1986).
Nutrients assayed are P, K, Ca, Mg, and NO3-N. The micronutrients Cu, Mn, Fe, and Zn can also be measured with the addition of DTPA to the extractant. Warncke (1990) used
the Spurway procedure as the standard against which to compare the saturated medium
ç
Other. Many other extractants can be used to assess levels of nutrients in
soil-based and soilless substrates. A few of these include "neutral" ammonium acetate (P,K,
Ca, Mg, NO3-N, and Na); the Bray P1 - ammonium fluoride with HCl (P, K, Ca, Mg, NO3 -N), sodium chloride (P, K, Ca, Mg, NO3-N and NH4-N); and boric acid (P, K, NO3-N and NH4-N) (Markus, 1986). Other tests on soil-based media include ion exchange capacity tests (to identify the substrates ability to store nutrients on the particles) and buffer pH to
determine lime requirements (Van Lierop, 1990).
The pH of a soil-based substrate provides information on acidity or alkalinity but
not on lime requirement of the substrate. This is determined by the addition of a buffer
reagent (there are several - the SMP buffer, Adams-Evans buffer, and the Mehlich buffer)
and measurement of the buffer pH drop (van Lierop, 1990). The buffer method is not
necessary for determining the lime requirement of soilless media.
The shift to water extraction for soilless substrates
Most greenhouse and container nursery potting mixes are soilless, comprised
instead of organic and inert components such as pine bark, peat, sand, vermiculite and
perlite. When compared to testing soil-based substrate, the importance has shifted in the
testing of soilless substrate from the extracting solution to the extraction method. The
argument is whether plants grown in soilless substrate are limited to the nutrients
available in the directly soluble form or can also utilize indigenous or acid-extractable
æ
Distilled water as the extracting removes the soluble fraction vs. an exchange
solution such as NH4OAc which removes both the soluble and exchangeable fraction of cations (Warncke, 1990). Most greenhouse growing conditions - with frequent watering
and fertilizing - renders the exchangeable fraction of the nutrient supply less important,
eliminating the relevance of acid or some other chemical extractant. When correlating
acid vs. water extraction procedures on soilless substrate, the most significant differences
(lowest r-values) are encountered with the divalent cations such as Ca and Mg (Markus,
1986). However, water-extractable nutrient levels have been shown to stay in proportion
with exchangeable solutions levels (Warncke, 1986).
Another point of discussion is whether the substrate sample should be air-dried
prior to extraction or left moist. Moist samples better reflect the substrate-nutrient
environment the root encounters, plus the drying process takes extra time and labor
(Markus, 1986). The concentration of nutrients in the root zone is inversely correlated to
the moisture content of the media (Warncke and Krauskopf, 1983). Determined by the
moisture holding capacity of the media, this property is dependent on the bulk density (wt
: vol) of the mix. The wide variation in composition of the soilless mixes also
complicates efforts to produce testing and fertilization guidelines.
Current procedures: a comparison
Bunt (1986) separates the water extraction methods used for soilless substrate
å
suspensions performed on a weight or volume basis. The water-extracted supernatant can
then be analyzed for any or all of the essential nutrients.
Saturation Extraction Method (Saturated Media Extract or SME). The SME was
developed at Michigan State University by Lucas and Rieke (Warncke, 1986). The SME
had a moderate to high degree of correlation with the Spurway test procedure (especially
soluble salts, NO3--N, P, and K). Procedures for the SME starts with moist substrate (about 500 cc) to which enough distilled or deionized water is stirred in until the media is
saturated to the point of glistening but with little or no standing water on the surface
(Warncke and Krauskopf, 1983). After about 30 minutes equilibration time, the substrate
solution is extracted with a vacuum filter. EC and nutrient analysis is then performed on
the extracted supernatant. The saturated substrate pH can be read from the slurry before
the filtering occurs, though values may be slightly lower (Lang, 1996).
Greenhouse growers can measure the pH and EC on their own, sending the rest of
the sample to an analytical lab for nutrient analysis, or simply send in a substrate sample
for testing. One of the benefits of the SME procedure is that any slow-release fertilizer in
the sample is subjected to minimal mixing and abrasion. Disadvantages include the fact
that it is labor-intensive, even when compared to other methods that do not require prior
drying and handling; and the point of saturation of the substrate is subjective, though
variation decreases if one person performs the mixing and saturation procedure
ä
Comparative studies have shown sample analysis results and interpretative ranges
for SME results can vary greatly among labs (Kirven, 1986). For example, optimum or
desired levels of Mg are published as: >70 ppm at Michigan State University, 80-125
ppm at the Ohio State University, and 60-90 ppm at the University of Georgia (Go
Dawgs!) (Kirven, 1986). Differences between sample analyses are often attributable to
judgement of saturation (Warncke, 1986). Despite the subjectivity and labor involved in
the SME procedure, it is currently the soilless media nutrient extraction method of choice
at most state and commercial analytical laboratories (Kirven, 1986). There are
interpretive ranges published for plug pH and EC. Bailey et al. (1995) propose ranges
for plug crops that grow best at a relatively high pH (6.0-6.8), low pH (5.4-5.8), or are pH
tolerant (5.4-6.8). Plug recommendations for EC range from initial substrate levels of
0.4-1.0 dS m-1 (Styer and Koranski, 1997) to levels for seedlings or plugs of 0.75-1.99
(Fonteno et al, 1995) or 1.0-2.0 dS m-1(Lang, 1996).
Water Suspension Extraction. Water extraction can be done with various
substrate to water ratios - 1:1.5, 1:2, 1:5 (Sonneveld, 1990). This is usually done on a
volume basis (v/v). Sampling by volume instead of weight helps overcome the wide
range of bulk densities of different soilless substrates (Bunt, 1986).ý Sources differ as whether the substrate should be tested moist and freshly collected (Fonteno, 1996) or
dried (Lang, 1996). At least 100 ml of substrate should be used. The substrate is then
mixed with the appropriate ratio of distilled or de-ionized water - 1.5 parts, 2 parts, 5
ìí
slurry can be poured through some kind of filter (coffee filters are often used) and the
solution collected for nutrient analysis (Lang, 1996). However, the dilution inherent in
the water suspension method in conjunction with a low-level fertility regime (such as
with plugs) can render micronutrient levels undetectable (W.C. Fonteno, personal
communication).
Most commercial labs do not have interpretive standards for the use of the 1:2
method (often referred to in industry literature as the 2:1; 2 parts water : 1 part substrate)
(Lang, 1996). Fonteno (1996) recommended the 2:1 method to greenhouse growers for
both electrical conductivity and pH analyses performed in-house. Though the level of
dilution can decrease sensitivity to variation in the samples, the method is less
equipment- and labor-intensive than the SME. Plug EC standards are available: the level
of soluble salts needs to be below 0.75 dS m-1 to avoid injury to the roots (Styer and
Koranski, 1997). Recommended pH values of 5.4% 6.2 are slightly lower than those for the SME and only for greenhouse soilless substrate in general (Lang, 1996). Indicative of
the level of dilution with the 2:1 method, EC values for seedlings of 0.25-0.75 dS m-1 (Fonteno, et al., 1995) and 0.5-0.9 dS m-1(Lang, 1996) are over 50% lower than values expected with the SME.
Pour-through Nutrient Extraction Procedure. This modification of the soil
solution displacement procedure is also known as the Virginia Tech Extraction Method or
VTEM (Wright, 1986). The pour-through is gaining popularity as a quick and easy
ìì
over a collection dish and enough distilled water is added to the surface of the substrate to
collect approximately 50 ml over several minutes (best results are achieved with
containers sized 6" and up). The leachate can then be analyzed on-site for EC and pH,
and if addition nutrient analysis is desired, shipped to a lab (refrigerate until analysis)
(Wright, 1986). This procedure is now standard practice in the container nursery industry
for pine bark-based substrates, but work has also been done with greenhouse pot plant
production (Wright et al., 1990). However, nutrient standards for peat-based substrates
have not been formally developed, and pH/EC interpretive scales are primarily based on
grower observations (Lang, 1996).
The big advantage to the pour-through method is that it’s not a destructive
sampling procedure, and no special equipment is needed for the extraction procedure.
The elimination of substrate handling, stirring, etc. keeps any slow-release fertilizer prills
from breaking (Wright, 1986). The time required for the extraction procedure is greatly
reduced. This also eliminates the labor necessary to perform extractions at the analytical
laboratory.
Pour-through nutrient sufficiency standards have yet to be developed for
greenhouse crops. Nutrient levels are higher in pour-through samples than in those
extracted with the SME and established interpretive values. The established
recommended values for the SME are not suitable for pour-through testing (Wright et al.,
1990). The minimum container volume to create sufficient leachate without undue
ìë
smaller containers and cell packs - grower experimentation is necessary to determine the
volume of water used (Lang, 1996). Preliminary work has been done to assess the use of
the Pour-through on plug trays but this information has not be conveyed to potential users
(Schweizer, 1993).
Press Extraction Method. Variations on this method have been used by Danish
pot rose growers for several years. The protocol for this method is being refined by the
plug research group at NC State University. Also referred to as the "squeeze", this is a
simple extraction method that can be performed right at the greenhouse bench on plugs
(Fonteno et al., 1995). The substrate is irrigated with fertilizer solution to container
capacity, then allowed to equilibrate for about an hour. Depending on the size of the
container, a portion of the substrate can then be scooped out or the cell popped out,
wrapped in cheesecloth, and gently squeezed, collecting the supernatant. Plugs still in the
tray can simply be pressed with the finger from above, again collecting the solution as it
runs out. The solution pH and EC can be measured immediately, and the extractant can
be forwarded to an analytical laboratory for nutrient testing. Test timing is important as it
must be accomplished within a few hours of fertilizer application (Compton and Nelson,
1997) before the plant takes up the available nutrients. This is a relatively new method,
and interpretive tables have yet to be completed.
pH and electrical conductivity testing for plug substrate
Substrate pH can affect nutrient availability in soilless substrates (Bailey et al.,
ìê
available pens and meters. Consistent soil/solution ratios and uniformity of procedures
are necessary to produce comparable pH and EC values.
It can be advantageous for a grower to perform pH and EC analysis on-site. A
laboratory’s handling of the substrate prior to analysis can affect the results. Air or oven
drying can decrease pH values up to 1.0 unit (T.E. Bilderback, personal communication).
Grinding of samples ruptures slow-release fertilizer particles, which increases soluble
salts and lowers pH.
Over nine extraction procedures for measuring soluble salts have been recorded in
the literature. There are a different set of interpretative ranges for each one (Kirven,
1986). Other water extraction methods such as the pour-through and the NCSU
"squeeze" (both described previously) are also suitable, and the extracted solution can be
sent on for nutrient analysis by an analytical lab. The recommended seedling or plug pH
and EC interpretation guidelines for SME and 2:1 are pH of 5.5-6.5 for either method
(Lang, 1996); EC of 0.75-1.99 dS m-1 for SME and 0.25-0.75 dS m-1 for 2:1 (Styer and Koranski, 1997).
Nutrient analysis for plug production
Fertilizer recommendations specific to plug growth stage and crop are not based
on individual nutrients but on EC levels obtained from the 2:1 extraction method (Styer
and Koranski, 1997). Acceptable pre-plant substrate nutrient levels, pH, and EC values
are based on the SME (Styer, 1996) but no recommendations are made for the growing
ìé
diversity of crops, substrates, and fertilizer regimes, growers are seldom sure what they
are looking for. The best technology currently available consists of individual ion (NO3 --N and K+ meters) with little research done on their accuracy (Rosen et al., 1996).
Sending in substrate (or leachate) for lab analysis can take several days while in the
meantime, nutritional disorders worsen or compound. The best-case scenario for the
future would be that each grower would have an in-house method of testing for the entire
range of essential nutrients within hours of solution extraction and a reasonably complete
ìè
Literature Cited
Bailey, D.A., P.V. Nelson, W.C. Fonteno, J.W. Lee, and J.S. Huang. 1995. Plug pH % the make or break factor in nutrition. GrowerTalks 59(9):6,8,10.12-13.
Bunt, A.C. 1986. Problems in the analysis of organic and lightweight potting substrates.
Hortscience 21:229-331.
Compton, A.J. and P.V. Nelson. 1997. Timing is crucial for plug seedling substrate
testing. HortTechnology 7:63-68.
Corey, R.B. 1987. Soil test procedures: correlation, p. 15-22. In: J.R. Brown (ed.). Soil
testing: sampling, correlation, calibration, and interpretation. Soil Science Society
of America, Madison, WI.
)RQWHQRñý:ï&ïýìääçïýý*URZLQJýPHGLDãýý7\SHVýDQGýSK\VLFDOîFKHPLFDOýSURSHUWLHVñýSïýäêð ìëëïýý,Qãýý'ï:ïý5HHGýõHGïôïý:DWHUñýPHGLDñýDQGýQXWULWLRQýIRUýJUHHQKRXVHýFURSVïý %DOOñý%DWDYLDñý,OOï
Fonteno, W.C., D.A. Bailey, and P.V. Nelson. 1995. Squeeze your plugs for simple,
accurate nutrient monitoring. GrowerTalks. 59(9):22,24,26-27.
Kirven, D.M. 1986. An industry viewpoint: horticultural testing - is our language
ìç
Lang, H.J. 1996. Grower media testing and interpretation. In: D.W. Reed (ed.) Water,
media and nutrition for greenhouse crops. Ball Publishing, Batavia, IL.
Markus, D.K., 1986. Spurway/acid extraction procedures. HortScience 21:217-222.
Mills, H.A., and J.B. Jones, Jr. 1996. Plant analysis handbook II. MicroMacro, Athens,
Ga.
Nelson, P.V. 1991. Greenhouse operation and management. 4th ed. Prentice-Hall, Englewood Cliffs, N.J.
Peck, T.R. and P.N. Soltanpour. 1990. The principles of soil testing. In: Soil Testing
and Plant Analysis, 3rd ed. Soil Science Society of America, Madison, WI.
Rosen, C.J., M. Errebhi, and W. Wang. 1996. Testing petiole sap for nitrate and
potassium: A comparison of several analytical procedures. HortScience
31:1173-1176.
Schweizer, A. L. 1993. Determination and assessment of procedures of the pour-through
nutrient extraction procedure for bedding flats and plug trays. M.S. Diss., Dept. of
Horticulture, Virginia Polytechnic Inst. and State Univ., Blacksburg.
Sonneveld, C. 1990. Estimating quantities of water-soluble nutrients in soils using a
ìæ
Styer, R.C. 1996. Key factors of water media and nutrition [for plug production].
GrowerTalks. 60(9):22-30.
Styer, R.C. and D.S. Koranski. 1997. Plug & transplant production: a grower’s guide.
Ball Publishing, Batavia, IL.
Tan, Kim H. 1996. Soil sampling, preparation, and analysis. Marcel Dekker, Inc., New
York.
Tucker, M. R., J.K. Messick, and C.C. Carter. 1996. Crop fertilization based on North
Carolina soil tests. Circ. No. 1. NC Dept. of Ag., Agronomic Div. Raleigh, NC.
Van Lierop, W. 1990. Soil pH and lime requirement determination. In: Soil testing and
plant analysis, 3rd ed. Soil Science Society of America, Madison, WI.
Warncke, D. D. 1990. Testing artifical growth media and interpreting the results. pp
337-357. In: Westerman, R.L. (ed.) 1990. Soil testing and plant analysis, 3rd
Edition. Soil Science Society of America, Inc. Madison WI
Warncke, D. D. 1986. Analyzing greenhouse growth media by the saturation extraction
method. HortScience 21:223-225.
Warncke, D.D. and D.M. Krauskopf. 1983. Greenhouse growth media: testing and
nutrition guidelines. Michigan State University, MSU Ag Facts Extension
ìå
Wright, R.D. 1986. The pour-through nutrient extraction procedure. HortScience
21:227-229.
Wright, R.D., K.L. Grueber, and C. Leda. 1990. Medium nutrient extraction with the
pour-through and saturated medium extraction procedures for poinsettia.
ìä
&
+$37(5ý7
:2ã
ý
(
))(&76ý2)ý9
$5,$%/(ý(
;75$&7,21ý)
25&(ý21ý3+ñ
(
/(&75,&$/ý&
21'8&7,9,7<ñ
ý$1'ý1
875,(17ý$
1$/<6,6$EVWUDFW
Substrate solution testing is an essential management tool for greenhouse plug
production. Current methods of plug solution extraction and testing can be confounded
by subjective aspects of their techniques. The press extraction method (PEM) developed
at N.C. State University offers a convenient and timely method of solution extraction.
The root substrate is brought to container capacity and after a period of one hour, the plug
surface is pressed with a finger or thumb to expel the solution. This series of experiments
serves to quantify possible variation that may occur in pH, electrical conductivity (EC),
and nutrient analysis from differing manual extraction forces. A modified press was
designed to apply a range of force (53, 71, 89, 106, and 124 Newtons), and sampling
protocol consistency was verified. For all three experiments, the range of extraction
forces within a single fertilizer rate did not significantly affect solution pH or EC. When
testing included a range of fertilizer rates, results were significantly different among the
fertilizer rates, demonstrating the method’s ability to detect changes in pH and EC
resulting from increases in fertility levels. Nutrient analysis (NO3-, NH4+, P, K, Ca, Mg, Na, B, Cu, Fe, Mn, and Zn) of solution extracted from two different rooting substrates
(peat-based and coir-based) showed no differences within substrates for the range of force
ëí
Plug production is a rapidly growing and significant sector of the floriculture
industry (Styer and Koranski, 1997). On-site testing is crucial for successful plug
production (Bailey et al., 1995). The relatively small volume of substrate results in a
smaller nutrient reservoir, or conversely, a reduced buffering capacity. Due to this small
margin of error, the recommendations are to test substrate pH and soluble salts or
electrical conductivity (EC) frequently (Fonteno et al., 1995). Nearly 80% of nutritional
problems are due to fluctuations in substrate pH and soluble salts levels that should be
monitored on a regular basis (Styer, 1996). However, the rapid production cycle for most
plugs of three to five weeks (from seed to transplant) negates the usefulness of analysis if
a lengthy turn-around is involved, as is often the case with analytical laboratories. Thus,
there is a need to develop a dependable, yet quick, method of substrate solution extraction
(Bunt, 1986) that can be implemented on a regular basis by plug growers.
Analysis of the true, displaced solution best assesses the nutrient status of the
growth substrate (Bunt, 1986). The press extraction method (PEM) is a variation of the
"squeeze" method introduced by Fonteno et al. (1995). The substrate is brought to
container capacity and not further diluted. Pressing the top of the plug and collecting the
expelled solution provides an extract that closely resembles the root zone solution.
Solution pH and EC can be determined within minutes, and the extracted solution can be
sent on to an analytical laboratory for nutrient testing.
The objective of these experiments was to quantify how extraction force may
ëì
solution pH and EC initially with one fertilizer concentration, then over a range of
concentrations. We also examined the effect of variable force on the chemical analysis
of coir, an alternative substrate component.
Materials and methods
Common to all experiments. Though pressure from a finger or thumb is all that is
required to extract the solution, an apparatus was created to apply and quantify the
variations in force used to extract the solution from the substrate. Modified manual drill
presses (penetrometers or firmness testers) have been used to measure force exerted on
the skin of fruit in postharvest experiments (Reid, 1992). For our purposes, a drill press
was modified to hold a 150 cm3 (9.15 inch3 ) volume of substrate in a Plexiglas cylinder while a plate 4.45 cm (1.75 in) in diameter compressed the sample of substrate as force
was applied. The expelled solution was collected at the base. Treatments were fixed at
53, 71, 89, 106, and 124 Newtons (N) [12, 16, 20, 24, 28 pound-force (lbf) (pounds of
force per surface area of the pressure plate)]. This range was determined by measuring
the volume of solution that could be expelled manually (by squeezing or pressing) from
the same volume of substrate. These volumes were then correlated to the amounts
expelled by the apparatus at these forces.
Plug flats [288 cells, cell volume 6 cm3 (1.22 inch3)] were filled with screened substrate consisting of 3 peat : 1 perlite (by volume) (unless otherwise specified),
amended with dolomitic lime at a rate of 6 g.L-1 (10.1 lb/yd3 ), and placed on a
ëë
irrigation event as recommended by Compton and Nelson (1997). This timing allows for
nutrient equilibrium within the substrate to produce an adequate amount of solution for
analysis. Data were subjected to analysis of variance using the general linear model (SAS
Institute, Cary N.C.). When model analysis showed a significant force (treatment) or
fertilizer rate effect, means were subjected to trend analysis.
Effect of extraction force on pH and EC (expt. 1). Three plug flats were filled
with substrate, placed in trays, subirrigated with 20N-4.3P-16.6K (Peter’s Peat Lite
Special, Scotts, Marysville, Oh.) at 75 ppm (75 mg.L-1) N, and allowed to equilibrate for 24 h. Flats were subirrigated with water to obtain container capacity 1 h prior to testing,
then removed from trays to allow drainage of excess moisture. The contents of the flats
were removed and gently combined to help insure uniformity of the samples. Each
sample weighed 35 g (1.23 oz) ( 5%), predetermined as the sample size necessary to
produce at least 20 ml (0.67 fl oz) of expelled solution.
Measurements included pH and EC of the extracted solution (Twin pH meter
B-213 and conductivity meter B-173, Horiba, Inc., Kyoto, Japan). To verify consistency of
our samples and cylinder packing technique, substrate sample wet weight (WW) and dry
weight (DW) were measured to calculate percentage recovery of moisture
([WW%DW] WW) 100) (Fonteno, 1996). Samples were weighed at the time of testing
(filling the press cylinder) and again after drying at 1052F (412C) for 24 h. The five
ëê
Effect of extraction force on pH and EC at three N rates (expt. 2). The same
methods were used as established in the previous experiment but the plug flats were
subirrigated with 20N-4.3P-16.6K at 75, 125, and 175 ppm (mg.L-1) N (three flats per rate) and allowed to equilibrate for 24 h. Flats were subirrigated with water one h prior to
testing. Contents of the three flats for each rate were carefully combined to reduce
sample variability. The five treatments 53, 71, 89, 106, and 124 N, were replicated six
times for each of the three fertilizer rates for a total of 90 experimental units. pH and EC
of the extracted solution were measured.
Effect of extraction force on nutrient analysis of peat substrate (expt. 3). The
same methods were used as in the prior experiments but extracted solution was also
analyzed for NH4+ , NO3- (LACHAT QuickChem, Milwaukee, Wis.); P, K, Ca, Mg, B, Cu, Fe, Mn, Na, and Zn (Jarrell Ash ICAP 9000, Franklin, Mass.) content. Flats were
filled with a commercial soilless germination mix (2-P; Fafard, Anderson, S.C.) and
subirrigated twice (within 48 h) with 20N-4.3P-16.6K at 125 ppm (mg.L-1) N to insure measurable levels of nutrients. Flats were allowed to equilibrate for 24 h and then were
subirrigated with water 1 h prior to extraction. The contents were combined to reduce
sample variability. The five treatments (force) were replicated five times for a total of 25
experimental units for the peat-based germination mix.
Effect of extraction force on nutrient analysis of coir substrate (expt. 4). The
substrate tested was 3 coir : 1 perlite (by volume) (screened coconut husk fiber; Crystal
20N-4.3P-ëé
16.6K at 125 ppm (mg.L-1) N. The procedures used were the same as in the previous experiment, with one exception. The lowest-force treatment of 53 N was not used on the
coir (insufficient amount of solution for testing was extracted), leaving four treatments
with five replications each for a total of 20 experimental units. After pH and EC were
measured, the extracted solution was analyzed for NH4+ , NO3- P, K, Ca, Mg, B, Cu, Fe, Mn, Na, and Zn content.
Results and discussion
Effect of extraction force on pH and EC (expt. 1&2). For plug flats subirrigated
with 75 ppm (mg.L-1) N, the pH, 5.4 0.06 (mean SD), and EC, 0.65± 0.04 dS·m-1 (mmho·cm-1), of the substrate solution were unaffected by differing extraction forces. After extraction, the remaining percent moisture content (87.1 0.5%), of the substrate
samples was not significantly different, verifying consistency in our sampling techniques.
The pH and EC of solution extracted from substrate treated with three N rates was
not affected by the range of extraction forces within each fertilizer rate, therefore, data
were pooled within N rates. The pH and EC were significantly different among the
fertilizer rates as presented in Table 1. These data help demonstrate the method’s ability
to detect changes in pH and EC resulting from increases of at least 50 ppm (mg.L-1) N in fertility levels.
Effect of extraction force on nutrient analysis (expt 3 & 4). Within each substrate,
ëè
previous experiments, solution pH and EC were unaffected by extraction force for either
peat or coir substrates. Therefore, data were pooled within each substrate. EC levels were
relatively high (with associated lower pH levels) due to two applications of the fertilizer
without leaching. Though not an initial objective, comparisons of the nutrient analysis
between the peat-based and coir substrates revealed differences that may be inherent in
the nutrient holding and exchange capacities as well as product source (Table 2).
Elevated levels of K and Na are common due to the source of coir (W.C. Fonteno,
personal communication). Other analyses of coir versus peat substrates have yielded
significant differences in pH (Handreck, 1993), EC, and nutrient content (Evans et al.,
1996; Evans and Iles, 1997; Meerow, 1994). Determination of substrate chemical
properties is advised and amendments and fertilizer regimes should be adjusted
accordingly.
There are other methods of substrate analysis suitable for production floriculture.
However, there has been little documentation of these methods (or accompanying
standards) for their use in plug production. These methods include suspension analysis of
various water to substrate ratios (e.g. 2:1, 6:1) (v:v), and the saturated media extract
method (SME). For both methods, the substrate is removed from the container and water
is added, resulting in significant and variable dilution that has to be considered when
comparing to standards for pH and EC (Wright, 1986). In the case of the suspension
analysis technique, the substrate packing density is subjective, while in the SME
ëç
analysis technique has an additional disadvantage in that the diluted extract can only be
used for measuring pH and EC % the degree of dilution can reduce micronutrients to undetectable levels, hence labs in the United States have not developed standards for
interpreting this method. The lack of significant dilution and uniformity in results
regardless of extraction force dispels two potential sources of subjectivity for the PEM.
Another method of extraction is the pour-through or Virginia Tech Extraction
Method (VTEM) wherein a known volume of water is added to the substrate surface and
the displaced solution is collected at the base (Wright, 1986). The pour-through method
has become the method of choice for the container nursery industry and shows potential
for floriculture pot crops, but the nature of plug flats limits its suitability for plug
production. The short substrate column limits the gravitational flow which is necessary to
displace the root-zone solution (Fonteno, 1996). This results in a perched water table that
does not drain rapidly enough for easy on-site solution collection.
The PEM is appealing since it is extremely easy, may be used at any stage of
plug growth, and requires no special equipment (Fonteno et al., 1995). We have
demonstrated that variability in extraction force did not affect the solution chemical
analysis for either peat-based or coir soilless substrates. This method is especially suited
for on-site testing of root-zone solution pH and EC. The use of specific ion meters for
on-site nutrient testing could also be of value to growers. Portable specific ion electrodes
have been developed for NO3- and K+ testing, though little work has been done to assess
ëæ
further development of this simple, alternative, on-site technique for grower monitoring
of the root-zone status of plug crops.
Literature Cited
Bailey, D.A., P.V. Nelson, W.C. Fonteno, J.W. Lee, and J.S. Huang. 1995. Plug pH % the make or break factor in nutrition. GrowerTalks 59(9):6-13.
Bunt, A.C. 1986. Problems in the analysis of organic and lightweight potting substrates.
Hortscience 21:229-331.
Compton, A.J. and P.V. Nelson. 1997. Timing is crucial for plug seedling substrate
testing. HortTechnology 7:63-68.
Evans, M.R. and J.K. Iles. 1997. Growth of Viburnum dentatum and Syringa ×
prestoniae ‘Donald Wyman’ in Sphagnum peat and coir dust-based substrates. J.
Environ. Hort. 15:156-159.
Evans, M.R., S. Knoduru, and R.H. Stamps. 1996. Source variation in physical and
chemical properties of coconut coir dust. HortScience 31:965-967.
Fonteno, W.C., D.A. Bailey, and P.V. Nelson. 1995. Squeeze your plugs for simple,
accurate nutrient monitoring. GrowerTalks 59(9):22-27.
Fonteno, W.C. 1996. Growing media: Types and physical/chemical properties, p.
93-122. In: D.W. Reed (ed.). Water, media, and nutrition for greenhouse crops.
ëå
Handreck, K.A. 1993. Properties of coir dust, and its use in the formulation of soilless
potting media. Commun. Soil Sci. Plant Anal. 24:349-363.
Meerow, A.W. 1994. Growth of two subtropical ornamentals using coir (coconut
mesocarp pith) as a peat substitute. HortScience 29:1484-1486.
Reid, M.S. 1992. Maturation and maturity indices, p. 21-28. In: A.A. Kader (ed.).
Postharvest technology of horticultural crops, 2nd ed. Univ. of Calif. Div. Agr. and Nat. Resources. Pub. 3311. Oakland, Calif.
Rosen, C.J., M. Errebhi, and W. Wang. 1996. Testing petiole sap for nitrate and
potassium: A comparison of several analytical procedures. HortScience
31:1173-1176.
Styer, R.C. 1996. Key factors of water media and nutrition [for plug production].
GrowerTalks 60(9):22-30.
Styer, R.C. and D.S. Koranski. 1997. Plug & transplant production: A grower’s guide.
Ball , Batavia, Ill.
Wright, R.D. 1986. The pour- through nutrient extraction procedure. HortScience
ëä
Table 1. Effect of rate of fertilizer application on pH and electrical conductivity of
extracted solution. Extraction force treatments were not significant (data pooled within
fertilizer rates) (expt.2).
Fertilizer
rate EC
mg.L-1 N pH (dS·m-1)
75 5.97 0.1z 0.93 0.2
125 5.77 0.1 1.84 0.1
175 5.63 0.1 1.98 0.2
Significance
L** Q**
r2 0.58 0.82
z
Mean standard deviation n = 25
**
êí
Table 2. Comparison of chemical properties of peat-based and coir-based substrates
subjected to same fertilizer. Force treatments were not significant, data are pooled means
(expt. 3 & 4).
Substrate
Variable Peat-based Coir-based
pH 4.8 0.05z 5.0 0.06y
(dS·m-1)
EC 3.2 0.2 3.2 0.1
ppm (mg#L-1)
NO3- 295 26.4 234 7.3
NH4+ 69.5 5.0 31.0 2.2
P 39.2 5.3 40.3 1.2
K 303 39.5 644 19.5
Ca 165 25.2 26.3 2.8
Mg 125 17.2 21.7 1.2
Na 47.6 5.4 195 6.2
Fe 2.3 0.3 0.7 0.02
Mn 1.1 0.2 0.5 0.03
Cu 0.06 0.02 0.2 0.02
Zn 0.3 0.05 0.3 0.01
B 0.2 0.02 0.4 0.01
z
êì
&
+$37(5ý7
+5((ã
ýý,
19(67,*$7,21ý2)ý7+(ý4
8$17,7$7,9(ý5
(/$7,216+,36%(7:((1ý
6
2/87,21ý(
;75$&7,21ý7
(&+1,48(6Abstract
Substrate electrical conductivity (EC), pH, and nutrient content should be
monitored frequently during seedling plug production. Current testing methods are either
complicated, unsuited to plug production, or interpretation standards do not exist. This
study compares the press extraction method (PEM) developed at North Carolina State
University to the saturated media extract (SME) and the 2:1 water : substrate suspension
method (2:1). These solution extraction methods were applied to plug trays containing
peat-based germination mix treated with four levels of fertilizer. Two sample sizes of 20
and 60 plugs were used to determine if the smaller, less destructive sample size would
produce satisfactory results. Resulting pH values varied within 0.3 units among methods
but variability in EC and nutrient content was greater. The PEM method resulted in the
highest values for EC, NH4+-N, NO3- -N, K, Ca, and Mg while sample size had little effect on analyses. The three extraction methods were then compared on both peat- and
coir-based substrates. Within substrates, pH, EC, and nutrients tested were similar
between the PEM and SME. Between substrates, the coir extract had a higher pH and
much higher levels of K and Na. Solution from the peat was higher in N, P, Ca, and Mg.
The similarity between the PEM and SME analysis in the second experiment suggests
êë
Introduction
Maintaining optimum fertility levels is difficult for plugs because 1) cell volumes are
small resulting in little buffering of nutrients by substrates; and 2) the large seedling to
substrate volume ratio results in either rapid uptake of nutrients or dilution/leaching
effects from watering (Compton and Nelson, 1997). Substrate pH and soluble salts
should be monitored weekly as seedlings are especially sensitive to extreme levels of
soluble salts (Fonteno et al., 1995). Substrate electrical conductivity (EC) is a reliable
indicator of the soluble salts concentration (Poole and Chase, 1987). Substrate pH, EC,
and nutrient concentrations can be monitored by analyzing samples in the greenhouse or
sending samples to a lab. However, consistent procedures at both the sampling and
analysis stage are necessary to produce consistent and reliable results (Lang, 1996).
Current greenhouse (peat-based) substrate pH and soluble salts interpretation ranges are
based on 2 water : 1 substrate (v/v) suspension (2:1), the saturated media extract (SME)
method, or the pour-through. Interpretive standards for nutrient content are only
available for the SME.
The press extraction method (PEM) is a viable alternative to conventional testing
methods. Variations on this method have been introduced as the "squeeze" extraction by
researchers at N.C. State University (Compton and Nelson, 1997; Fonteno et al., 1995).
The PEM is very simple and quick: as soon as one hour after fertigation, while the
substrate is still at or close to container capacity, the grower picks up a tray and presses
several plugs, collecting the expelled solution for immediate analysis. Precedent for
êê
hydraulic press as the "standard closest to the actual root zone solution" with which to
compare the 1:1.5 and 1:25 suspension methods. In previous experiments with our own
press, we found that varying the force applied within a range likely to be manually
applied by growers did not affect the pH, EC, or nutrient analysis of the extracted
solution (Scoggins et al., 1999).
The saturated media extract (SME) is most commonly used by commercial
laboratories (Warncke, 1986). Greenhouse growers can test for pH and EC on-site by the
2:1 (Sonneveld, 1990). Neither of these methods is well suited to plug production. Both
the SME and the 2:1 method require removal of the substrate from the tray and the
subjective addition of water (Fonteno et al., 1995). Also, as plugs reach transplant size
(especially for trays numbering 288 cells), roots comprise the greater volume of the
cell; making it difficult to remove enough substrate to perform the SME or 2:1. The
pour-through method (Wright et al., 1990) of root-zone solution displacement is rapidly
gaining acceptance for bedding and pot plant testing. However, this method is also
difficult for plug systems. The short substrate column limits the effectiveness of using
gravity as the solution extraction force (Fonteno, 1996). Vigorous shoot growth in the
later stages of plug production often covers the tray, leaving little or no surface area for
applying the displacing water (personal observation).
Depending on the extraction method used, alternative substrates such as coir may
yield differing analyses. Properties of peat and coir have been compared (Evans et al.,
1996; Handreck, 1993; Meerow, 1995) but not the impact of different extraction methods
êé
The objectives of this study were to (1) compare the SME and 2:1 methods to the
PEM for use in the analysis of a greenhouse substrate; (2) examine the relationships
between these methods if a different substrate component (coir) is used; and (3)
determine if sample size (number of plugs per analysis procedure) affects the results.
Regarding sample size, protocol for the SME method suggests using 400 cm3 of substrate per sample (Warncke, 1986) % this would require nearly 70 plugs from a 288-cell tray. A reduction in the number of plugs necessary for a sample would limit the grower’s losses
associated with testing.
Materials and Methods
Comparisons among methods % peat-based substrate (expt.1). Plug flats (288
cells, cell volume 5.7 cm3) were filled with commercial peat-based germination mix
containing limestone and a preplant nutrient charge ( 4-P, Fafard,Anderson, S.C.) and
placed on a greenhouse bench. Fertilizer was applied via subirrigation with
20N-4.3P-16.6K (Peter’s Peat-Lite Special, Scotts, Marysville, Oh.) at four rates: 50, 100, 150, and
200 mg.L-1 N. After 24 h of equilibration, flats were again subirrigated with these rates one hour prior to testing, then removed from trays to allow drainage of excess moisture.
There were five reps (plug flat = rep) for each fertilizer rate. Samples for the three
substrate solution extraction methods (SME, 2:1, and PEM) were collected from each
flat. The experimental units consisted of the 20 or 60 plugs used for each method.
Extracted solution was analyzed for pH and EC (EXTECH 695 pH/Conductivity Meter,
êè
from the SME and PEM was then tested for NH4+-N, NO3- -N (Lachat Quik Chem 8000, Zellweger Analytics, Milwaukee, WI), and P, K, Ca, and Mg (Plasma 2000, Perkin Elmer
Corp, Norwalk, CT).
Solution extraction methods:
SME. Samples of 20 or 60 plugs were chosen randomly, removed from the flat,
and placed in a beaker. Deionized water was added while gently mixing until the sample
was saturated to the point of "glistening", then allowed to equilibrate for 30 minutes. The
sample was transferred to a Büchner funnel lined with filter paper (Whatman #1), placed
over a vacuum flask, and the solution removed under vacuum.
2:1. Again, 20 or 60 plugs were randomly removed from the flat and placed in a
beaker. The plugs were gently stirred (broken up) to determine volume (around 110 ml
for 20 plugs and 330 ml for 60 plugs). Deionized water was added at a rate of twice the
substrate volume. The sample was stirred thoroughly and allowed to equilibrate for 30
minutes. The pH and EC electrodes were placed directly into the slurry. Nutrient
analysis was not performed on the 2:1 samples as most commercial labs do not have
interpretive standards for this method.
PEM. The substrate remaining in the plug trays was rehydrated to replace any
moisture that might have been lost during the time required for the SME and 2:1
extractions. This was accomplished by placing the plug tray in a container with enough
deionized water to bring the remaining plugs to container capacity. They were placed on
êç
beaker and 20 or 60 plugs were pressed to expel the solution. pH, EC, and nutrient
analysis were conducted as with the SME samples.
Data were analyzed as a split plot design. The plug tray treatments of different
fertilizer rates, the main plot factor, were arranged in a RCBD. Subplot factors were
factorial combinations of sample size and solution extraction methods. Data were
subjected to an analysis of variance using the general linear model (SAS Institute, Cary
NC). When model analysis showed a significant main effect or interaction, means of the
qualitative factors, extraction method and sample size, were compared with a mean
separation procedure (Fisher’s protected LSD). Means of the quantitative factor, fertilizer
rate, were subjected to trend analysis.
Comparisons among methods % coir- vs. peat-based substrates (expt. 2).
Plug tray sections of 72 cells were filled with 3 sphagnum peat: 1 perlite (v/v) or 3 coir: 1
perlite (v/v) substrates. No lime or nutrient amendments were added. Four fertilizer
treatments of 0 (water), 100, 200, and 300 mg.L-1 N were randomly assigned within each block. Increments between fertilizer rates were increased relative to expt. 1, to ensure
that changes in EC and nutrient content could be detected. The fertilizer source was
15N-2.15P-12.45K ( Miracle Gro Excel, Scott’s, Marysville, Ohio). Trays were subirrigated
with the appropriate fertilizer treatments until the substrate was saturated, drained to
container capacity, and allowed one hour to equilibrate before testing. Extraction
methods were performed nearly simultaneously, eliminating the need for further