Mining Data through Clustering in SAS
Studio
Dr. Reena Hooda
Assistant Professor, Department of CSE, Indira Gandhi University Meerpur (Rewari). Haryana, India
ABSTRACT: Clustering is one of the major methods of data mining can be merged with the other methodslike KNNto get the precise results. Natural clustering is unsupervised method where a user has no control over the number of clusters generated. However, a user can make it supervised through the specification of number of clusters required, number of variables on which clustering has to be done and the selection of variables to be included in the output and results of the coding as done in SAS Studio. In a simple way, clustering is the grouping of the objects in such a way that members or the objects of a group are much similar to each other than the members or the objects of other group or class or the partition. The grouping may be done on the basis of distance measure say Euclidean distance between members. The application of clustering is useful in study the data from different perceptions helpful in research or to select the target area for production or marketing etc. The present application is emphasizing on the analyzing the current data through grouping and representation in various ways and applicability of clustering in SAS studio to get the results and user defined outputs via procedural language by means of predefined keywords and variable assignments to create clusters from given data source and their graphical representation.
KEYWORDS: Cluster, SAS Studio, Plot, Library, criterion.
I. INTRODUCTION
SAS studio has inbuilt facility to create clusters via various predefined methods and arguments and generated the reports automatically in form of tables and diagram. The data source for the clustering is mining data. [3]SAS procedures for clustering arefocused to disjoint or hierarchical clusters from coordinate data, distance data, or a correlation or covariance matrix. [4]Proc Cluster computes Euclidean distance [1] The various methods of clustering in SAS Studio are Average linkage , Median, Single linkage, Density linkage including KNN methods, Centroid, MCQ, MED, Wards methods etc. [1] [5][6][7][8][9] [10]
Data mining includes various methods of clustering like Fuzzy logic, k-Nearest Neighbor Method, Decision trees, Clustering and Neural Networks etc. Clustering is one of the most popular techniques of data mining that includes the grouping of the objects based on some similarity measure and to view the data in different perspectives. Advantage of this technique is that in addition to the grouping of the data, it can also be used as a base with other methods of mining, for instance k-Nearest Neighbor, Fuzzy Logic;all can be implemented after performing clustering. After basic understanding of the SAS mechanics, presentation of the data, the current paper highlighted the coding part to show the methodology to create different clusters and view the data including the pictorial representation.
II. LITERATURE SURVEY
III. CREATING CLUSTERS IN SAS STUDIO AND RESULTS
The present application applied average linkage method of clustering. Before applying the method, the csv mining file has to be imported in SAS Studio, the code also include an output data file work.mining23 stored in the library. If it is already exists it will be overwrite with this new uploaded data file. The code is:
proc import datafile="/home/reenah20130/mining.csv" out=work.mining23 replace;
run;
After creating the data source file named mining23in the library, the procedure is required to mention the cluster, input data, method of clustering and output data clusters, name of variables are required to be included in the results. The Proc stands for the procedure name cluster where cluster is a predefined procedure in SAS. The user defined procedure is given and results are shown in Fig. 1.The present application uses the average linkage method of clustering as discussed.
proc cluster data=work.mining23 noprint method=average outtree=work.rcluster;
var YEAR QTR PRO POW;
run;
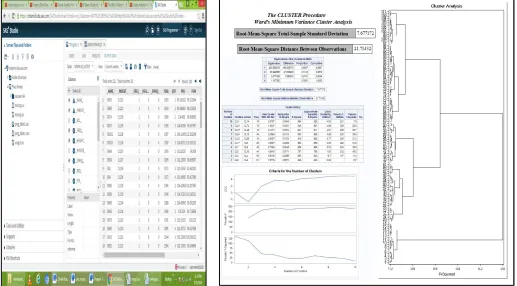
proc cluster data=work.mining23 method=ward ccc pseudo rmsstd print=10outtree=work.rcluster plots=den(height=rsq);
var YEAR QTR PRO POW;
idid ; run;
The output data shows the various columns generated after clustering. Fig. 1 shows the resultant tables covariance matrix, root-mean-square total-sample standard deviation, root-mean-square distance between observations, cluster history like numberof clusters, clusters joined, frequency, norm RMS distance and tie along with the titled graph. The user defined code written for the clustering shows the unsupervised clustering where all the data, number of columns, rows and their graphical representation is automaticallygenerated. A user has to just define the output file name for the clustering that will be stored in the SAS library. The output window as shown in Fig. 3 also shows the name of the output file. The way data is grouped is shown graphically by the Studio that forms a tree shown in Fig. 1. However, SAS Studio provide a flexibilityto the user in output data set is that number of columns can be increased or decreased just deselecting the columns on the left side of the table. Similar way the order of the columns can also be changed in output table, the output of the clustering is shown in Fig. 2. The following code has been generated automatically by SAS Studio to get the output.
PROC SQL;
CREATE TABLE WORK.query AS
SELECT _NAME_ , _PARENT_ , _FREQ_ , _HEIGHT_ , _SPRSQ_ , 'YEAR'n , QTR , PRO , POW , _DIST_ , _AVLINK_ FROM WORK.RCLUSTER ORDER BY sortkey(_PARENT_, "en_US");
RUN; QUIT;
PROC DATASETS NOLIST NODETAILS;
CONTENTS DATA=WORK.query OUT=WORK.details; RUN; PROC PRINT DATA=WORK.details; RUN
Fig. 2:Output data after Clustering Fig.3: Criteria for the Clusters and Dendrogram using Average Distance Method
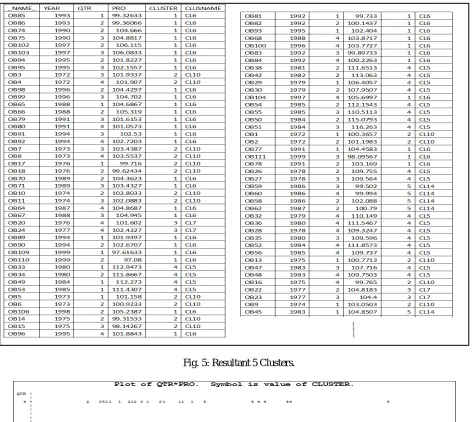
To get the flexibility to define the number of clusters required in output data and to avoid the unnecessary clustering a new keyword nclusters has been used to defined the number of clusters i.e. 5 in this program and code is given and output table is shown in Fig.4.
proc tree data=work.rclusternclusters=5 out=work.finalcluster;
copy year qtr pro; run;
proc plot;
plotqtr*pro=cluster; run;
quit;
The resultant table in Fig.4 shows three more columns other than the mention variables in the code. One is a _NAME_ i.e. unique name to each value in resultant table plus two more columns titled CLUSTER and CLUSNAM. The CLUSTER
Fig. 5: Resultant 5 Clusters.
IV. CONCLUSION
Creating clusters on the basis of different variables through suitable methods like average, centroid, wards, and median etc. as well as finding the correlation between data say Pearson Correlation coefficient, provides a great flexibility to user to view the data and gain knowledge about the patterns in the data quickly, with minimum level of coding, basic knowledge by way of SAS Studio. One can perform analysis without looking for the outside expert or software support, data can be categorized, copied for future use, reports can be generated including graphical dispersal of the data. The number of clusters can be increased or decreasedjust similar to the variables as done in the current application where mining.csv data is classified with natural clustering including leveled clustering to view data with different outlooks and to show the correlation between variable like PRO and POW. Further in present application input 5 specified the user defined number of clusters for comprising the variables QTR, YEAR and PRO and created with their unique names and grouping of values into different partitions and are plotted using PROC Plot. The main advantage of clustering in SAS studio is that the criterion for the clusters can be specified viaCCC, PSEUDO, RMSSTDto estimate the good number of clusters, possible clusters, outliers and clustering level. The further scope of the work may roll towards the discovery of hidden values to aid in estimating unknown values using the SAS Studio.
REFERENCES
1. https://support.sas.com/rnd/app/stat/procedures/cluster.html
2. https://support.sas.com/documentation/cdl/en/statug/68162/HTML/default/viewer.htm#statug_cluster_gettingstarted.htm 3. http://www.principlesofeconometrics.com/excel.htm
4. SAS Documentation, SAS/STAT® 9.2 User’s Guide Introduction to Clustering Procedures.
https://support.sas.com/documentation/cdl/en/statugclustering/61759/PDF/default/statugclustering.pdf 5. https://en.wikipedia.org/wiki/SAS_(software)
6. http://support.sas.com/training/tutorial/studio/create-table-csv-file.html 7. http://support.sas.com/software/products/sasstudio/
8. http://www2.sas.com/proceedings/sugi31/099-31.pdf 9. http://support.sas.com/documentation/onlinedoc/sasstudio/
10. Michael A. Monaco, Marie Dexter, Jennifer Tamburro, ‘Introduction to SAS® Studio’. Paper SAS302-2014. Retrieved from: http://support.sas.com/resources/papers/proceedings14/SAS302-2014.pdf
BIOGRAPHY