Available Online atwww.ijcsmc.com
International Journal of Computer Science and Mobile Computing
A Monthly Journal of Computer Science and Information Technology
ISSN 2320–088X
IMPACT FACTOR: 6.017
IJCSMC, Vol. 7, Issue. 11, November 2018, pg.31 – 37
Study of Clustering Techniques in
the Data Mining Domain
Parth Ritin Saraiya
1, Yogita Ganage
2¹Department of Information Technology, Manjara Charitable Trust’s Rajiv Gandhi Institute of Technology, India ²Department of Information Technology, Manjara Charitable Trust’s Rajiv Gandhi Institute of Technology, India
1
[email protected]; 2 [email protected]
Abstract— Data mining is the search or the discovery of new information in the form of patterns from huge sets of data. The goal of data mining is to provide companies with valuable, hidden insights which are present in their large databases. Clustering is one such important technique that is used in data mining. It is the process of grouping similar data items into clusters and hence we can define a cluster as a group of items which are similar between them and dissimilar between items of another cluster. This paper is intended to examine and evaluate various data clustering methods and algorithms. The purpose of discussing the various algorithms is to make beginners and new researchers understand the working of clustering methods, which will help them to come up with new approaches for the improvement of these methods.
Keywords— Data mining, clustering, clusters, databases, similar, KDD
I. INTRODUCTION
In today's day and age, where technology has taken over the world, a lot of data is generated on a daily basis. For instance, online stores like Amazon handles millions of transactions every day, which creates a large volume of data. Billions of web searches, supported by various search engines create petabytes of data on a daily basis. Social media websites create a lot of data in the form of pictures, videos, and blogs. The list of sources that generate huge amounts of data every day is endless.
With this explosive growth in data, enterprises have come to a realization that information that is being accumulated over the years has the potential to become an important strategic asset which could unlock the doors to success for the organization. With the amount of data that is present it is impossible to analyze it with the human eye. What was required were methods that would help the organization to distill the most valuable information from heaps of data that had been accumulated. This compulsion led to the birth of data mining.
Data mining is defined as the set of tasks that are used for the systematic and automated discovery of previously unknown, implicit, hidden information from data present in databases, which could potentially be useful for business organizations. Data mining is frequently considered as a synonym of the knowledge discovery process (KDD). The two terms are interchangeable.
A. Basic Data Mining Tasks
There are many data mining tasks present. These are individual tasks, which can also be combined to create sophisticated systems
1. Classification: It is the mapping of data into predefined assemblages or classes. These classes are determined before the data is examined and hence it is considered as a supervised learning technique. The classes are often defined based on the attributes or characteristics of the data that has to be classified. Classification can be qualitative, quantitative, geographical and chronological Qualitative classification includes characteristics like honesty. Intelligence and truthfulness Quantitative classification includes groups based on height, weight, profit, loss. Geographical classification is based on states, cities, countries, and continents Chronological classification is where data is classified on the basis of differences in time, which is very popular in economics.
2. Regression: It is the technique of mapping a data item to a real predicted value. In fact, regression is somewhat the study of the function that helps in the mapping of the data item. Regression helps us comprehend how the usual value of the dependent variable might be affected when any one of the independent variables is varied, while the other independent variables are held fixed.
There are several types of regression techniques like linear regression, polynomial regression, stepwise regression.
Regression is used to predict a numeric or continuous value. For example, regression would be used to predict a soccer team's value based on its sponsors, league position, fan support, trophies won, and other factors. 3. Time Series Analysis: The value of a data attribute can be analyzed over time using time series. The time series graph can perform three different functions, which include the measurement of similarity between different time series using distance metrics, the study of behavior based on the structure of the line in the plot and thirdly to make future predictions using historical time series plot analysis.
4. Clustering: Also known as Cluster Analysis, is the process of grouping items into clusters so that objects within the cluster have very high similarity and at the same time are dissimilar to data objects of different clusters. Clustering is different from classification. In classification, classes present are predefined whereas, in clustering, clusters are not predefined and we have no prior information about the clusters.
5. Summarization: It is the mapping of data into subsets with simple descriptions related to it. Summarization characterizes the data present in the database and hence it is also known as characterization or generalization. It gives us the representative information about the database that is in use.
6. Association Rule: It is a procedure used to determine relationships between data. It helps us to forecast the occurrence of a specific item based on the occurrences of the other items in the transaction. This is a very popular method used in market basket analysis, where the item, which will be added to, the basket next is predicted using some pattern associated based on items that are frequently purchased together
B. Uses of Data Mining
1. Profiling of Customers: A customer profile contains facts about the customer. These facts can be used to separate valuable customers from ordinary customers. It can also be used to facilitate loans and credit card approvals
2. Fraud Detection: It is one of the most popular applications of data mining where unusual, expensive purchases are identified easily and labeled as fraud purchases using data mining techniques. This is used in the banking and financial sectors, and government agencies.
3. Healthcare: Healthcare providers use data mining techniques to the most effective treatments. And best practices. These tools are used to compare symptoms, causes, treatments, and negative effects and then advance to examine which action will be the most effective solution for a group of patients
4. Manufacturing Industry: Data mining can be used in system-level planning to obtain the relationships between the architecture of the product, product collection, and customer data. It can also be used to predict the development time, cost of the product, and dependencies among other tasks
5. Education: Data mining is used to collect the related information about the student like name, age, gender, course, etc. It can then be used to provide a customized study plan for students according to their needs, which helps the students for their better development and to enhance their educational experience.
II. CLUSTERING
Here the class label of each and every customer is unknown, unlike classification where it is known, and hence we need to discover these groupings. Given a large database of customers, having multiple attributes that define their profile, it is infeasible and very costly to come up with the portioning of customers manually into strategic groups. This is where clustering tools come to help.
We define clustering or cluster analysis as the process of segmenting or partitioning a set of data items into groups called clusters, which are subsets of these data items. Each cluster will have data items having a similar criterion and at the same time, these items will be different from the data items of another cluster. The basic principle it follows is to have high intra-cluster similarity and maintain an inter-cluster dissimilarity at the same time. This partitioning is performed using some clustering algorithms and not manually by humans.
Clustering is an unsupervised learning approach where the similarities between data items are found by analyzing the actual data and not by using pre-defined labels, this is the main difference between clustering and classification, which follows a supervised learning technique.
In business, organizations clustering can be used to organized customers into groups based on some time of similar characteristics, which is then used to facilitate different business strategies based on these characteristics. Clustering has contributed to many fields that include statistics, marketing, pattern recognition, information retrieval [DMCT]. Clustering has a large number of applications, especially in the data mining domain.
A. Required Features of Cluster Analysis
1. Scalable: Algorithms deal well with small datasets, but they should have the ability to deal with large datasets containing millions of data items gracefully
2. One scan of dataset: The data is stored on disks and the cost of I/O becomes significant while solving the problem[DMCS].Hence the method used should only scan the disk once
3. Ability to deal with noise: Datasets are comprised of erroneous, missing and noisy data that comes from multiple sources. Clustering algorithms have to have the ability to deal with this kind of data with robustness.
4. Interpretability: Clustering algorithms have to produce results in such a manner that the results are usable and comprehensible.
5. Ability to deal with arbitrary shapes: Clustering techniques based on Manhattan distance and Euclidean distance measures usually produce spherical clusters[DMCT]. However, not all clusters are spherical in shape and hence we need algorithms that can help detect arbitrarily shaped clusters as well.
6. Ability to deal with different data types: Many applications require clustering of a mixture of data types like numerical, textual, categorical and hence the algorithm has to be fit to handle this mixture of data.
B. Types of Cluster Analysis Methods
Cluster Analysis may be divided into the following methods: - 1. Partitional Methods
2. Hierarchical Methods 3. Grid-Based Methods 4. Model-based Methods
III.PARTITIONAL METHODS
This is one of the most fundamental methods of cluster analysis, which partitions data into exclusive groups or clusters. In this algorithm we need to have prior information about the number of clusters and an iterative relocation technique is used to obtain an optimal solution.
A. K-Means
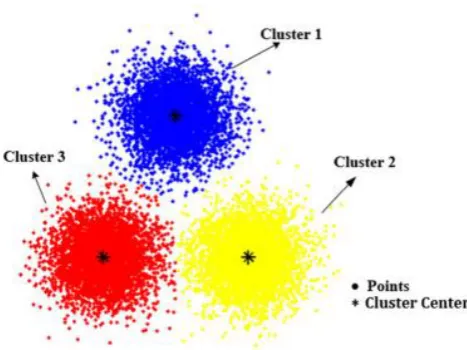
Fig. 1 A concept diagram of k-means clustering
It is called ask-means because each of the k clusters present is represented by the mean of the objects present within the clusters. It is very easy to implement this technique. It is also known as the centroid method, where the centroid of each cluster is calculated and then the points of the clusters are reallocated to the cluster whose centroid is the closest to it. It is iterative in nature, where the centroid of the clusters is recalculated and the redistribution process occurs again. This is done until there are no changes in the clusters.
This method is based on the Euclidean Distance between the object and the cluster center. The steps to perform K-Means can be given as: -
1. Select ‘k’ number of clusters 2. Calculate centroid of k clusters
3. Compute Euclidean distance of each object in the dataset from each of the centroids
4. Assign each object to the cluster that it is nearest to based on the distances calculated in the previous step. 5. Calculate centroid of each cluster again
6. Reassign the objects to clusters based on least distance if no change then go to 7 or else go to 5 7. Stop
IV.HIERARCHICAL METHODS
The hierarchical clustering method is used to organize data into a set of groups placed at different levels in order to create a hierarchy. It uses a binary tree or a dendogram to illustrate the different clusters. The root of this tree-like structure contains one cluster where all the data elements are kept together and then the leaf nodes of this tree will consist of a cluster with a single element. These levels of the tree associate themselves to the distance measure, which is used to merge the clusters.
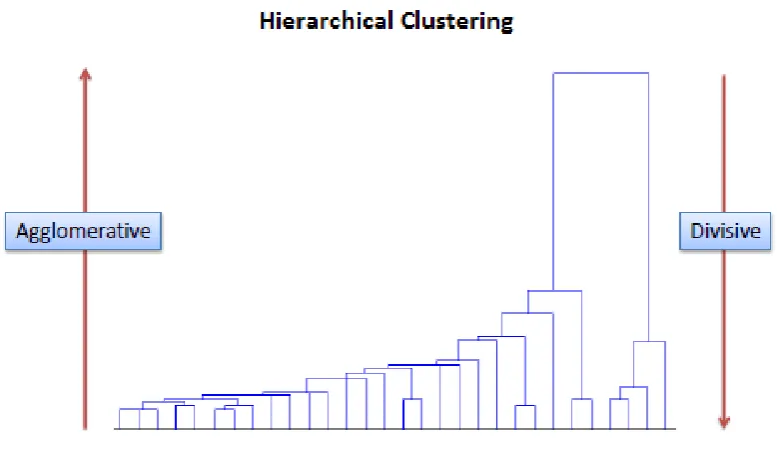
There are 2 types of hierarchical methods agglomerative approach and divisive approach. Agglomerative approach which is a bottom-up method in which each object, in the beginning, is a cluster itself and clusters nearby are merged repeatedly which result in larger clusters this is done until all the data objects get merged into a single cluster or a stopping criterion is met. Divisive approach is a top-down method in which all data elements are put into a cluster and then the approach repeatedly performs splitting of clusters until each cluster has a single object left in it or it reaches a stopping criterion.
Fig. 2 A diagrammatic representation of hierarchical clustering, agglomerative and divisive clustering
A. Agglomerative Method
The basic strategy of this method is a bottom-up strategy. The method starts with k clusters and k number of data points and each cluster contains one data item. Using distance measure at each step of this technique, two nearest clusters are merged into one forming a larger cluster and reducing the number of clusters present. This continues until the number of clusters reduces to one and that single cluster has all the k data objects present in it.
B. Divisive Method
It is the opposite of the agglomerative method and follows the top-down approach. This method starts with the entire dataset present in one cluster and continues to divide the cluster into two sub-clusters until it reaches a point where each cluster has only one object present in it.
There are 2 types of divisive methods:-
1. Monothetic:- It splits the clusters using only a single attribute at a time. 2. Polythetic:- Splits the clusters using all the attributes together.
V. DENSITY-BASED METHODS
The methods are used to find clusters of arbitrary shapes that partitioning and hierarchical methods find difficult to solve. These two methods mentioned are only used to find spherical clusters and hence a technique to solve arbitrary shapes was required.
In this method we model clusters as dense regions in data space, separated by sparse regions. It is based on the notion that for each data point in the cluster there must be a minimum criterion of data points present within the given distance. Hence, data points, which are not within the mentioned distance, are considered as noise or outliers.
Clusters can be considered as dense regions of probability density in the data sets. There are data regions that are sparsely populated and there are data regions, which are densely populated, and we wish to find those regions.
The different types of Density-Based include DBSCAN and OPTICS.
A. DBSCAN
DBSCAN stands for Density-Based on Connected Regions with High Density. In this method, two inputs are required: The size of the region given as r and the minimum points required in this region or neighbourhood given by n. The algorithm itself determines the number of clusters k, and no input is required.
establish the size of the clusters. If the size r is big enough, then we will have one huge cluster and no outliers present. If we consider a very small value of r, then we will have small and dense clusters, but many outliers present. The important concepts include:
1. Core Object: If there are n points around the neighbourhood of an the object y, then the object is known as a core object
2. Border point: The object which has points less than the density, but it still lies in the region of the core object.
3. Density: It is the count of the points of data that lie inside the given range.
4. Proximity: Two data objects x1 and x2 are considered to be in the proximity of each other if they belong to the same cluster. These objects should be within the distance r and x2 shouldbe defined as a core object. [2]
5. Connectivity:-Two objects x1 and xn are considered to be connected if there is a chain of objects defined as x1,x2….xn present between x1 and xn such that each xi+1 is in proximity of xi
This method forms clusters by linking neighbouring core objects and non-core objects that make the boundaries of clustering. The rest of the non-core objects present are considered as outliers. The input values must be chosen correctly as it may lead to either very large, limited clusters or a high number of very small clusters.
B. OPTICS
It stands for Ordering Points to Identify the Clustering Structure. In DBSCAN method ,the input parameters have to be selected properly as the method is very sensitive to the inputs .Slightly high or slightly low values might lead to very different sized clusters. This selection task hence is very difficult sometimes. OPTICS has the same idea as DBSCAN, but it can also address one of DBSCAN's major limitations: the difficulty of spotting meaningful clusters in data of varying density. [4]
VI.GRID-BASED METHODS
Grid-based method is where the data space present is quantized into a fixed number of cells which go on to form a grid-like structure and then clustering is performed on these grids. It maps the data records present in the data stream to the finite grids created. It depends on the size of the grid created rather than the data. It uses a single grid mesh to subset the entire data into cells and the data objects located within these cells are symbolized by statistical characteristics from the objects. These methods have a quick processing time, as they go through the data only once for computing the statistical values. The grid-based clustering methods include STING, Wave Cluster, and CLIQUE.
VII. RESULTS
Every clustering technique has some uncertainty in noisy data when it grouped. The performance of K-Means clustering over Hierarchical Clustering is good. K-Means algorithm creates excellence clusters when using vast data and its performance grows when the number of clusters grows. Its use is restricted to numeric principles. Hierarchical clustering is very subtle for an outlier. Therefore, Agglomerative and Divisive Hierarchical algorithms have been accepted for categorical records, but due to their difficulty a new method for conveying rank value to every categorical characteristic using K- means clustering can be used. Here categorical data is changed into numeric data.
In Hierarchical methods, when a step (combine or divided) is completed, it can never be undone. Spherically formed groups are achieved by both Partitioning and Hierarchical based clustering algorithms. Density-based clustering technique is not appropriate for datasets, which occur with great variance in density. Density-based approaches OPTICS and DBSCAN, give clusters with random sizes. DBSCAN does not have to specify the number of clusters beforehand such as K-Means clustering. DBSCAN is usually not subtle to the ordering of points in the dataset.
In Grid-Based methods like STING, summary illustration of the data in every lattice, responds to a huge class of queries, and provides parallel processing. Hence it gives fast processing.
VIII. CONCLUSION
In this paper we have given a short introduction to data mining, and also spoken about clustering and different types of clustering techniques
The general objective of the data mining process is to separate data from a huge informational collection and change it into a justifiable frame for further use. Clustering is imperative in information investigation and information mining applications.
IX.FUTURE WORK
After investigating the consequences of different clustering techniques, I have found that some clustering techniques are used for vast amounts of data, but they do not provide good results when data occurs with high variance in density, and we cannot obtain good results with these clustering algorithms. So, in the future, I will present a new clustering algorithm and try to eliminate some of these constraints.
R
EFERENCES
[1] Margaret H. Dunham and S. Sridhar, Data Mining Introductory and Advanced Topics, 2nd ed., Pearson Education(2007),pp. 1-20,119-159.
[2] Jiawei Han, Micheline Kamber, Jian Pei, Data Mining Concepts and Techniques, 3rd ed., Elsevier (2015), pp. 1-32,443-483.
[3] G.K. Gupta, Introduction to Data Mining with Case Studies, 2nd ed., Prentice Hall of India Private Limited (2008), pp. 1-18,164-200.
[4] Martin Ester, Hans-Peter Kriegel, Jörg Sander, Xiaowei Xu (1996). Evangelos Simoudis, Jiawei Han, Usama M. Fayyad, eds. A density-based algorithm for discovering clusters in large spatial databases with noise., Proceedings of the Second International Conference on Knowledge Discovery and Data Mining (KDD-96), AAAI Press, pp. 226–231.
[5] Vivek Kumar Sharma and Nisha Vasudeva,A Review on Clustering Technique,International Journal on Recent and Innovation Trends in Computing and Communication Volume: 3 Issue: 3, ISSN: 2321-8169 [6] Ahalya G. , Hari Mohan Pandey,Data Clustering Approaches Survey and Analysis, 2015 1st International