University of South Carolina
Scholar Commons
Theses and Dissertations
2018
Evaluative Conditioning Of Product Preferences:
An Eye-Tracking Perspective
Christine E. Weber
University of South Carolina
Follow this and additional works at:https://scholarcommons.sc.edu/etd
Part of theExperimental Analysis of Behavior Commons
This Open Access Thesis is brought to you by Scholar Commons. It has been accepted for inclusion in Theses and Dissertations by an authorized administrator of Scholar Commons. For more information, please [email protected].
Recommended Citation
Weber, C. E.(2018).Evaluative Conditioning Of Product Preferences: An Eye-Tracking Perspective.(Master's thesis). Retrieved from
E
VALUATIVEC
ONDITIONING OFP
RODUCTP
REFERENCES:
A
NE
YE-T
RACKINGP
ERSPECTIVEby
Christine E. Weber
Bachelor of Science
Eastern Connecticut State University, 2015
Submitted in Partial Fulfillment of the Requirements
For the Degree of Master of Arts in
Experimental Psychology
College of Arts and Sciences
University of South Carolina
2018
Accepted by:
Douglas H. Wedell, Director of Thesis
Svetlana V. Shinkareva, Reader
Amit Almor, Reader
ACKNOWLEDGEMENTS
I would first like to express my appreciation and gratitude for my advisor, Dr.
Douglas H. Wedell, who has been my constant mentor and guide throughout my graduate
career. I would also like to thank my other committee members, Dr. Svetlana V. Shinkareva
and Dr. Amit Almor, who have given me the benefit of their knowledge, experience, and
support. I thank Chuanji Gao and the other members of my lab for their assistance with
study design, data collection, and analysis. I’d also like to thank Marcus Johnson from SR
Research for his programming help. I thank the Presidential Fellowship for financial
support during this work.
Thank you to my family and my boyfriend, Jeffrey Vahlstrom, for their perpetual
ABSTRACT
In evaluative conditioning, the affective response toward a neutral stimulus is
altered by pairing it with a positive or negative stimulus. One behavioral and two eye
tracking studies were conducted to investigate how evaluative conditioning operates on
consumer preferences by pairing neutral products with valenced music and using multiple
product exemplars and test trials in order to test evaluative effects at the individual level.
Study 1 showed an overall positive effect of evaluative conditioning on choice and liking
ratings, although there were individual differences in the magnitude and direction of the
effect. Study 2 found significant results at the individual level, resulting in three groups
based on preferences in choice. Consistent with inferred group differences in conditioning,
those who showed positive conditioning effects looked longer and more often at the
positively paired products and those with negative conditioning effects showed the
opposite pattern. Additionally, valence condition was decodable from the overall pattern
of eye movements during conditioning for the majority of participants. Study 3 included
product attribute information during testing and found that more time was spent looking at
attributes of negatively paired products. Study 3 also showed the same group by valence
interaction for looking time and number of looks as in Study 2. Across the three studies,
conditioning produced the predicted effects for approximately 42% of participants, effects
in the opposite direction for 24%, and no significant effects for 33%. These results indicate
TABLE OF CONTENTS
Acknowledgements ... iii
Abstract ... iv
List of Figures ... vi
Chapter 1: Introduction ...1
Chapter 2: Study 1 - Behavioral Study of Conditioned Product Preferences ...6
Chapter 3: Study 2 - Eye Movements toward Products during Induction and Testing ...13
Chapter 4: Study 3 - Looking Behavior toward Attributes of Conditioned Products ...28
Chapter 5: General Discussion...46
LIST OF FIGURES
Figure 2.1 Representation of paired choice test phase in Study 1 ...9
Figure 2.2 Distribution of behavioral results for paired choice in Study 1...11
Figure 3.1 Distribution of behavioral results for paired choice in Study 2...17
Figure 3.2 Total looking time for product pictures during paired choice in Study 2 ...20
Figure 3.3 Total fixations for product pictures during paired choice in Study 2 ...22
Figure 4.1 Representation of paired choice test phase in Study 3 ...30
Figure 4.2 Distribution of behavioral results for paired choice in Study 3...32
Figure 4.3 Total looking time for product pictures during paired choice in Study 3 ...35
Figure 4.4 Total fixations for product pictures during paired choice in Study 3 ...36
Figure 4.5 Total looking time for product attributes during paired choice in Study 3 ...40
CHAPTER
1
INTRODUCTION
The mutability of product preferences has been investigated in experimental
psychology and marketing research for decades (De Houwer, Thomas & Baeyens, 2001;
Hofmann, De Houwer, Perugini, Baeyens, & Crombez, 2010; Martin & Levey, 1978).
There is a comprehensive body of literature demonstrating that people’s attitudes toward
and subjective judgments of consumer products can be influenced by the contexts in which
they encounter those products. These effects are often the basis for commercial
advertisements, in which products are often paired with positive stimuli. Many studies
have shown that pairing products with stimuli such as celebrities and popular music can
shift people’s attitudes toward those products in the positive direction (Gorn, 1982;
Krishna, 2012; Redker & Gibson, 2009; Schemer, Matthes, Wirth, & Textor, 2008; Till,
Stanley, & Priluck, 2008; Vermeulen & Beukeboom, 2016).
In evaluative conditioning, the affective response toward a neutral stimulus is
altered by pairing it with a positive or negative valenced stimulus (De Houwer et al., 2001;
Martin & Levey, 1978). Typically, pairing with a positive unconditioned stimulus leads to
a positive evaluation of the conditioned stimulus, and pairing with a negative
unconditioned stimulus has the opposite effect. We use positive and negative
unconditioned music stimuli paired with neutral consumer product stimuli to alter
evaluations of the products. The aims of the current set of studies were threefold. First, to
sensitive to individual differences. Second, to determine whether eye movements during
conditioning and during testing relate to conditioned valence and preferences. Third, to test
the effects of presenting positive and negative related attribute information along with the
conditioned stimuli during testing.
After first establishing the effects of evaluative conditioning in a behavioral study,
we used the same paradigm in two eye tracking studies. Eye tracking provides online
measures reflecting cognitive activity (Kaspar et al., 2013; Shinkareva et al., 2014). These
detailed process measures may allow for greater differentiation between theoretical
explanations of evaluative conditioning effects. In the literature, two competing theories of
evaluative conditioning are dominant: an associative account and a propositional account
(Gawronski & Bodenhausen, 2006). One instantiation of the associative explanation is the
conceptual-categorization account, in which pairing a neutral stimulus with a positive
stimulus increases the saliency of the positive features of the neutral stimulus, resulting in
a more positive reevaluation of the neutral stimulus (and in a parallel manner for negative
features of neutral stimuli paired with negative stimuli; De Houwer et al., 2001). We
specifically test one version of this associative account in Study 3, by measuring looking
time spent on affectively congruent and incongruent attribute information presented with
the products during testing. Eye tracking measures were also used to gain insight into the
effects of the evaluative conditioning of product preferences on corresponding patterns of
looking behaviors. We hope to use these measures to better understand the nature of
evaluative conditioning and the choice process. Based on prior research concerning looking
and preference (Wedell & Senter, 1997), we predict that evaluative conditioning will result
changes the weighting of positive and negative features subsequently presented with the
products using looking times as a measure of weight (Wedell & Senter, 1997).
Traditionally, many evaluative conditioning procedures have used static visual
stimuli, such as words and pictures (for a review see Hofmann et al., 2010). Others have
combined static and dynamic stimuli; for example, one study paired instrumental county
music with visual information about brands (Redker & Gibson, 2009). Effect sizes appear
to be similar when the neutral and affect-inducing stimuli are from either the same or
different modalities (Hofmann et al., 2010). In our evaluative conditioning paradigm, we
chose to use dynamic stimuli such as music because they are more naturalistic and likely
produce effects that are more generalizable to real life experience. Music in particular is
well-known for inducing affective states (Juslin & Vastfjall, 2008), and effect sizes appear
to be slightly higher when the unconditioned stimulus is auditory rather than visual
(Hofmann et al., 2010). The product-music pairings in this paradigm resemble television
commercials, in which advertisers present a product consumers may feel relatively neutral
about with a positively valenced stimulus, such as an upbeat pop song. Rather than select
music for the unconditioned stimulus based on liking or disliking, we selected music based
on its ability to evoke a positive or negative affective state. We examined these affective
states in terms of the theory of core affect (Russell & Barrett, 1999), in which affective
responses are measured along two dimensions: valence, which ranges from positive to
negative, and arousal, from low to high. In our evaluative conditioning paradigm we
wished to isolate the effects of valence from potential effects of arousal. Therefore we
selected musical pieces that evoked consistent positive or negative affective reactions while
We paired these valenced musical pieces with pictures of neutrally liked products
to investigate whether preferences for the products would be influenced in the direction of
the music valence. In past research, changes in participants’ product evaluations have been
measured with Likert-type scales of liking, preference, or affective response, with
choice-based measures, and with implicit measures of attitude change (Jones et al., 2010). In the
current studies, we utilized both a Likert-type liking scale and a paired choice procedure in
assessing the effects of the conditioning. We hypothesized that products paired with
positive music would be rated higher on the liking scale than products paired with negative
music. We also hypothesized that products paired with positive music would be chosen
more often in paired choice than products paired with negative music.
Studies 2 and 3 used eye tracking to test effects of evaluative conditioning on
looking behavior. Previous research has found that specific features of looking behavior,
including fixation duration, saccade amplitude, and pupil size, differ between different
affective or cognitive states (e.g. Borji & Itti, 2014, Kaspar et al., 2013; Partala & Surakka,
2002; Võ et al., 2008). We hypothesized that eye movement measures would reflect both
participants’ preferences and the paired valence condition. More specifically, we predicted
that positively conditioned products would receive greater visual attention than negatively
conditioned products, as measured by the total number of looks and total looking time
given to these products. Similarly, we predicted that preferred products would be looked
at more than non-preferred products. These two hypotheses are largely overlapping, given
that the evaluative conditioning procedure should result in the positively conditioned
products being preferred. Additionally, we hypothesized that the overall pattern of eye
and product preferences, and that these could be decoded from the pattern of eye
movements using multivariate techniques (Henderson, Shinkareva, Wang, Luke, &
CHAPTER 2
STUDY 1 - BEHAVIORAL STUDY OF CONDITIONED PRODUCT
PREFERENCES
In this behavioral study, pictures of consumer products were paired with positive
and negative affective music. The primary purpose of this first study was to establish
whether evaluative conditioning effects would occur using repeated short pairings of
consumer products and affectively charged music. We hypothesized products paired with
positive music during induction would be chosen more often in the paired choice phase,
and rated more highly in the post-induction rating phase, compared to products paired with
negative music. These effects would be in line with previous research demonstrating shifts
in product preferences as a result of paired music (e.g. Gorn 1982, Redker & Gibson, 2009).
However, this study differs slightly from previous research in that the unconditioned music
stimuli were selected for conditions on the basis of their affective properties, rather than
on their status as liked or preferred. Unlike most previous studies, we investigated whether
product preferences could be conditioned by pairing the products with stimuli that elicit an
emotional state, but may be similar in their liking.
We used multiple product exemplars and many test trials to examine individual
differences in the magnitude and direction of the effects. In our previous unpublished work
testing effects on affective states, we have found clear individual differences in the effect
current study tests whether similar individual differences are found when examining effects
on choice and liking ratings.
2.1 METHOD
Participants
There were 46 (33 female) participants. Participants were undergraduates who
voluntarily participated for extra credit in college courses, after signing up for the study
using an online participant pool and giving written informed consent.
Materials
All experimental stimuli were presented using E-Prime 2.0. The neutral stimuli
consisted of 60 pictures of products obtained from the “Bed, Bath, and Beyond” company
website. There were 12 product pictures in each of five categories: dinnerware sets, floor
lamps, portable speakers, throw pillows, and water bottles. Products within a category
differed primarily by color and pattern. These products were selected based on ratings from
a pre-pilot study with 9 participants, where participants rated how much they liked each
product on a 9-point scale.
The affectively charged unconditioned stimuli were music clips. In an extensive
series of norming studies, short four second samples of classical music and four second
silent video clips were evaluated along two affective dimensions using a 9×9 grid, where
the horizontal axis represented valence from negative to positive, and the vertical axis
represented arousal from low to high. From this sample, we selected 10 highly positive and
Procedure
The procedure consisted of four phases: pre-induction rating, induction, paired
choice, and post-induction rating. There were no time limits for behavioral responses in
any phase. During the pre-induction rating phase, participants indicated how much they
liked each product on a Likert-type scale, from 1 (Dislike Very Much) to 9 (Like Very
Much). The products were blocked by category, and the order of the products within each
block as well as the order of the blocks were randomized. These ratings were used to select
the products that would be carried forward into the induction phase to be paired with music.
Two pairs of products from each category were selected, by choosing pairs of products that
were closely matched in liking and were not extremely liked or disliked, with ratings close
to 5 on the 9-point scale. The most neutral, closely-matched products were selected from
the full set to maximize the ability of the affective music to influence the evaluations of the
products.
In the induction phase, these twenty selected products (four products in each of five
categories) were paired with music, so that within each pair of similarly rated products,
one was paired with positive music while the other was paired with negative music. Each
picture was displayed for four seconds along with the music. The presentation of each
product was repeated 10 times, for a total of 200 trials. Following each presentation,
participants rated their emotional state on one of 10 emotional scales.
In the paired choice phase, participants were presented with each product pair and
asked to select the product they preferred by clicking on it using the mouse (Figure 2.1).
Each pair was presented eight times, with the positively paired product on the left side of
products within each product category, and therefore four cross-valence pairs per category,
resulting in 32 trials per category and 160 trials total.
The post-induction rating phase was identical to the pre-induction rating phase.
Participants rated all 60 products again, including those that had and had not been paired
with music in the induction phase.
2.2 RESULTS
A one-sample t-test was conducted to determine if the proportion of times
positively paired products were chosen was significantly different from chance level (0.5).
The proportions were transformed using an arcsine square root transformation, to correct
for changes in variance as proportions approach one and zero. The proportion was
significantly greater than chance, t(45) = 3.87, p < .001. The products that had been paired
with positive music were chosen 59.6% of the time. Additional one-sample t-tests were
above chance level for all product categories. Binomial tests were conducted to determine
if each participant’s choices differed significantly from chance: 25 participants chose
positively paired products significantly more often, while 11 participants chose negatively
paired products significantly more often, and 10 participants showed no significant
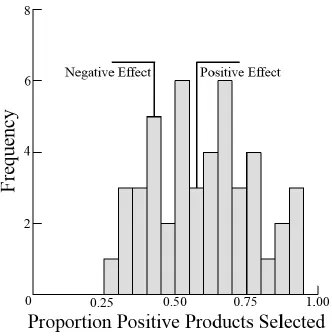
difference (see Figure 2.2).
To test the effect of the evaluative conditioning on product ratings, a
repeated-measures ANOVA was conducted to determine the effect of the paired music valence and
the product category on the change in ratings from before to after induction. Pre-induction
product ratings were subtracted from post-induction product ratings to calculate the change
scores. The valence of the paired music had a significant effect, F(1,45) = 12.41, p < .001.
There was also a significant effect of product category, F(4,180) = 3.03, p < .05, but the
valence × product category interaction was not significant, F(4,180) = 1.49, p > .05.
Additional ANOVAs showed that there was a significant change in the ratings depending
on paired music valence for only the portable speaker category, but not for the dinnerware,
floor lamps, throw pillows, or water bottles. Additional analyses were conducted for each
participant; there were six participants who showed a significant effect of paired music
valence at the individual level (ps < .05), and two additional participants who showed a
marginally significant effect (ps < .10). There was a high correlation (r = .85, p < .001)
between the paired choice results and the rating change results across participants,
indicating that the effects of the evaluative conditioning appear to be consistent across these
2.3 DISCUSSION
These results demonstrate that both preferences and ratings of products were
successfully manipulated by pairing the products with positive or negative affective music
during the induction phase. Participants were more likely to state that they preferred the
products that had been paired with positive music. They also rated positively paired
products more positively than negatively paired products.
Given the large number of trials in the paired choice phase, we were able to test the
effects of the conditioning at the individual level. The analyses conducted for each
participant showed that some individuals displayed significant effects, while others did not.
While many participants showed effects in the expected direction, some participants
showed opposite effects, selecting the negatively paired products more often. This
variability in the direction of the effect demonstrates that not all participants respond to the
evaluative conditioning procedure in a consistent fashion. Given the success of the
evaluative conditioning procedure in producing effects in this consumer choice paradigm,
it was possible to further investigate these effects to determine their underlying
mechanisms in the next studies. In Studies 2 and 3, we use eye tracking to examine how
eye movements toward the positively and negatively conditioned product pictures differ
CHAPTER 3
STUDY 2 - EYE MOVEMENTS TOWARD PRODUCTS DURING
INDUCTION AND TESTING
Study 2 extends this paradigm into an eye tracking study. Eye movements were
measured during the evaluative conditioning and subsequent testing of consumer products
using the same materials as Study 1. Eye tracking provides online measures that may help
distinguish the processes underlying evaluative conditioning. In addition, using this
paradigm in an eye tracking study may allow us to further explore the previously observed
individual differences.
Behaviorally, it was hypothesized that products paired with positive music in
induction would be selected more frequently and receive higher post-induction ratings than
products paired with negative music. In addition to replicating the evaluative conditioning
results for the overall group found in Study 1, we expected to replicate the individual
differences with some participants showing the opposite effect.
The hypotheses for eye movements focused primarily on the paired choice test
phase, where the positively and negatively conditioned products were presented
simultaneously. In this phase, it was hypothesized that product images that were paired
with positive music would be looked at for a longer duration and more frequently than
products that were paired with negative music. Previous work has shown that people tend
to look longer at preferred objects (Chandon, Hutchinson, Bradlow, & Young, 2009; van
positive and negative stimuli (Kaspar et al., 2013; Simola, Le Fevre, Torniainen, &
Baccino, 2015). If a similar pattern of individual differences is observed as in Study 1,
however, any participants who significantly prefer the negatively conditioned products
may instead look longer and more often at those products they prefer. It was hypothesized
that preferred products would be looked at more than non-preferred products, regardless of
whether behavioral effects are in the expected or opposite direction.
Several studies have examined looking behaviors in paradigms with similar
contexts. Previous research has shown that eye movement measures differ between
different affective contexts and cognitive states (Borji & Itti, 2014; Henderson et al., 2013;
Kaspar et al., 2013; Lemonnier, Brémond, & Baccino, 2014, Pannasch, Helmert, Roth,
Herbold, & Walter, 2008, Partala & Surakka, 2002; Simola et al., 2015). For example,
differences in saccade amplitude and fixation duration have been found when viewing
pictures associated with different discrete emotions, such as fear, as well as for negative
and positive affective pictures (Kaspar et al., 2013; Pannasch et al., 2008; Simola et al.,
2015). Previous research has also shown that it is possible to decode some cognitive states
from eye movements (Henderson et al., 2013). We predicted that valence condition during
induction could be decoded from the pattern of eye movements. We also predicted that
preferences, categorized based on paired choice behavioral results, could be decoded. If
there are consistent eye movements associated with valence that generalize across
participants, we would expected to find these in a cross-participation prediction paradigm.
If affect-based eye movements are idiosyncratic, then we may predict valence within
This eye tracking study will aid in illuminating the cognitive mechanisms that may
explain the effects of evaluative conditioning within a consumer choice paradigm.
Differences in specific looking measures such as fixation duration and frequency were
expected to be found between valence conditions. In addition, individual differences in
evaluative conditioning effects were further explored. This study is innovative in its use of
eye tracking within a multimodal evaluative conditioning paradigm.
3.1 METHOD
Participants
There were 41 participants, 9 male and 32 female. As in the behavioral study,
participants were undergraduate students who participated for extra credit in college
courses, after signing up for the study using an online participant pool and giving written
informed consent.
Materials and Procedure
Materials were identical to those used in the behavioral study. There were 60
product pictures, 10 positive music clips, and 10 negative music clips. The procedure was
also very similar. The experiment comprised four phases: pre-induction rating, induction,
paired choice, and post-induction rating. All phases proceeded in the same manner as
before, with the exception of the induction phase. During induction, participants’ task was
to answer simple yes or no question about perceptual and semantic features of the product
pictures. These questions asked them to identify whether or not they saw a particular
feature in the picture. Features included red, blue, green, yellow, ceramic, metal, fabric,
and curves. Each product-music pairing was presented 8 times, each followed by a different
affective task to ensure that the behavioral effects observed in Study 1 were not limited to
a paradigm in which participants are explicitly asked to consider their affective state during
conditioning.
All phases of the study were conducted using an SR Research Eyelink 1000 eye
tracker device, and the experimental program was run in Experiment Builder. Participants
viewed stimuli on a 19” CRT monitor using a resolution of 1024 × 768, and were seated
approximately 24” from the screen. Product stimuli were displayed at 478 × 478 pixels
(including a minimal white border) on a white background, subtending approximately
15.65° by 15.72° of visual angle. Participants’ placed their heads in a frame with chin and
forehead rests in order to minimize head movement. Only the right eye was tracked. In
each phase, the areas of interest were the product images.
3.2 RESULTS
Behavioral Results
A one-sample t-test was conducted to determine if the proportion of times products
that had been positively paired were chosen was significantly different from chance level.
The proportions were transformed using an arcsine square root transformation. The
difference was not significant, t(40) = 1.305, p = .20. The products that had been paired
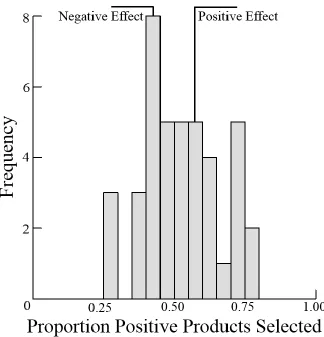
with positive music were chosen 52.2% of the time. Binomial tests were conducted to
evaluative significance at the individual participant level; 16 participants chose positively
paired products significantly more often, while 12 participants chose negatively paired
products significantly more often, and 13 participants showed no significant effect.
Consistent with the results of the behavioral study, these findings indicate that there are
3.1). Due to these individual differences, remaining analyses are reported both for the full
sample of participants, as well as separately for each group of participants based on their
behavioral results in the paired choice test phase: those who showed significant positive
effects, those who showed significant negative effects, and those who showed no effects.
For the subset of participants who showed positive effects, the products that had been
paired with positive music were chosen 66.2% of the time. For those who showed
significant negative effects, that products that had been paired with negative music were
chosen 63.1% of the time.
To test the effect of the evaluative conditioning on product ratings, a
repeated-measures ANOVA was conducted to determine the effects of the paired music valence and
the product category on the change in ratings from before and after induction. A three-way
repeated-measures ANOVA with factors valence × product category × participant group
was conducted on the change in product ratings from the pre-induction ratings to the
post-induction ratings. For all analyses, the primary focus is on valence and participant group,
as product category is not of particular interest in determining the effects of the evaluative
conditioning. The only significant effect in this analysis was a valence × group interaction,
F(2,38) = 10.50, p < .001. There was no main effect of valence, F(1,38) = 2.91, p = .10,
and no main effect of group, F(2,38) = 0.216, p = .807. The main effect of product category
and its interactions were not significant, ps > .10.
For the subset of participants with significant positive effects in the paired choice
phase, a two-way repeated-measures ANOVA with factors valence × product category
showed a significant effect of valence, F(1,15) = 21.40, p < .001. Ratings for positively
paired products increased by an average of 0.73 points on the 9-point scale, while ratings
for negatively paired products decreased by 0.19 points. There was also a significant
valence × product category interaction, F(4, 68) = 2.565, p < .05. A parallel ANOVA
conducted for the subset of participants with significant negative effects showed the effect
of valence did not reach significance, F(1,11) = 1.645, p = .23. For this group, ratings of
positively paired products decreased by 0.03 points, and ratings of negatively paired
products increased by 0.27 points. The effect of valence in an ANOVA for the group of
p = .928. There was no difference in the change in ratings for positively paired (+0.24) and
negatively paired (+0.25) products.
Additional analyses were conducted for each participant; there were five
participants who showed a significant effect of paired music valence at the individual level,
three in the positive effects group and two in the negative effects group. However, this was
not a particularly powerful test compared to the paired choice analyses, as these rating
results are based on only 20 trials in each phase. As in the behavioral study, there was a
high correlation (r = 0.72, p < .001) between the paired choice results and the rating change
results across participants, indicating that the effects of evaluative conditioning are
consistent across these two test phases.
Eye Tracking Results
Several three-way repeated-measures ANOVAs were conducted on eye movement
measures during the paired choice phase. A valence × product category × participant group
repeated-measures ANOVA was conducted on total fixation durations on the product
pictures during paired choice. There was a significant valence × group interaction, F(2, 38)
= 16.13, p < .001 (Figure 3.2). The positive effects group spent longer looking at the
positively conditioned product (M = 411.26) than at the negatively conditioned product (M
= 314.54), whereas the negative effects group spent longer looking at the negatively
conditioned product (M = 453.03) than the positively conditioned product (M = 374.17).
There was also a main effect of product category, F(4, 152) = 30.73, p < .001, although
this effect is not of primary interest. Bonferroni-corrected pairwise comparisons showed
that lamps (M = 480.44) were looked at significantly longer than dinnerware (M = 361.09),
water bottles (M = 436.88), p = .09. Water bottles were looked at significantly longer than
dinnerware, speakers, or throw pillows, ps < .01. There was no main effect of valence, F(1,
38) = 0.08, p = .78, or participant group, F(2, 38) = 1.09, p = .35. The other interactions
were not significant, ps > .10.
As in the behavioral results, two-way ANOVAs were conducted to examine the
effects of valence and category within each participant group. For the subset of participants Figure 3.2 Total looking time for product pictures during paired
who showed positive behavioral effects, a two-way repeated-measures ANOVA revealed
a significant main effect of valence, F(1, 15) = 22.27, p < .001, with positively paired
products being looked at significantly longer than negatively paired products, as above.
There was also a main effect of product category, F(4, 60) = 17.33, p < .001. The
valence × category interaction was not significant, p > .10. Another two-way ANOVA was
conducted for the subset of participants who showed negative behavioral effects. There
was a significant main effect of valence in the opposite direction, F(1, 11) = 6.08, p < .05,
with negatively paired products being looked at significantly longer than positively paired
products. As in the positive effects group, the main effect of product category was
significant, F(4, 44) = 8.58, p < .001, and the valence × category interaction was not. For
the group of participants who did not show behavioral effects, the ANOVA showed only a
significant main effect of product category, F(4, 48) = 9.02, p < .001.
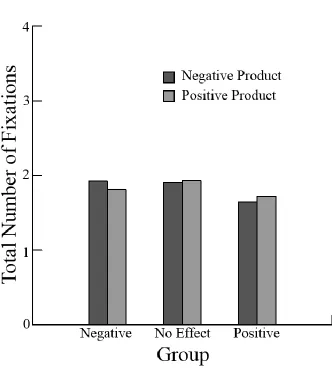
A second, parallel ANOVA with the same factors was conducted on total number of
fixations on the product pictures during paired choice. There was a significant valence ×
group interaction, F(2, 38) = 4.69, p < .05 (Figure 3.3). The positive effects group looked
more often at the positive product (M = 1.72) than at the negative product (M = 1.65),
whereas the negative effects group looked more often at the negative product (M = 1.92)
than the positive product (M = 1.81). There was also a main effect of product category,
F(4, 152) = 24.48, p < .001. Bonferroni-corrected pairwise comparisons showed that lamps
(M = 2.10) were looked at significantly more often than dinnerware (M = 1.72), speakers
(M = 1.74), throw pillows (M = 1.61), or water bottles (M = 1.88), ps < .01. Water bottles
were looked at significantly more often than throw pillows, p < .001, and marginally more
= 0.08, p = .78, or participant group, F(2, 38) = 1.09, p = .35. The other interactions were
not significant, ps > .10.
A two-way repeated-measures ANOVA was conducted for the subset of
participants who showed positive behavioral effects. The main effect of valence did not Figure 3.3. Total fixations for product pictures during paired choice
reach significance, F(1, 15) = 2.43, p = .14. There was a main effect of product category,
F(4, 60) = 10.96, p < .001. The valence × category interaction was not significant, p > .10.
A parallel ANOVA was conducted for the subset of participants who showed negative
behavioral effects. The main effect of valence again did not quite reach significance, F(1,
11) = 3.97, p = .07. There was a main effect of product category, F(4, 44) = 5.97, p < .001,
and the valence × category interaction was not significant, p = .09. Although none of the
groups differed significantly, the linear component of the interaction was significant
F(1,26) = 6.63, p < .05, and reflected the differences in fixations for positive and negative
products across the positive and negative groups. For the group of participants who did not
show significant behavioral effects, the ANOVA showed only a significant main effect of
product category, F(4, 48) = 10.03, p < .001.
We also examined whether participants were likely to look at the positively paired
picture before looking at the negatively paired picture. We calculated the total number of
trials the positive picture was looked at before the negative picture, and the total number
of trials the negative picture was looked at before the positive picture. A third three-way
repeated-measures ANOVA with factors valence × product category × participant group
was conducted on the number of trials participants looked at the picture first. The valence
× participant group interaction was not significant, F(1, 38) = 1.53, p = .23, nor was the
main effect of valence, F(1, 38) = 0.11, p = .74. The only significant effect was a main
effect of product category, F(4, 152) = 6.35, p < .001. Bonferroni-corrected pairwise
comparisons indicated that regardless of valence, pictures of throw pillows (M = 15.05)
received fewer fixations than those of lamps (M = 15.59) or water bottles (M = 15.50), ps
A final three-way ANOVA was conducted on mean pupil size, which is measured
in arbitrary units on an integer scale. The valence × participant group interaction did not
reach significance, F(2, 38) = 2.63, p = .09, and there was no main effect of valence, F(1,
38) = 0.00, p = .95, or of group, F(2, 38) = 1.09, p = .35. There was no significant difference
in mean pupil size between the positive and negative pictures for the positive effects group
(MPos = 915.20, MNeg = 908.03) or for the negative effects group (MPos = 1043.56, MNeg =
1046.94). Similar to the previous analysis, there was a main effect of product category,
with mean pupil sizes significantly smaller for floor lamps (M = 931.59) than for
dinnerware (M = 971.06), speakers (M = 975.55), throw pillows (M = 980.28), or water
bottles (M = 957.86), ps < .001; no other comparisons were significant.
Multivariate pattern analyses (MVPA) were also conducted to determine whether
product valence or preference could be decoded using eye movement measures during the
160 induction trials. In each analysis, we trained a linear support vector machine (SVM)
classifier on ten eye movement features: mean and standard deviation of fixation duration,
mean and standard deviation of saccade length, number of fixations, mean pupil size, and
mean and standard deviation of fixation X coordinate and fixation Y coordinate. In all
MVPA analyses, mean pupil size was detrended and fixations shorter than 50 ms were
removed. Permutation testing was conducted to determine significance. Valence labels for
each trial were shuffled and the classification was run 1000 times. The critical value for
significance was determined by finding the 950th value in the resulting distribution of 1000
accuracies. This procedure was repeated for each individual participant. The maximum
First, we attempted to decode picture valence during induction using the ten
features. Repetition-wise classification was performed, with the model trained on data from
seven repetitions (140 trials) and tested on one repetition (20 trials), using 8-fold
cross-validation. Valence was decoded within each product category in order to account for
differences in looking behavior between categories, and then the average accuracy across
the five categories was calculated for each fold. The overall mean classification accuracy
across 41 participants was 60.93%, with a range of 46.25% to 73.75%. From the
permutation testing, the maximum critical value was determined to be 59.38%. 26
participants (63%) had accuracies greater than this value. The standardized weights for
each feature were highly variable across participants. Averaging across the absolute values
of the weights for the 26 participants for whom the classification was successful, mean Y
coordinate (M = 0.31), standard deviation of Y coordinate (M = 0.24), and mean saccade
amplitude (M = 0.23) had the highest weights.
Second, we attempted to decode valence across participants, using leave-one-out
cross-validation by training the model on all but one participant. This MVPA was not
successful; mean classification accuracy was 49.65, with a range of 40.63% to 56.87%.
Third, we attempted to decode preference using the ten features, parallel to the first
MVPA. Product pictures were categorized as preferred or non-preferred based on the
behavioral paired choice results. Products that were chosen more than 50% of the time
were categorized as preferred, while products chosen less than 50% of the time were
categorized as non-preferred. Products which were chosen exactly 50% of the time were
excluded from the analysis. Because of these exclusions, there were fewer than 160 trials
number of preferred vs. non-preferred products were not balanced for each participant.
Therefore, rather than using the maximum critical value for all participants, individual
critical values were used to assess significance at the individual level. This analysis resulted
in classification accuracies significantly above chance for 10 participants, or approximately
one quarter of the sample.
3.3 DISCUSSION
Behaviorally, we found a similar pattern of individual differences as in the previous
study. 39% of participants significantly preferred the positively conditioned products in
paired choice, while 29% significantly preferred the negatively conditioned products, and
the rest showed no significant behavioral effects. The group that showed positive effects
during paired choice also rated the positively conditioned products higher, while the
negative effects group rated the negatively conditioned products higher, although this latter
effect did not reach significance.
By using eye tracking, we were able to observe a correspondence between
participants’ behavioral responses to the evaluative conditioning procedure and their eye
movements. In general, the products preferred by each group received longer and more
frequent fixations. These results support the hypothesis that preferred products would be
looked at more than non-preferred products, regardless of whether behavioral effects are
in the expected or opposite direction. Using MVPA, we were also able to predict valence
condition during induction based solely on eye movements during each trial for more than
half of the participants, showing clear effects of the conditioning paradigm on looking
behavior. Preference was also successfully decoded for approximately one quarter of the
from eye movements (Borji & Itti, 2014; Henderson et al., 2013; Kaspar et al., 2013;
Lemonnier, Brémond, & Baccino, 2014, Pannasch et al., 2008).
The weights from the classification model for decoding valence indicate that the
average and standard deviation of the location of fixations on the Y-axis, as well as the
average saccade amplitude, were most useful in discriminating between valence
conditions. The significance of these features has also been reported in past research.
Saccade amplitude has previously been reported to differ when viewing positively or
negatively primed images (Kaspar et al., 2013), or when viewing images associated with
different discrete emotion categories, such as fear or disgust (Pannasch et al., 2008).
Looking behavior related to the variability of the Y coordinate of fixations has also been
related to emotion condition; one study found a greater spatial spread in fixations in a
positive condition than in a negative condition (Kaspar et al., 2013). However, because the
magnitude of the weights differed greatly between participants, caution should be used in
making interpretations.
Study 2 replicated the pattern of individual differences observed in Study 1.
However, the underlying reason for these individual differences is unclear from these two
studies. One possible explanation is that the positive effects group and the negative effects
group attend to different features of the products. In addition, the mechanisms underlying
the evaluative conditioning effects are also not evident from Studies 1 and 2. We explore
CHAPTER 4
STUDY 3 - LOOKING BEHAVIOR TOWARD ATTRIBUTES OF
CONDITIONED PRODUCTS
In Studies 1 and 2, we observed strong individual differences in the response to the
evaluative conditioning. Some participants preferred the products paired with positive
music, while others preferred the products paired with negative music. In Study 3, we test
whether these groups may attend to different features of the products, and whether attention
to different features may be the mechanism underlying our effects.
The conceptual-categorization model of evaluative conditioning proposes that the
conditioning procedure influences the attention given to positive and negative features of
neutral stimuli (Davey, 1994; De Houwer et al., 2001; Field & Davey, 1999; Kattner &
Ellermeier, 2011). It hypothesizes neutral stimuli may contain both positive and negative
features, and that pairing a neutral stimulus with a positive stimulus makes positive features
of the neutral stimulus more salient, while pairing a neutral stimulus with a negative
stimulus makes negative features more salient. In order to consider the relevance of this
model for our data, we added “features” to the products during their presentation in their
paired choice phase. As in Studies 1 and 2, a positively paired and a negatively paired
product were presented side by side, and the participant was asked to choose which product
they prefer. In Study 3, we added product attribute ratings ranging from one star to five
stars on each of four attributes underneath each product picture. For each product, two
We hypothesized that participants would spend more time looking at the attributes
congruent with the valence condition of each picture (positive attributes of the positively
paired product and negative attributes of the negatively paired product). We also
hypothesized that there may be group differences in these effects, and that the negative
effects group may attend more to the incongruent attributes (e.g. positive attributes for
negatively paired products). Observing these effects would help illuminate whether
attentional shifts serve as an underlying mechanism for the evaluative conditioning, and
whether differences in attention discriminate groups with opposite behavioral responses.
4.1 METHOD
Participants
37 undergraduates (4 male, 33 female) participated in this experiment. Participants
were recruited for the study using the same online participant pool as in the previous
experiments, gave written informed consent, and received extra credit for their
participation.
Materials and Procedure
As in the previous two studies, we used 60 product pictures, 10 positive music clips,
and 10 negative music clips. The procedure was very similar to the first eye tracking
experiment. There were four phases: pre-induction rating, induction, paired choice, and
post-induction rating. Participants’ completed the perceptual and semantic feature task
during induction.
The paired choice phase was altered to include attribute information for the
products (Figure 4.1). Each product was presented with ratings on four attributes:
to five stars. For each product, two of these attributes were positive (four or five stars), and
two attributes were negative (one or two stars).There was always a three-star difference
between the ratings given for a particular attribute between the two products presented in
a pair. For example, if the positively paired product had a two-star rating for Ease of Use,
then the negatively paired product had a five-star Ease of Use rating. Across all four
attributes, there were always a total of 12 stars for each product. The ratings given for a
product changed with each presentation. The ratings were randomized and balanced across
each product and each presentation, so that each product had a particular rating on each
attribute an equal number of times
In each phase, the product images were the areas of interest. In the paired choice
phase, the two sets of attributes, as well as the attribute labels, were additional areas of Figure 4.1 Representation of the paired choice test phase in Study
interest. Thus in this phase, there were a total of 14 interest areas: the two product images,
the four attribute labels, and the four attribute ratings for each of the two pictures.
4.2 RESULTS
Behavioral Results
A one-sample t-test was conducted to determine if the proportion of times products
that had been positively paired were chosen was significantly different from chance level,
with proportions transformed using an arcsine square root transformation. The results were
not significantly different from chance, t(36) = 1.002, p = .323. The products that had been
paired with positive music were chosen 51.6% of the time. Binomial tests were conducted
to evaluative significance at the individual participant level; 12 participants chose
positively paired products significantly more than chance, while 7 participants chose
negatively paired products significantly more than chance, with 18 participants showing
no significant effects. As in the previous studies, these findings indicate that there are
individual differences in the effects of the evaluative conditioning procedure (see Figure
4.2). Due to these individual differences, remaining analyses are reported including a
grouping variable based on behavioral results in the paired choice test phase: those who
showed significant positive effects, those who showed significant negative effects, and
those who showed no effects. For the subset of participants who showed positive effects,
the products that had been paired with positive music were chosen 64.2% of the time. For
those who showed significant negative effects, the products that had been paired with
negative music were chosen 66.2% of the time.
To test the effect of the evaluative conditioning on product ratings,
and the product category on the change in ratings from before and after induction. A
three-way repeated-measures ANOVA with factors valence × product category × participant
group was conducted on the change in product ratings from the pre-induction ratings to the
post-induction ratings. For all analyses, the primary focus is on valence and participant
group, as product category is not of particular interest in determining the effects of the
evaluative conditioning. There was a significant three way interaction, valence × product
category × participant group, F(8, 136) = 2.03, p < .05. There was also a significant
two-way valence × group interaction, F(2, 34) = 4.13, p < .05. There was no main effect of Figure 4.2. Distribution of behavioral results for paired choice in
The main effect of product category and its other interactions were not significant, ps >
.10.
For the subset of participants with significant positive effects in the paired choice
phase, a two-way repeated-measures ANOVA showed a significant effect of valence, F(1,
11) = 15.55, p < .01. Ratings for positively paired products increased by an average of
0.39 points on the 9-point scale, while ratings for negatively paired products decreased by
0.35 points. A parallel ANOVA conducted for the subset of participants with significant
negative effects showed the effect of valence did not reach significance, F(1, 6) = 0.379, p
= .56. For this group, ratings of positively paired products decreased by 0.37 points, while
ratings of negatively paired products decreased by 0.16 points. There was a significant
valence × product category interaction, F(4, 24) = 3.543, p < .05. Changes in ratings were
more positive for negatively paired products in three categories, and more positive for
positively paired products in two categories. The effect of valence in an ANOVA for the
group of participants who did not show significant effects was also not significant, F(1,17)
= 0.01, p = .91. There was no difference in the change in ratings for positively paired (0.12)
and negatively paired (0.10) products.
At the individual level, one participant in the positive group showed a significant
effect; no other participants were significant. The correlation between the paired choice
results and the rating change results across participants was more moderate than in the
previous studies, r(35) = 0.55, p < .001.
Eye Tracker Results
Several three-way repeated-measures ANOVAs were conducted on eye movement
repeated-measures ANOVA was conducted on total fixation durations on the product
pictures during paired choice. There was a significant valence × group interaction, F(2, 34)
= 16.85, p < .001 (Figure 4.3). The positive effects group spent longer looking at the
positive product (M = 548) than at the negative product (M = 432), whereas the negative
effects group spent longer looking at the negative product (M = 439) than the positive
product (M = 305). There was a main effect of participant group, F(2, 34) = 7.11, p < .01.
The positive effects group (M = 490) looked longer at the product images than the negative
effects group (M = 372) did. There was also a main effect of product category, F(4, 136) =
20.41, p < .001, but no main effect of valence, F(1, 34) = 0.00, p = .95.
Bonferroni-corrected pairwise comparisons showed that lamps (M = 453) were looked at significantly
longer than dinnerware (M = 392), speakers (M = 345), throw pillows (M = 340), or water
bottles (M = 397), ps < .001. Water bottles were looked at significantly longer than speakers
or throw pillows, and dinnerware was looked at significantly longer than throw pillows, ps
< .001. There were no other significant effects or interactions, ps > .10.
For the subset of participants who showed positive behavioral effects, a two-way
repeated-measures ANOVA revealed a main effect of valence, F(1, 11) = 10.32, p < .01,
with positively paired products being looked at significantly longer than negatively paired
products, as above. There was also a main effect of product category, F(4, 44) = 8.73, p <
.001. The valence × category interaction was not significant, p > .10. Another two-way
ANOVA was conducted for the subset of participants who showed negative behavioral
effects. There was a main effect of valence in the opposite direction, F(1, 6) = 9.99, p <
.05, with negatively paired products being looked at significantly longer than positively
significant, F(4, 24) = 7.22, p < .01, and the valence × category interaction was not. For
the group of participants who did not show behavioral effects, the ANOVA showed only a
significant main effect of product category, F(4, 68) = 9.24, p < .001.
A second ANOVA with the same factors was conducted on total number of
fixations on the product pictures during paired choice. There was a significant valence ×
group interaction, F(2, 34) = 13.23, p < .001 (Figure 4.4). The positive effects group looked Figure 4.3. Total looking time for product pictures during paired
more often at the positive product (M = 2.26) than at the negative product (M = 2.10),
whereas the negative effects group looked more often at the negative product (M = 2.01)
than the positive product (M = 1.74). There was also a main effect of product category,
F(4, 136) = 20.27, p < .001. Bonferroni-corrected pairwise comparisons showed that lamps
(M = 2.26) were looked at significantly more often than dinnerware (M = 1.99), speakers
(M = 1.80), throw pillows (M = 1.70), or water bottles (M = 1.95), ps < .01. Water bottles
were looked at significantly more often than throw pillows, p < .01, and marginally more
than speakers, p = .07. Dinnerware was looked at significantly more often than throw
pillows, p < .01. There was no main effect of valence, F(1, 34) = 0.56, p = .46, or participant
group, F(2, 34) = 2.72, p = .08. The other interactions were not significant, ps > .10.
A two-way repeated-measures ANOVA was conducted for the subset of
participants who showed positive behavioral effects. The main effect of valence was
significant, F(1, 11) = 10.32, p < .01. There was also a main effect of product category,
F(4, 44) = 8.73, p < .001. The valence × category interaction was not significant, p > .10.
A parallel ANOVA was conducted for the subset of participants who showed negative
behavioral effects. The main effect of valence was significant, F(1, 6) = 9.50, p < .05. There
was a main effect of product category, F(4, 24) = 5.59, p < .01, and the valence × category
interaction was not significant, p > .10. For the group of participants who did not show
significant behavioral effects, the ANOVA showed only a significant main effect of
product category, F(4, 68) = 9.28, p < .001.
We also examined whether participants were likely to look at the positively paired
picture before looking at the negatively paired picture. We calculated the total number of
trials the positive picture was looked at before the negative picture, and the total number
of trials the negative picture was looked at before the positive picture. A third three-way
repeated-measures ANOVA with factors valence × product category × participant group
was conducted on the number of trials participants looked at the picture first. The valence
× participant group interaction was not significant, F(2, 34) = 1.65, p = .21, nor was the
main effect of valence, F(1, 34) = 1.03, p = .32. The only significant effect was a main
comparisons indicated that regardless of valence, pictures of throw pillows (M = 14.37)
received significantly fewer fixations than those of dinnerware (M = 15.28) or water bottles
(M = 15.19), ps < .05, and marginally fewer fixations than those of lamps (M = 15.16) or
speakers (M = 15.15), ps = .05.
A three-way ANOVA was also conducted on mean pupil size. There was a
significant three-way valence × product category × participant group interaction, F(8, 136)
= 2.16, p < .05. The valence × group interaction was not significant, F(2, 34) = 0.27, p =
.76, and there was no main effect of group, F(2, 34) = 0.18, p = .84, or valence, F(1, 34) =
4.01, p = .05. There was a significant main effect of category, F(4, 136) = 13.32, p < .001.
The other two-way interactions were not significant, ps > .10. A two-way ANOVA was
conducted for each participant group. For the positive effects group, only the main effect
of category was significant, F(4, 44) = 2.69, p < .05. For the negative effects group, the
main effect of category was again significant, F(4, 24) = 15.32, p < .001, and there was a
marginally significant effect of valence, F(1, 6) = 4.98, p = .07, with pupil sizes slightly
larger for negative pictures (M = 1188.84) than for positive pictures (M = 1179.00). For the
group who did not show effects, there was a significant category by valence interaction,
F(4, 68) = 2.54, p < .05, a significant main effect of category, F(4, 68) = 8.42, p < .001,
and no significant main effect of valence, F(1, 17) = 0.85, p = .37. As the main effects of
product category and its interactions are not of primary interest, the simple effects are not
reported for these analyses.
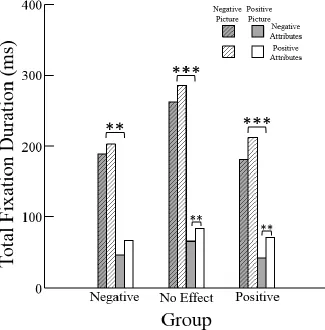
Additional ANOVAs were conducted on eye movements toward the attribute
interest areas in paired choice. A four-way ANOVA with factors picture valence × attribute
on the eight attribute interest areas. Attribute valence was either positive (four or five stars)
or negative (one or two stars). There was a significant main effect of picture valence, F(1,
34) = 56.34, p < .001 (Figure 4.5). Attributes for negative pictures (M = 234.25) were
looked at significantly longer than attributes for positive pictures (M = 65.18). There was
also a main effect of attribute valence, F(1, 34) = 8.32, p < .01. Positive attributes (M =
161.33) were looked at significantly longer than negative attributes (M = 138.11). There
were no other significant effects, ps > .10.
Additional three-way ANOVAs on total fixation duration on the attribute interest
areas were conducted for each participant group, with factors picture valence × attribute
valence × product category. For the positive effects group, there was a significant main
effect of picture valence, F(1,11) = 40.21, p < .001, and a significant main effect of attribute
valence, F(1,11) = 9.64, p < .05. Paired-samples t-tests showed that for the positive picture,
positive attributes (M = 70.66) were looked at significantly longer than negative attributes
(M = 41.96), t(11) = 4.06, p < .01, but for the negative picture the difference between
positive (M = 212.43) and negative (M = 181.46) attributes did not reach significance, t(11)
= 1.82, p = .10. For the negative effects group, there was also a significant main effect of
picture valence, F(1,6) = 15.65, p < .01, but no main effect of attribute valence, F(1,6) =
0.90, p = .38. There were no significant differences between positive (M = 66.44) and
negative (M = 46.08) attributes of the positive picture, t(6) = 1.18, p = .28, or between
positive (M = 202.82) and negative (M = 189.39) attributes of the negative picture, t(6) =
0.44, p = .68. For the group who did not show behavioral effects, there was a significant
main effect of picture valence, F(1,17) = 32.37, p < .001, but no main effect of attribute
were looked at significantly longer than negative attributes (M = 65.35), t(17) = 3.10, p <
.01, but there was no significant difference between positive (M = 286.01) and negative (M
= 261.91) attributes of the negative picture, t(17) = 1.25, p = .23.
Another four-way ANOVA with factors picture valence × attribute valence ×
product category × participant group was conducted on the total number of fixations on the
eight attribute interest areas. There was a significant main effect of picture valence, F(1, Figure 4.5. Total looking time for product attributes during paired
34) = 18.64, p < .001 (Figure 4.6). Attributes for negative pictures (M = 2.19) were looked
at significantly more often than attributes for positive pictures (M = 0.62). There was also
a main effect of attribute valence, F(1, 34) = 7.35, p < .05. Positive attributes (M = 1.56)
were looked at significantly more often than negative attributes (M = 1.25). There were no
other significant effects, ps > .10.