a
Corresponding author: [email protected]
Beam propagation and stray radiation in the ITER EC H&CD Upper
Launcher
Paola Platania1,a, Alex Bruschi1, Daniela Farina1, Lorenzo Figini1, Timothy Goodman2, Alexandra Krause2, Mark A. Henderson3, Alessandro Moro1, Gabriella Saibene4, Matthieu Toussaint2, Carlo Sozzi1
1Istituto di Fisica del Plasma, CNR, Milan, Italy
2Centre de Recherche en Physique des Plasmas, CRPP – EPFL, CH-1015 Lausanne, Switzerland 3ITER Organization, 13108 Saint-Paul-les-Durance, France
4
Fusion for Energy, Barcelona, Spain
Abstract. The four ITER Electron Cyclotron Upper Launchers (UL) are designed to control Magneto-Hydrodynamic instabilities with the deposition of Electron Cyclotron power. According to the present design, each launcher comprises two rows of four input waveguides, whose output beam is focused and driven towards the plasma by four sets of mirrors. In order to study the beam-launcher interaction throughout quasi-optical propagation, with particular attention to straylight behaviour, and to verify analytical calculations, a 3D model of the UL optical system has been implemented with the electromagnetic code GRASP® and the Physical Optics method. Detailed description of the components are introduced: pure hybrid mode HE11 from cylindrical waveguide as input beams, real shapes of the mirror contours, semi-analytical description of the ellipsoidal surfaces of focussing mirrors. A conceptual calculation scheme has been developed in order to take into account not only the direct contribution of the single source on its next scatterer but also the first order indirect effects: crosstalk from different lines of the same row and crosstalk from different rows have been evaluated after reflection on the first and third set of mirrors. The evaluations presented have been performed on the preliminary UL design, the last major milestone before finalization; however, the numerical model is suitable to be applied to future evolutions of the setup and/or other configurations.
1 Introduction
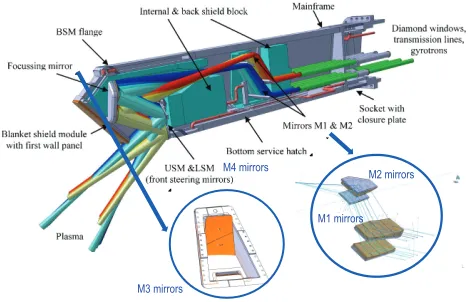
The design of the four ITER Electron Cyclotron Upper Launchers (UL), designed to control Magneto-Hydrodynamic (MHD) instabilities with the deposition of Electron Cyclotron power in the affected region of the plasma, has reached the preliminary phase, the last major milestone before finalization. The optical design consists of two rows with four beams, four ellipsoidal focussing mirrors M1 and four plane mirrors M2 per row; the second part of the system includes two focussing mirrors M3 and two steering mirrors M4 (one per row) used to redirect the power (close to 1 MW per beam) into the plasma. The overall design of the launcher optics is driven by the constraints on beam shapes and superposition at plasma target, after reflection on the steering mirrors M4, and available space.
In order to study the beam-launcher interaction throughout quasi-optical propagation, in particular straylight behaviour and, in general, verify the characteristics of the beams, besides analytical calculation, a 3D model of the UL optical system has been implemented with the electromagnetic code
GRASP®.
Calculations are performed with the Physical Optics method: a known electromagnetic field propagates from a source to the next scattering surface inducing currents on the reflector that irradiates a new field; the procedure is repeated up to the last scatterer [2].
Figure 1. Schematic view of the ITER UL with zoomed M1,
M2 and M3 from CATIA drawings. Note that M3 is a single
M3 mirrors
M1 mirrors M2 mirrors M4 mirrors
DOI: 10.1051/
C
Owned by the authors, published by EDP Sciences, 2015
/201 0201 2015) epjconf
EPJ Web of Conferences
8
, 0201 5
87
7 (
object including two different surfaces for the upper and the lower rows.
Detailed PO description of the components is introduced in the model, with real shapes of the mirrors and semi-analytical description of the ellipsoidal surfaces of focussing mirrors:
1) 8 identical hybrid mode conical horns (4 for the upper row U1, U2, U3, U4; 4 for the lower row L5, L6, L7, L8), using the hybrid mode HE11, frequency of 170 GHz, waveguide and aperture radius of 31.75 mm.
2) 4 upper and 4 lower mirrors M1 with ellipsoidal surfaces
3) 4 upper and 4 lower mirrors M2 with plane surfaces 4) 1 upper and 1 lower M3 focussing mirrors with
ellipsoidal surfaces
5) 1 upper and 1 lower M4 steering mirrors with plane surfaces
Figure 2. Optical elements of the launcher model and
geometrical optics ray plots for upper and lower rows.
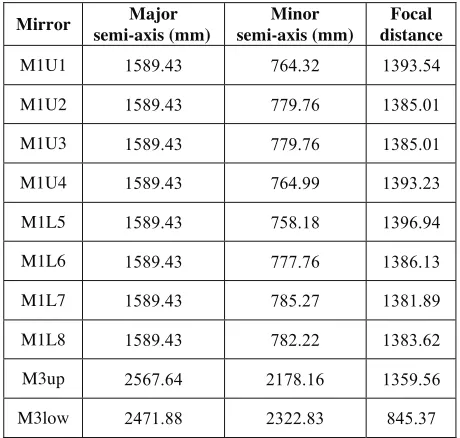
Table 1. Ellipsoid parameters of mirrors M1 and M3. M1U1 means the M1 dedicated to line #1 of the upper row; the same
for the other lines
Mirror Major
semi-axis (mm)
Minor semi-axis (mm)
Focal distance
M1U1 1589.43 764.32 1393.54
M1U2 1589.43 779.76 1385.01
M1U3 1589.43 779.76 1385.01
M1U4 1589.43 764.99 1393.23
M1L5 1589.43 758.18 1396.94
M1L6 1589.43 777.76 1386.13
M1L7 1589.43 785.27 1381.89
M1L8 1589.43 782.22 1383.62
M3up 2567.64 2178.16 1359.56
The shape of the M1 and M2 mirrors and the focussing M3 have been derived from CATIA designs; in order to be as realistic as possible, the four M1 upper (and lower) mirrors and the two M3 upper and lower mirrors are placed adjacent to each other.
Among many possible goals to be addressed with Physical Optics calculations, we focus on the evaluation of straylight behaviour in the UL model.
2 Electromagnetic model and
simulations
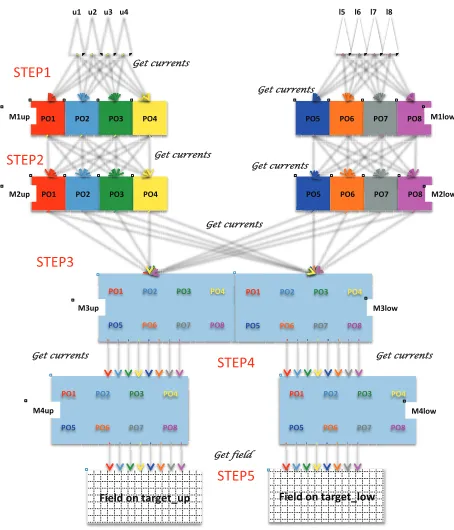
A conceptual calculation scheme for the entire UL system has been developed in order to take into account not only the direct contribution of the single source on its next scatterer but also the first order indirect effects: crosstalk from different lines of the same row and crosstalk from different rows. The simulation method consists in the following step:
• STEP 1: The current on mirror M1U1 is induced by the four antennas together U1, U2, U3 and U4. The same happens for each of the other mirrors M1U2, M1U3, M1U4 and for the lower row.
• STEP 2: The current on mirror M2U1 is induced by the four fields generated by the currents on mirrors M1U1, M1U2, M1U3 and M1U4. The same happens for each of the other mirrors M2U2, M2U3, M2U4: with the currents induced on each of them generated by four currents at the step before. The same happens for each mirror of the lower row.
• STEP 3: The current on mirror M3up is induced by the eight fields generated by the eight currents induced on the four M2U(1,2,3,4) and the four M2L(5,6,7,8). The same happens for the mirror M3low.
• STEP 4: The currents on mirror M4up are induced by the eight fields generated by the currents on M3up (M3U1, M3U2, …, M3L5, M3L6, etc.). The same happens for the mirror M4low.
• STEP 5: Eight fields on identical plane grids are generated, each one by one current from M4up, and then added on a single grid. The same happens for M4low.
Figure 3. Field simulation conceptual scheme. Note that, as an example, POl means “Physical Optics current” relative to line Ul.
3 Crosstalk effect evaluations
The scheme in Figure 3 takes into account the direct contribution of a single source illuminating one single mirror (the paths of geometrical optics model in Figure 2) plus the indirect first order contributions (from sources at the previous step only). In this way, in step 1 and step 2 the crosstalk from different lines of the same row is taken into account, while the procedure followed in step 3 guarantees the inclusion of the crosstalk contribution from different rows (Figure 4).
Figure 4. Crosstalk evaluation concept (dashed lines): effect
from different lines of the same row (top) and from different rows (bottom).
3.1 Indirect contribution from different line of the same row and different rows.
Given the scheme in Figure 3, beam characteristics can be evaluated at any intermediate stage of the propagation. Here the crosstalk effect from different lines of the same row has been evaluated at M2 positions after reflection on M1 (top case in Figure 4). The evaluation procedure consists in the calculation of the residuals between:
1) the fields calculated following the conceptual scheme (Step 1 + Step 2), hereafter called COMPLETE
2) the same fields but with the direct contributions only, i.e. one single line illuminating one single mirror (U1 on M1U1, U2 on M1U2, etc.), hereafter called DIRECT
Figure 5 shows the results: the residual fields (top) for the upper and lower row and the COMPLETE beam calculated as in 1). The residuals reach -60 dB from maximum for the upper and -65 dB for the lower row. The maximum power densities for the beam fields are in Table 2.
Beyond M2, the beam propagation is complicated by the fact that a single object M3 (see Figure 1) contains both the reflecting surfaces for the upper and the lower rows. The crosstalk effect comes from the interaction between the two rows (instead of the lines of a single row) reflecting together on M3 and then separating again before incidence on M4 up and low.
Figure 5. Calculation grids placed on M2 positions, color bars
in dB from maximum (see also Table 2). Top: Residual fields. Bottom: Beam fields calculated with the COMPLETE scheme.
Get currents
Get currents
Get currents
Get currents
Get currents
Get currents Get currents
Get field
Residuals on M2 up Residuals on M2 low
Beams on M2 up Beams on M2 low
Figure 6. Top: Crosstalk field for M4up (generated by lower row and vice versa for M4low) on an enlarged grid coplanar with the considered mirror, color bars in dB from maximum (see also Table 2). Bottom: Direct field on mirror M4up (M4low) due to the upper (lower) row.
3.2 Total spillover behind last mirrors M4
In order to evaluate the risk of impact on structures, the spillover behind the two mirrors M4 can be calculated. In this case the calculation grid has been placed in the spot position behind mirrors M4 (Figure 7 bottom left), with an “average” orientation between M4up and low. The considered sources are the currents induced on M3 and the ones induced on M4 itself.
Adding the amplitudes and phases of the two fields generated from the currents above, the blocking effect with the effective field going beyond the steering mirrors is obtained (Figure 7). In Table 2 the power density is reported.
In order to have a precise evaluation of the available power, it would be useful to add a calculation of the power escaping the mirrors. Moreover, the last result could be influenced by the steering angle of mirrors M4; extension of the calculations to include changes in orientation of M4 will be performed in the future.
Of course this kind of study could be done in every section of the launcher, wherever it’s needed.
The evaluations presented have been performed on the preliminary UL design, the last major milestone before finalization; however, the numerical model is suitable to be applied to future evolutions of the setup and/or to other configurations.
Figure 7. Top: Spillover field calculated behind mirrors M4,
generated by currents on M3 and M4 and added in amplitude and phases. The center of the grid is placed on the spot position (bottom left) with a “medium” orientation between those of M4up and M4low. Color bar represents dB from maximum (see also Table 2). N.B. Only one linear component is shown here, while the numbers in Table 2 represent the maximum power density of both linear polarizations.
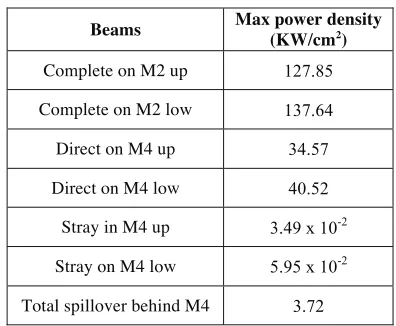
Table 2. Power densities on mirrors due to complete (Fig.5) and direct (Fig. 6 bottom) field on M2, stray field on M4 (Fig. 6 top)
and total spillover behind M4 (Fig. 7).
Beams Max power density
(KW/cm2
)
Complete on M2 up 127.85
Complete on M2 low 137.64
Direct on M4 up 34.57
Direct on M4 low 40.52
Stray in M4 up 3.49 x 10⁻²
Stray on M4 low 5.95 x 10⁻²
Total spillover behind M4 3.72
This work was supported by Fusion for Energy under the grant contract No. F4E-2010-GRT-161. The views and opinions expressed herein reflect only the author’s views. Fusion for Energy is not liable for any use that may be made of the information contained therein.
References
1. D. Strauss, G. Aiello, R. Chavan, S. Cirant, M. deBaar, D. Farina, G. Gantenbein, T.P. Goodman, M.A. Henderson, W. Kasparek, K. Kleefeldt, J.-D. Landis, A. Meier, A. Moro, P. Platania, B. Plaum, E. Poli, G. Ramponi, D. Ronden, G. Saibene, F. Sanchez, O. Sauter, T. Scherer, S. Schreck, A. Serikov, C. Sozzi, P. Spaeh, A. Vaccaro, H. Zohm, Fusion Eng. & Des.88 (11), 2761–2766 (2013).