a
Corresponding author: [email protected]
Localised Microwave Bursts During ELMs on MAST
Simon Freethy1, a, Vladimir Shevchenko1, Billy Huang1,2 and Roddy Vann3 1
Culham Centre for Fusion Energy, Culham Science Centre, Abingdon, OX14 3DB, UK 2
Centre for Advanced Instrumentation, Department of Physics, Durham University, Durham, UK 3
York Plasma Institute, Department of Physics, University of York, York, YO10 5DD, UK
Abstract. Bursts of microwave emission are observed during ELM events on the Mega Ampère Spherical Tokamak. In agreement with observations on other machines, these bursts are up to 3 orders of magnitude more intense than the thermal background, but are electron cyclotron in nature. The peak in microwave emission is ~20µs before the peak in midplane Dα emission. Using the Synthetic Aperture Microwave Imaging radiometer, we are able to demonstrate that these bursts are often highly spatially localised and preferentially occur at the tokamak midplane. It is hypothesised that the localisation is a result of Doppler resonance broadening for electron Bernstein waves and the high perpendicular electron energies could be the result of pitch angle scattering in high collisionality regions of the plasma.
1 Introduction
The Edge Localised Mode (ELM) is a ubiquitous instability for tokamaks in H mode confinement regimes and is capable of delivering damaging heat loads to the divertors of future machines. Understanding the trigger and heat transport mechanisms for this instability is a critical issue for future fusion machines.
On the Mega Ampere Spherical Tokamak (MAST), ELMs are almost always accompanied by intense bursts of microwave emission. These bursts can be 10-1000 times more intense than the thermal background. Similar bursts have also been reported on other machines [1-4]. The bursts’ character seems to suggest a population of highly energetic electrons associated with the ELM, although the mechanism which accelerates these electrons remains elusive. Here, using the Synthetic Aperture Microwave Imaging (SAMI) radiometer, we show that the intense bursts appear spatially localised and originate preferentially from the midplane region of the tokamak.
SAMI is a novel imaging diagnostic for tokamaks based on the imaging technique developed by the radio astronomy community based on the van-Cittert Zernike theorem [5]. SAMI has eight wideband (10 - 36.5GHz), phase sensitive Vivaldi antennas, the signals of which are down-converted and digitised in quadrature. Details of the system can be found in our instrument paper [6].
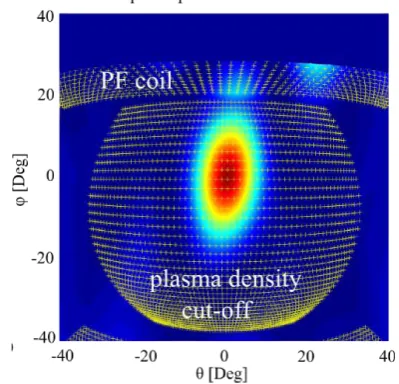
SAMI’s wide field of view is accompanied by a modest angular resolution as depicted in Figure 1. This is the point spread function for the instrument at 13GHz, where we have overlaid the density cut-off and two
poloidal field coils for context. SAMI is installed 20cm above the machine midplane resulting in the plasma midplane appearing at -10˚ in these coordinates.
Figure 1. The SAMI point spread function at 13 GHz in detector coordinates. The plasma and PF coils for a typical shot are overlaid for clarity.
2 Microwave burst phenomenology
2.1 Burst timing and structure
MAST has a central clock which times the majority of its diagnostics. While SAMI is not in this timing loop,
another radiometer is available which is. This radiometer has an integration time of 10µs and is digitised at 50kHz. Measurements with this radiometer allow comparison of the bursts’ timing with Dα line emission diagnostics. Figure 2 shows a direct comparison of the measured microwave emission with the Dα line emission as measured at the machine midplane. It is typical for the microwave emission to peak ~20µs before the Dα emission. This suggests that the energetic electrons responsible for the emission are generated during or just before the filament detachment stage of the ELM.
Figure 2. Microwave intensity measured by a synchronised radiometer compared to the Dα midplane emission. The
microwave peak emission precedes the Dα midplane emission
by ~20μs.
Figure 3. Microwave ELM burst at higher time resolution. Each burst is composed of 5-50 shorter bursts ~1-2μs each.
SAMI runs at a digitisation rate of 250MHz and thus allows finer time resolution of the bursts. Normal operation of SAMI involves switching between 16 fixed frequency channels, however we have the option to fix the frequency of observation in order to increase the time resolution. Figure 3 shows an ELM burst observed under these circumstances. One can see that each ELM burst is in fact made up of many shorter events on the timescale of 1-2µs.
The intensity of the bursts varies widely, the
strongest of which have been observed to reach 104 times
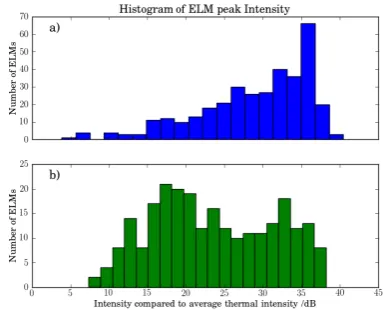
the thermal background intensity. Figure 4 shows the distribution of ELM peak intensity for typical MAST discharges. The bottom histogram shows the distribution
for connected double null plasmas (DND), i.e. those with two X-points. The upper histogram shows the distribution of intensity for plasmas with the magnetic axis shifted vertically down such that they have only a single null (SND). We split the plasmas into these two groups because their behaviour in the spatial distribution of the ELM bursts appears to be different as we shall see later.
Figure 4. Histogram of the ELM peak microwave intensity for a) single null plasmas and b) double null plasmas.
2.2 Burst spectra
It is not possible to measure the frequency spectra for individual ELM bursts using SAMI due to the temporal resolution restrictions imposed by a frequency switching system (10µs per frequency channel). It is however instructive to calculate average spectra for shots with greater than 20 ELMs. Figure 5 a) shows two examples of such average spectra. These two shots have different radii as measured at the outboard midplane last closed flux surface (LCFS), Rmid. The pedestal region of the plasma therefore lies in a region of lower magnetic field for the shot with larger radius. If we assume that the bursting emission is an electron cyclotron (EC) process then we would expect the spectra to be shifted with respect to each other. This is shown to be the case in figure 5. Further, when we normalise the frequency axis by the second harmonic EC frequency at Rmid, the spectra match fairly well.Since we don’t expect emission far into the scrape off layer, we can infer that the frequency downshift is ~30% for both cases.
the wave may be observed outside the plasma. Figure 6 shows the Bernstein wave trajectories calculated by the full-wave coupled ray-tracing code AMR [7], assuming a Maxwellian plasma.
Figure 5. Average ELM burst spectra for two shots of different radii, the intensity is normalised to the typical thermal background intensity. a) Spectrum in GHz, b) frequency normalised to the 2nd harmonic of the cyclotron frequency at Rmid.
Figure 6. Poloidal cross-section of the harmonic surfaces for a MAST H-mode shot at 16GHz. The fundamental EC resonance is completely enclosed by the plasma density cut-off. Over-laid are the Bernstein wave trajectories for a Maxwellian plasma.
To model emission AMR considers the reciprocal problem of power injection. This standard technique reduces the number of ray paths one must calculate in order to find which eventually reach the antenna system. In figure 6, the rays at higher or lower poloidal angles when incident from the low field side are absorbed at larger radii, earlier in the ray’s path. Since emission is the reciprocal process, the emission observed off midplane in
this case originates from regions further from the EC resonance. The reason is that, due to the high refractive
index, N, of the Bernstein wave (typically two orders of
magnitude above the X mode) these waves undergo strong Doppler effects when compared to O or X mode absorption. These effects are more pronounced off mid-plane due to an exponentially growing poloidal
component of N as the wave propagates. It is likely that a
non-thermal population of electrons will accentuate this effect and therefore only waves near the midplane region escape the plasma. Modelling of the wave damping with a population of non-thermal electrons should be carried out to confirm this hypothesis.
2.3 Burst localisation by imaging
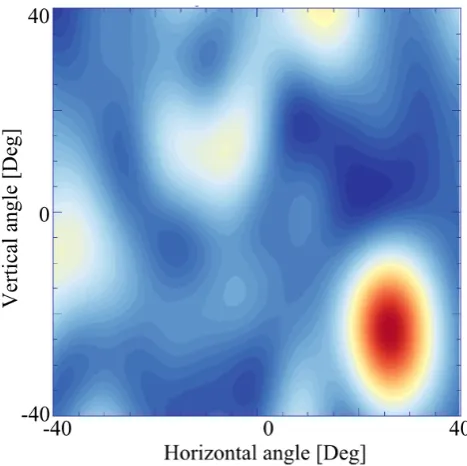
Using the imaging capability of the SAMI radiometer we can examine the spatial distribution of the ELM burst emission directly. With SAMI in fixed frequency mode at 16GHz, where the majority of the measured spectra peak, we see that the emission can be highly localised, often being more narrow in angular terms than the SAMI point spread function. Figure 7 shows an example image at 16GHz averaged over the smaller 1-2μs bursts for one particular ELM, showing a localised emission. This is a common feature of ELM bursts, however some examples can be found which are not localised in this way.
If we take 700 ELMs, split them into SND and DND plasma groups, record the position of maximum emission and calculate the 2D histogram of those positions, it reveals some interesting behaviour. Figure 8 shows these histograms. We can see that the DND plasmas show a small degree of clustering, whereas the SND plasmas show a very clear clustering of positions in two groups. Both lie approximately where the plasma density surface lies parallel to contours of constant field. This is in agreement with our earlier hypothesis.
Figure 8. Two dimensional histogram plots of maximum positions of emission during ELMs for DND plasmas (left) and SND plasmas (right). While for DND plasmas some clustering can be observed, SND plasmas show significant clustering of ELM burst events.
3. Perpendicular temperature
enhancement
Since the emission has been shown to be EC in nature, we require electrons with high perpendicular velocity to produce it. MAST has no RF heating in the majority of its plasmas and hence there is no known acceleration mechanism which will act on the electrons in the perpendicular direction. We must therefore look for alternative ways for the electrons to gain energy in this direction.
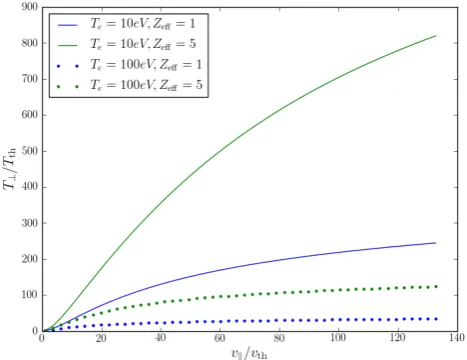
Figure 9. Normalised parallel velocity plotted against normalised perpendicular temperature for different temperature and Z effective values.
Recently it has been shown that electron pitch angle scattering from collisions between a small population of fast electrons and a thermal Maxwellian background can not only lead to a significant reduction in the critical field necessary for the production of runaway electrons, but that this pitch angle scattering can also lead to a broadening of the perpendicular velocity distribution of these runaway electrons [8]. Reported in this paper, a calculation was conducted for the steady-state two-dimensional distribution function of a small population of electrons accelerated by a parallel electric field. Those particles were allowed to have collisions with a bulk electron and ion population which resulted in collisional
drag and pitch angle scattering of the non-thermal particles. An analytic approximation for this perpendicular broadening, characterised by the normalised perpendicular temperature, TA,n is:
, =∥, 1 + 12
∥,
− 1 (1)
Where
=1 + 2ln (1 + ∥, )
=∥ , =
! " ∥,=∥
, , =
Here the electric field is normalised to the Dreicer field, which is the critical field for runaway production when considering parallel balance of energy alone.
Figure 9 shows the predicted normalised perpendicular temperature for two values of Z effective and bulk plasma temperature. We have chosen these values based around what we might expect to find at the X-point where magnetic reconnection is thought to take place. In each case the value of electric field is taken to be 10 Vm-1, which corresponds to 3.8% of the Dreicer field for a plasma temperature of 10eV and 38% for 100eV. This value is not taken from any estimates about what the electric fields might be inside the plasma, it is simply to demonstrate the principle. In all cases the density is 1x10¹⁹ m-1. The parallel velocity axis is limited by the maximum velocity an electron could reach under such a field if started from rest and accelerated for 100µs. The timescale value here is taken to be of the order of the timescale of the ELM, notably not the scale of an individual burst. Since no electrons can reasonably be expected to exist above this limit it does not make sense to consider velocities higher than this. As one can see from Figure 9, the conversion of parallel momentum to perpendicular momentum is more effective for those plasmas of higher collisionality. In this respect there is a balance of field strength and collisionality, large electric fields allow electrons to reach higher speeds within the timescale of the instability, but at the same time those electrons spend less time in the region where they are colliding and transferring momentum to the perpendicular direction, resulting in lower perpendicular temperatures. As figure 9 demonstrates, for modest plasma bulk temperatures and high values of Z effective, we may expect of order 1000 fold increases in the perpendicular electron temperature for a small population of runaway electrons. This number however is a function of vǁ and is not necessarily representative of the distribution as a whole since the number of electrons at this speed is not contained in the model.
simultaneous decrease in the plasma absorption i.e. a departure from black-body, relaxing constraints on the perpendicular acceleration. We also note here that additional electron pitch angle scattering may be induced by plasma turbulence which could be included into this model. Relativistic effects are also neglected and are likely to be important at the kind of electron energies considered here. Further, an obvious drawback of this model is the failure to predict the correct timescales for the emission, requiring ~100µs, rather than < 1µs. In order to accelerate electrons to 100keV within 1µs, considering relativistic effects we require a voltage of 3.6kVm-1. Fields of this strength in this simplified model accelerate electrons too quickly for them to have sufficient time to collide and broaden the perpendicular velocity distribution.
4. Discussion
ELMs on MAST are nearly always accompanied by several intense bursts of microwave radiation of duration 1-2µs. These bursts precede the peak in midplane Dα line emission by approximately 20µs, which puts the microwave emission before or during the filament detachment stage of the ELM. These bursts are ubiquitous phenomena being observed to have similar characteristics on several machines as discussed in section 2. The emission indicates the presence of a population of non-thermal electrons which are generated during the ELM. However, since the emission can be shown to be EC in nature the electrons must have a high perpendicular energy, leading to a difficulty in explaining the electron acceleration mechanism. It has been suggested by some authors that, despite the low collisionality of energetic electrons, pitch angle scattering can both lead to a dramatic reduction in the field required for runaway and lead to a significantly broadened perpendicular electron temperature [8]. Taking a simplified analytical model, we demonstrate the model’s promise and drawbacks, in particular the required timescales, and point out the need for further development. It has also been suggested that magnetic reconnection is involved during the ELM filament detachment stage, which may provide an accelerating electric field. Further work is planned to correlate the ELM bursts with the filaments as seen on the MAST fast Dα cameras, as well as detailed modelling of the emission to confirm the Bernstein wave Doppler broadening hypothesis.
We have also demonstrated that on MAST the microwave burst emission is localised both poloidally and toroidally. Spectra calculated by averaging over ~20 ELMS show the emission to be peaked typically around 16GHz and to be relatively narrowband. Since the SAMI radiometer has a wide field of view, this is inconsistent with the model of electromagnetic EC emission as discussed in section 2.2. We propose a hypothesis that the emission is generated primarily in the Bernstein wave branch of the dispersion relation. The poloidal localisation is then explained by the dependence of the ray trajectory on the poloidal angle. A population of energetic electrons is expected to enhance this Doppler
effect and modelling of the emission is required to confirm this hypothesis.
Acknowledgements
The authors would like to acknowledge Ken McClements for some very useful discussions and input.
This work was part-funded by the RCUK Energy Programme under grant EP/I501045 and the European Communities under the contract of Association between EURATOM and CCFE. The views and opinions expressed herein do not necessarily reflect those of the European Commission.
References
1. Ch. Fuchs, M. E. Austin, Phys. Plasmas,8, 5, (2001) 2. G. Taylor, C. E. Bush, E. D. Fredrickson, H. K. Park,
A. T. Ramsey, Nucl. Fusion,32, 1867 (1992) 3. M. E. Austin, S. M. Wu, R. W. Harvey, R. F. Ellis,
14th Joint Workshop on ECE and ECRH,Santorini, (2006)
4. D. V. Bartlett, A. E. Costley, S. E. Jones, L. Porte, R. J. Smith, A. Zolfaghari.Proc. 8th Joint Workshop on ECE and ECRH, Gut Ising, (1993).
5. F. Zernike, Physica,5, 8, (1938)
6. V. F. Shevchenko, R. G. L. Vann, S. J. Freethy, B. K. Huang, J. Inst.,7, P10016 (2012)
7. J. Urban et al, J. Plasma Fusion Res. Ser,8, 1153, (2009)