503
THE IMPACT OF TRADER BEHAVIOR ON OPTIONS PRICE VOLATILITY
Ping-Hung Chou
Assistant Professor at the Department of Finance, ChienHsin University
Pei-Shan Wu
Associate professor at the Department of Finance, ChienHsin University
Teng-Tsai Tu
Assistant Professor, Graduate Institute of International Business, National TaipeiUniversity
ABSTRACT
Because relatively few studies have examined the behavior among different types of traders in the
options market, this investigation conducts an empirical study examining the impact of trader type
on price volatility in the TXO market. It has been more than 10 years since the TXO market started
in 2001. Compared with mature foreign options markets, the TXO market is considered as an
emerging market and most transactions in the market are speculative in nature.
This study investigates whether informed investors choose to trade options because of their higher
leverage, which makes them attractive to speculators seeking to benefit from variations in the
underlying price. This study also examines whether institutional investors are better informed than
individual investors. In addition, this study attempts to illuminate the role played by market
makers, whether as traditional specialists to provide liquidity and thus stabilize the price, or as
opportunistic traders. Furthermore, this study aims to discover the relationship between trading
duration and options price volatility, to clarify whether liquidity-based trading or informed-based
trading dominates the TXO market. The empirical results suggest that institutional investors are
better informed than individual investors. Meanwhile, market makers are liquidity providers in the
put market, but liquidity demanders in the OTM and ATM call markets. Furthermore, the results
verify that liquidity-based trading dominates the OTM call and put markets.
Keywords:
Trader behavior, Trade duration, Informed trading, Liquidity trading, Options volatility, TXO marketJEL Classification:
C22, G101.
INTRODUCTION
Previous studies suggest that behavior among different types of tradersaffects financial market volatility1. Generally, types of traders active in financial markets include institutional investors,
1Bessembinder and Seguin (1993). suggest that the relationship between volatility and volume in financial markets may
depend on the type of traders.
Asian Economic and Financial Review
504 individual investors and market makers. The impact of their trading behavior on volatility is related to the role they play and the quality of their information.For example, institutionalinvestors trade inlarger volumes than individual investors, potentially inducing greater volatility. Additionally, the useof program trading by institutional investors mayincrease volatility in the securities they dominate. However, most academics argue that institutionalinvestors are more likely to behave rationally than individualinvestors.Many researchers characterizeinstitutional investors as smart investorsthat stabilize asset prices by offsetting the irrationaltrading of individual investors. Given thesearguments, if institutional investors are better informed than individual investors, they will likely herd to undervalued stocks and push those undervalued stocks towards their fundamental values. Hong and Lee (2011) and Chiang et al. (2012)find that institutional investorsare informed traders in the emerging markets. Thus, the stabilizing behavior of institutional investorsshould reduce price volatility for the securities they dominate.
Market makers are dealers who buy and sell stocks on behalf of clients or for their own firm.They also play an important role in financial markets by facilitating day trading. The liquidity provided by market makers makes the market more viable. That is, market makers provide both liquidity and smooth prices. Thus, their trading behavior tends to stabilize asset prices. However, once many market makers profit during a period of time, they tend to trademore aggressively, increasing price movement and generating more volatile return series. In this situation, their trading behavior may also destabilize asset prices.
Because behavior of options traders is relatively less understood2, this investigation empirically studies the impact of the behavior among different trader types (institutional investors, individual investors and market makers) on the price volatility in the TXO market. This study examines these issues in the options market based on the assumption that informed investors might choose to trade options because of the higher leverage theycan provide to speculators seeking to benefit from underlying asset price volatility. In addition, theorysuggests that informed traders prefer to trade out-of-the-money (OTM) and at-the-money(ATM) options. Chakravarty et al. (2004)argue that OTM options are more significant than other options in price discovery, because theymaximize investor leverage. Consequently, informed traders who possess private information should favor OTM options.
On the other hand, because of the availability of high frequency intraday trade data, there is an increasing empirical interest in the role of trade duration, or time between trades,ininforming market participants. Diamond and Verrechia (1987) and Easley and O’Hara (1992) provide an original theoretical inspiration for the study of the role of trade duration. According to Diamond and Verrechia (1987), long durations tend to be associated with bad news becauseinformed traders always trade unless they do not own the stock and are subject to short-saleconstraints. On the other hand, Easley and O’Hara (1992) argue thatinformed traders can trade immediately in response to a signal or news. Consequently,long durations are likely to be associated with no news.In addition,
Engle and Russell (1998)demonstrate that inter-trade duration is inversely related to information flow and asset price volatility, and Dufour and Engle (2000a; 2000b)find that quotes adjusted to asset trades faster when trade duration is shorter. However, Cellier (2003)demonstrate asignificant positive relationship between trade duration and past volatility in the Paris Bourse, implying an association between larger price variations and lower trade intensity. The findings suggestthat the French stock market is dominated by liquidity trading. Therefore, this investigation views the trading durations of the options market as an important information flow variable. Furthermore,TAIEX index options is ranked the third mostfrequently traded index options on a global scale.3Hence, TAIEX index options is an interesting investment instrument in the emerging markets, and has been a research interest of many scholars and financial institutions to provide information context. Matthew and Woon (2008) investigate the role of market makers in the TXO (TAIEXOptions) market, and demonstrated thatthey act as liquidity demanders more than liquidityproviders. However, Matthew and Woon (2008) fail toexaminethe behavior of other types of traders in the TXO market. Thus, this paper provides interesting insights into the information
2Lakonishok et al (2007). Provide detailed descriptive statistics regarding the purchased and written open interest and open
buy and sell volume of several classes of investors. However,their data do not allow them to assess the trading behavior and returns realized by each investor.
3For detailed statistics, see the Statistics Section and Derivatives Market Survey available at the World Federation of
505 context in TAIEX index options, anddiscusses the relationship betweentrade duration and options price volatility to understand how liquidity-based trading, or informed-based trading, dominates the TXO market.
In Sum, this study investigatesthe impact of the behavior of different trader types (institutional investors, individual investors and market makers) and trading durations on price volatility in the TXO market. This investigation examineswhether institutional investors are more informed than individual investors, and also clarifies whether market makersact as traditional specialists to provide liquidity and thus stabilize options prices, or simply trade to capitalize on opportunities as they arise.
2.
THEORETICAL AND EMPIRICAL STUDIES ON TRADER BEHAVIOR
2.1. Impact of Trader Behavior on Financial Market VolatilityThe influence of trader behavior on financial market volatility differswith variations in the quantity of private information or the liquidity supplied.Previous studies indicate that different factors influencefinancial market price volatility. However,relatively few empirical studies discuss the impact of trader behavior on price volatility and how they differ among various types of investors in options markets.
Actually, informed traders,based ontheir market knowledge and fundamental asset characteristics,have relatively homogeneous beliefs. Therefore, they buy and sell within a relatively smallrange of prices around asset fair value.In contrast, less-informed traders (or noise traders) cannot observe the transactions ofother traders to help them interpret noisy signals associated with volume and pricechanges, having wider dispersion of beliefs. Therefore,they tend to exaggerate price movements, which increaseprice variability. Black (1986) demonstratesthat short term volatility increases with noise trading. Consistent with theliterature (Black, 1986), DeLong et al.(1991) concludethat noise traders dominate the market, and their behavior isassociated with excess volatility. De Long et al. (1990b)showthe direct association of uninformed traders who follow the trend and adopt the positive feedback strategy with a higher volatilityof market prices.
Campbell and Kyle (1993) develop a theoreticalmodel of price formation, which predicts that noise trading leads to overreaction tofundamental information, and hence excessive volatility. Foucault et al. (2008) also examine the relationship between noisetrading and volatility, and find that noise trading activity varies more with price volatility.
Furthermore, market makers, just like institutional investors and individual investors, play a traditional and important role in financial markets. Market makers facilitate day trading and they are dealers who buy and sell stocks on behalf of either their clients or their firms. Market makers provide liquidity for their customers and enable trading activity. That is, market makers act as both liquidity providers and price smoothers. Thus, the trading behavior of market makers may stabilize asset prices. However, if numerous market makers profitduring certain periods, they tend to trademore aggressively.Price movementis hence increased and return series become more volatile. In this situation, market makers’ trading behavior may destabilize asset prices.
2.2. Degree to Which Institutional Versus Individual Investors are Informed
Investors can be classified as institutional and individual ones. Kuo and Lin (2011) find the fact that institutional investors behave differently from individuals.Most academics argue that individual investors areless-informed and more vulnerable to the influence of psychological biases, market sentiment,and major events, such as market return shocks (Kaniel et al., 2008)(Barber andOdean, 2005). Under asymmetric information, less-informed investors may rationally chase prices (Wang, 1993; 1994). Therefore, individual investors are expected to be more sensitivethan institutional investors to movements in market returns. Nofsinger and Sias (1999) furthersuggest that individual investors herdas an irrational but systematicresponse to fads or sentiment, while institutional investors herdas a result ofagency problems, security characteristics, or fads.
506 in the futures trading pit. Bessembinder and Seguin (1993)demonstrate that market depth in the futures market, which can bemeasured by unexpected changes in open interests, adds information to the volatility–volumerelation. Because different investor classes manage their openinterests in ways that affect market liquidity differently, Bessembinder and Seguin (1993)indicate that trade types affectthe relationship between volatility and volume.
Given the abovearguments, the stabilizing behavior of institutional investorsshould reduce volatility for securitiesdominated by institutional investors. However, no previous studies have formally and directly investigatedthe differences in trading behavior between different types of investors in the TXO market. This study fills in thisgap by examining the differences in the impact on volatilityamongfour types of trading investors (individual investors, market makers, domestic institutional investors and foreign institutional investors).
2.3 The Information Content of Trading Duration
In general financial theory, a large number of transactions occur when investors adjust their investment strategies in response to private news. Numerous studies have adopted the variables of trade prices, volumes and sizes in empirical analysis. Kraus and Stoll (1972) propose that institutional investors gain from large transactions perceived as driven by private information and are likely to exert a short-term influence on stock prices. Later studies usually limit trading sizes when modeling the relationship between prices and volumes, which is correlated with the private information regarding the true value of stock.However, investors wishing to trade frequently capture the advantages associated with private information, and rational market makers explain such orders as evidence of the activity of informed traders, and adjust their beliefs and prices accordingly (Easley and O’Hara, 1987). If market microstructure data are adopted further in empirical models, trading volume can be viewed as a driver for both abnormal returns and volume processes. The empirical results reveal that large trading volume events produce significant abnormal returns (Shome and Singh, 1995). Thus, trading volume can be consideredas an important explanatory variable in the stochastic process of stock price determination.
Engle (1982)proposesthat the success of the standard linear time series model, otherwise known as the ARCH model, lays in its use of conditional and unconditional variances. Bollerslev (1986)thusproposes the generalized ARCH model, which calculates the conditional variance in the GARCH model. Heynen and Kat (1994) employ GARCH, EGARCH and the stochastic volatility(SV) model to compare short and long term forecasting. Heynen and Kat (1994)indicate that the SV model has better ability to forecast stock index movements, but the GARCH model has better ability to forecast exchange rates. Therefore, Heynen (1995) favors the SV model for comparing five stock indices4. Meyer and Yu (2000) employ the SV model to calculate forecasting errors from variances rather thanfrom standard deviations. Additionally, Mendes et al. (2008)
investigate interdependence in emerging markets, which is driven by conditional short and long term dependence in volatility.
Previous studies plausibly and even arbitrarily analyze time series data usingeconometric techniques based on fixed time interval. However, adopting this modeling strategy may induce significant information loss. Transaction data arrive irregularly between two trades, and may provide information regardingtrader behavior. To resolve this problem, Engle and Russell (1998)develop the autoregressive conditional duration (ACD) model, which captures more information between trade arrival times. Many of the features of the ACD model resemble those of the GARCH model (Engle, 2000).
Furthermore, the selected error term distributionaffects ACD model conditional intensity or hazard function. Additionally, the GARCH-type models cannot adequately explain the phenomenon of financial instrument volatility exhibiting long memory. If the model assumptionsare more flexible to particular financial market characteristics,namely asymmetric behavior, switching regime, and news capture interval, the general formulation of the GARCH model for irregularly spaced financial data becomes extremely complex. Thus, Engle (2000)
propose the ACD-GARCH model to capture asset returns volatility and influence transaction duration. An ACD-GARCH model is a random coefficient GARCH model, or a doubly stochastic GARCH model, where the duration between transactions may determine the dynamics of the entire
507 parameter vector. Based on the framework, this investigation finds more appropriate time series
models to capture the volatility dynamics of financial instrument returns. Recently, Meitz and Terasvirta (2006) propose a more generalized LM test, including testing against higher-order models and the standardized duration. The estimated model does not capture the ACD effects, but the disturbances continue to exhibit some ACD effects. Furthermore, Racicot, Theoret et al. (2008)
employ GARCH, ACD-GARCH, extended ACD-GARCH and ultra-high-frequency GARCH (UHF-GARCH) models to forecast volatility. The empirical results indicate that the ACD-GARCH model does not outperform the realized volatility. However,Ng (2008) appliesthe concept of large trading volume as an important explanatory variable in the stochastic process of stock priceand investigates the time-varying liquidity of limit order books by analyzing the dynamics of volume duration with increasing threshold values.
3. METHODOLOGY
3.1.DataThis study uses an options dataset obtained from the TaiwanFutures Exchange (TAIFEX). Five delivery-months of options contracts are available, including near month, next month and next three consecutive quarter months. The last trading day and the expiration day are thethird Wednesday and Thursday of the respective months, respectively. The notional valueof each option is based on a multiplier of $NT 50 per index point.
The data period includesall trading days from January1, 2009 to June 30, 2009,and all options maturity days from January 2009 to June 2010. The unique dataset employed in this study contains allTXOindex options transaction records, including trading volume, price, date, time, indicators of whether the order is a buy or a sell, and ofwhether the order opens a new position or closes a previously established one. One unique feature of the dataset is that each transactionrecord can be identified for different investor classes5, enabling the associated transaction volume to be classified into fourmain investor classes: domestic institutional investors,foreign institutional investors, individual investors and marketmakers. Another feature of the dataset is that it contains detailedinformation on each transaction record initiated by eachinvestor. This characteristic enables the tradetype for each transaction to be correctly identified based on the transaction records for thesame type of options (call/put) and options characteristics (strike priceand time to expiration) of each investor for each trading day.The data used in this study are similar to data used by Chang et al. (2009). Following Chang et al. (2009), this investigation classifies the tradetypes into four categories based on their directions and positions:“new position opened-buy”, “position-closed-buy”, “new position opened-sell” and “position closed-sell”.
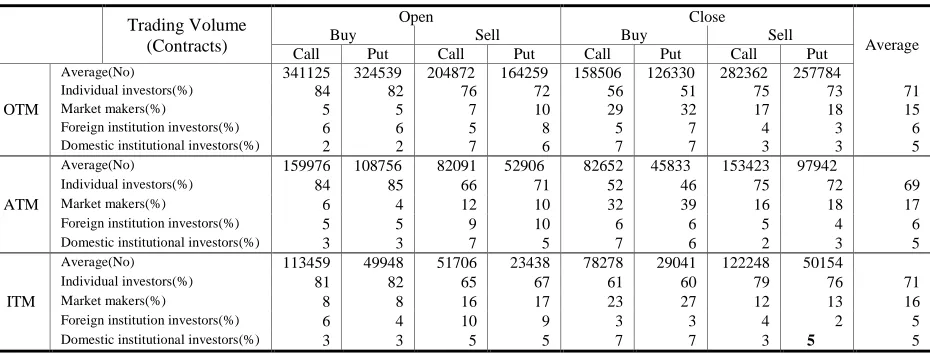
Before analyzing the data, transactions occurring outside the trading hours of the Taiwan Stock Exchange (TSE) (i.e. between 1.30pm and 9:00 am) are discarded to avoid the overnight effect and manipulation in the last fifteen minutes.Table 1 lists the proportion of trading volume accounted for by various classes of investors and moneyness options.The tableshows that the compositionof the participants in the TXOindex options market differs considerably from that of participants in the U.S. index options market, with individualinvestors accounting for the majority of participants across almost alltrade types in the TXO index options market (about 69%-71%). The second largest class of investors isthe market makers (about 15%-17%), with domestic institutional investors and foreign institutional investors, accounting for only around 5%-6% of all market participation.Overall, investorsare more likely to open long positions in options that are a long way out-of-the-money (OTM)6. Investors apparently prefer to trade OTM options because of theirhigher leverage compared to ATM and ITM options. Analyzing trading frequency among different types of traders, this study findsthat individuals prefer to trade OTM and ATM options, while foreign
5
TAIFEX index options transaction dataset provides approximately 41 detailed categories ofinvestor classes. The dataset enables the associated transaction volume to be classified into fourkey investor classes, comprising domestic institutional investors,foreign institutional investors, individual investors and marketmakers. The dataset contains more precise information thanthat adopted by Matthew, C.C. and K.W. Woon, 2008. The role of market makers on the Taiwan options markets. International Research Journal of Finance and Economics, 22: 122-134., which can be traced to market makers while theend investors remain unknown.
6In this study the categoriesof moneyness use 3% and 10% differences between strike and underlyingprices as the cut-off
508 institutions prefer to trade OTM and ITM options. Meanwhile, market markers prefer to trade ITM
optionsbecause of their lower liquidity. Therefore, this study infersthat market makers are the main suppliers of liquidity in the ITM options market.
To understand the characters of options and the intraday variation of investors’ behavior, this study calculates the percentage of tradingvolume for different classes of investors across various moneyness options and timesto expiration for both put and call optionsusing intraday data. Furthermore, this study calculates the duration between trades, ignoring non-trading hours and eliminating all zero duration transaction data. Table 2 shows that both foreign institutional investors and market makers trade OTM optionsmore actively during the first hour of trading (above 53%). Meanwhile, individual investors trade ATM options more actively(about 21%) than other investors do. As for market makers, they trade more ITM options (about 39%) than other investors do. Table 1 shows that the ITM options are least heavily traded. Therefore, to promote market liquidity, market makers are essentially obliged to supply liquidity for ITM options.
Table- 1. TXO index options trading volume: different trade types and classes of investors
Trading Volume (Contracts)
Open Close
Average Buy Sell Buy Sell
Call Put Call Put Call Put Call Put
OTM
Average(No) 341125 324539 204872 164259 158506 126330 282362 257784
Individual investors(%) 84 82 76 72 56 51 75 73 71
Market makers(%) 5 5 7 10 29 32 17 18 15
Foreign institution investors(%) 6 6 5 8 5 7 4 3 6
Domestic institutional investors(%) 2 2 7 6 7 7 3 3 5
ATM
Average(No) 159976 108756 82091 52906 82652 45833 153423 97942
Individual investors(%) 84 85 66 71 52 46 75 72 69
Market makers(%) 6 4 12 10 32 39 16 18 17
Foreign institution investors(%) 5 5 9 10 6 6 5 4 6
Domestic institutional investors(%) 3 3 7 5 7 6 2 3 5
ITM
Average(No) 113459 49948 51706 23438 78278 29041 122248 50154
Individual investors(%) 81 82 65 67 61 60 79 76 71
Market makers(%) 8 8 16 17 23 27 12 13 16
Foreign institution investors(%) 6 4 10 9 3 3 4 2 5
Domestic institutional investors(%) 3 3 5 5 7 7 3 5 5
Table 2 also shows the trading durations for different investors across time. The average trade duration of individual investors is shortest (about 0.3-0.6 sec), supportingindividualinvestors being the main participants in the TXO options market. The average trade duration of market makers is the next shortest (about 1.21-2.35 sec), followed by that of foreign institutions (about 2.51-4.46 sec). Domestic institutions have the longest average trading duration (about 3.67-6.96 sec). Observing intraday trading durations, itshows that trade is very active during market open and close, and trading durations tend to be longer during the middle of the day. Figures 1 - Figure 3 plot the daily patterns of trading durations. The figures all exhibit an inverted U shape for intraday trading durations.
509 Table- 2. Different options types and classes of investors
9:00 | 9:30
9:31 | 10:00
10:01 | 10:30
10:31 | 11:00
11:01 | 11:30
11:31 | 12:00
12:01 | 12:30
12:31 | 13:00
13:01 | 13:30
Panel A: Individual investors
ITM(%) 33.95 34.87 35.59 33.71 33.58 32.81 39.51 38.99 35.63 ATM(%) 21.34 20.75 20.47 21.28 22.25 21.70 13.80 15.22 19.23 OTM(%) 44.71 44.38 43.95 45.01 44.17 45.50 46.69 45.79 45.14 Under 30 days(%) 58.27 56.69 55.13 60.37 58.89 58.05 60.63 58.94 61.39 30-60 days(%) 9.02 8.36 8.33 6.88 6.62 8.07 8.63 7.88 7.37 61-179 days(%) 30.92 33.03 34.67 31.04 32.77 32.19 29.17 31.64 29.91 Above179days(%) 1.79 1.92 1.87 1.72 1.72 1.69 1.58 1.54 1.33 Trading duration (sec) 0.33 0.43 0.54 0.57 0.61 0.58 0.60 0.54 0.46
Panel B: Market makers
ITM(%) 39.18 40.13 41.26 39.64 40.52 38.53 39.27 38.84 39.09 ATM(%) 6.07 5.62 3.80 6.08 5.47 7.58 6.91 7.50 8.09 OTM(%) 54.75 54.25 54.94 54.28 54.00 53.89 53.82 53.67 52.81 Under 30 days(%) 52.34 52.99 51.96 56.04 54.19 53.96 54.59 54.07 58.04 30-60 days(%) 8.91 7.22 6.37 6.07 5.77 7.07 9.38 9.14 7.78 61-179 days(%) 36.27 37.22 39.01 35.20 37.42 36.64 34.06 34.64 32.65 Above179days(%) 2.49 2.57 2.67 2.69 2.62 2.33 1.97 2.14 1.54 Trading duration (sec) 1.21 1.63 2.06 2.23 2.35 2.28 2.10 2.04 1.69
Panel C: Foreign institutional investors
ITM(%) 33.15 34.21 34.86 35.32 35.41 33.67 38.69 38.38 37.60 ATM(%) 13.07 11.63 11.84 12.78 15.04 14.82 8.39 9.44 12.09 OTM(%) 53.78 54.15 53.30 51.90 49.55 51.51 52.92 52.18 50.31 Under 30 days(%) 45.36 42.20 39.29 43.77 41.68 44.10 46.07 44.66 51.25 30-60 days(%) 8.13 7.49 8.26 6.72 6.48 6.05 8.97 9.48 6.58 61-179 days(%) 42.39 45.19 46.91 43.73 45.97 44.11 39.97 40.61 37.81 Above179days(%) 4.12 5.12 5.53 5.78 5.87 5.74 4.99 5.25 4.37 Trading duration (sec) 2.51 3.09 4.14 4.20 4.46 4.17 3.88 3.52 2.67
Panel D: Domestic institutional investors
ITM(%) 36.46 36.01 37.09 34.21 35.08 34.83 38.06 37.46 37.42 ATM(%) 12.68 11.94 11.89 13.47 13.81 12.68 9.02 9.07 10.95 OTM(%) 50.86 52.05 51.03 52.32 51.11 52.49 52.92 53.46 51.63 Under 30 days(%) 56.91 55.50 51.96 59.06 58.00 56.38 57.79 57.59 60.64 30-60 days(%) 11.53 10.41 10.24 10.49 9.20 12.01 14.04 10.88 10.97 61-179 days(%) 31.08 33.67 37.33 30.20 32.49 31.30 27.90 31.27 28.18 Above179days(%) 0.49 0.42 0.48 0.26 0.32 0.31 0.27 0.26 0.20 Trading duration (sec) 3.67 4.87 5.91 6.57 6.96 6.50 6.61 5.90 4.53
Figure- 1. Intraday patterns of OTM options’trading duration
Figure- 2. Intraday patterns of ATM options’trading duration
510 3.2 ACD Model
Engle and Russell (1998)investigate the transaction data and expect that long duration is associated withpast long duration, and short duration is also associated with past short duration. The property of market volatilityresembles the conditional variance of the ARCH model. Thus, based on the previous framework of the ARCH model, Engle and Russell (1998) propose the ACD models to assess the problem of irregular duration. Transaction data comprise a vector observed at the time of initial truncation that can identify or further describe theevent of interest.
Let
t
i represent the time of thei-th trade, and letx
i
t
it
i1 represent the duration between trades. The time dependence can be summarized using a function
which is the conditional meanduration based on past information and is characterized by
i i
x /
being independent and identically distributed.This investigation captures the expected trading durationusing the ACD(1,1) model and attempts to add some related variables to analyze the variation of trading duration. Based on the literature (Lin, Sanger and Booth(1998), Eom and Hahn(2005), and Chen et al. (1999)), the ACD(1,1) model presented in this study includes price, volume and maturity variables. The proposed model can be written as
t t t
x
~
~
i
i.
.
d
t
(1) t 3 1 t 2 1 t 1 1 t 1 1 t 1 0t
x
Pr
ice
Volume
M
(2)where
t:Conditional expectation duration in period t1 t
ice
Pr
:Options price in period t-11 t
Volume
:Options volume in period t-1t
M
: Expiration effect in period t 3.3. ACD-GARCH ModelThe general formulation of GARCH for irregularly spaced financial data is extremely complex. Thus, Engle (2000)proposesemploying the ACD-GARCH model to capture the volatility of past asset returns. An ACD-GARCH model is a random coefficient GARCH model, or a doubly stochastic GARCH model, where the durations between transactions determinethe parameter vector dynamics.
A conventional GARCH(p,q), namely
p 1 i 2 i t i q 1 i 2 i t i 2t
, can be estimatedusing the dependent variable, defined as returns divided by the square root of the time,
r
/
x
. The GARCH(p,q) can be further extended into the ACD-GARCH model. That is,1 t 2 1 t 1 2 1 t 1 2 t
(3)This investigation applies this idea in the high-frequency framework, and divides the conditionalvolatility into components associated with the behavior of different types of traders, as suggested by Bessembinder and Seguin (1993)7. Moreover,components are associated with transaction time rather thancalendar time as in Corsi (2009), Oomen (2006) demonstrates that transaction time sampling increases the efficiency of volatility estimation.The ACD(1,1)-GARCH(1,1) model is then modified as follows:
foreign 4 domestic 3 mm 2 ind 1 1 t 2 1 t 2 1 t 2
t
D
D
D
D
(4)
Here, three parts influence the conditional variance
t2 . The first part is aGARCH(1,1)typeeffect including the previous squared innovation
t21 and last conditional7Bessembinder, H. and P.J. Seguin, 1993. Price volatility, trading volume, and market depth: Evidence from futures markets.
511 variance
t21. The second part captures the interaction between the volatility and duration. Thispart includesthe reciprocal of expected duration
t1, which examines the relationship betweentrading duration and volatilityin the present empirical study. The third part includes the behavior
for four types of investors.
D
ind,D
mm,D
domesticandD
foreign are dummy variables, representing the trade activity of individuals, market makers, domestic institutions or foreign institutions, respectively, in the TXO market.4.
EMPIRICAL RESULTS AND ANALYSIS
4.1.Expected Trading Duration from ACD ModelBoth duration and volatilityare well known to exhibit a typical dailypattern over the course of the trading day, with trading activity concentrated around market open and close. To remove this effect,the time series of durations, prices and volumes are diurnallyadjusted following the procedure of Engle (2000). This study regressesthe durations, volumes and absolute values of returns in the TXO index options market on apiecewise linear spline with knots at 9:00, 09:30, 10:00, 10:30, 11:00, 11:30, 12:00,12:30 and 13:00.Each original series is divided by the spline forecast to construct the adjusted series. The two extra knots in the first and last half-hour reflect thetypical different trading intensity during the day. Infrequently traded assets generally do not exhibit anyregular pattern during the day. Meanwhile, frequentlytraded assets exhibit the typical inverted U-pattern for durations, an L-pattern for absolute returns (namely, high absolute returns at the opening and flat shapeduring the rest of the day), and no specific pattern for volumes.The mean trading duration is calculated based on its time interval. The diurnally adjusted factor is given by
91 j
3 j i j 3 2 j i j 2 j i j 1 j j
i
)
I
[
c
d
(
t
k
)
d
(
t
k
)
d
(
t
k
)
]
(t
(5)with diurnally adjusted factor
(t
i)
;j
-th time indicatorI
j, andI
j
1
whenk
j
t
ik
j1;the mean trade duration
c
jofj
-th time interval; estimated parametersd
1j,d
2jandd
3j; each tradetime index
t
i, and each time intervalk
jof initial time. The raw trade duration is adjusted by the diurnal factor and can be written as
i ii
=
t
x
x
(6)where the de-seasonalized trading duration
x
i should not exhibit a diurnal pattern.Diurnal adjusted trade duration is employed to analyze the expected ACD models.
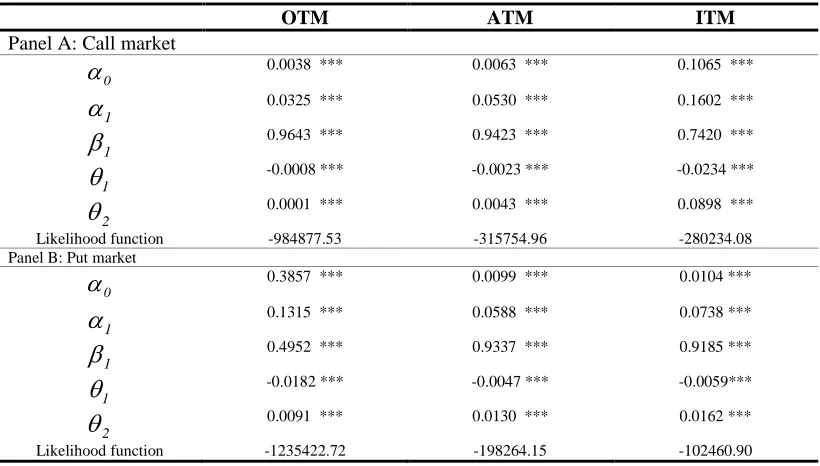
Table 3 lists the estimated parameters of TXO index options trading duration for the ACD. This study uses price, volume and maturity effect as key influences on options trading duration. Table 3 indicates that the parameters of conditional mean trading duration are all significant at the
5% level. The sum of
i and
i of options trading duration of the ACD model is less than one,512 Table- 3. The ACD(1,1) model results
OTM ATM ITM
Panel A: Call market
0
0.0038 *** 0.0063 *** 0.1065 ***1
0.0325 *** 0.0530 *** 0.1602 ***1
0.9643 *** 0.9423 *** 0.7420 ***1
-0.0008 *** -0.0023 *** -0.0234 ***2
0.0001 *** 0.0043 *** 0.0898 *** Likelihood function -984877.53 -315754.96 -280234.08 Panel B: Put market0
0.3857 *** 0.0099 *** 0.0104 ***1
0.1315 *** 0.0588 *** 0.0738 ***1
0.4952 *** 0.9337 *** 0.9185 ***1
-0.0182 *** -0.0047 *** -0.0059***2
0.0091 *** 0.0130 *** 0.0162 *** Likelihood function -1235422.72 -198264.15 -102460.90Note: Significance level of 1% is represented by ***.
4.2 The Impact of Trader Behavior and Trading Duration on TXO Price Volatility
The impact of trader behavior on volatility differswithvariation of private information or the liquidity supplied bytraders.Previous studies analyze the influence of the behavior of informed and noisy traders on financial market price volatility. However, relatively few empirical studies have discussed the impact of trader behavior on price volatility, and howthe behavior varies among types of investors in the options market. This paper usesthe ACD-GARCH model to analyze the influence of trader behavior and trading duration on TXO price volatility, and to further examine the following questions:First, whether individuals who are noise traders influence TXO price volatility more than institutions do.Second, whether TXO market makersact as traditional specialistsproviding liquidity and thus stabilizingoptions prices, or whether they merely act as opportunistic traders. Third, whether the TXO options market is dominated by liquidity-based trading or informed-based trading.
Table 4 shows the influence of the behavior of four types of traders (individuals, market makers, foreign investors and domestic investors) and expected trading durations on TXO price
volatility in the call and put markets. The estimated coefficients
1,
2,
3 and
4 reveal theinfluence of the trading behavior of individual investors, market makers, foreign institutions, and domestic institutions on TXO price volatility. Panel A shows that, in the OTM and ATM call
market,
1 and
2 are positive, while simultaneously
3 and
4 are negative. The panel showsthat the behavior of individual investors and market makers affectsOTM and ATM call volatility more than that of institutions. This result supports the observation of previous studies that institutional investors are more informed than individual investors, and thus institutions are likely to herd to undervalued stocks and away from fundamental values. Thus, the stabilizing behavior of institutional investorsshould reduce volatility.As for ITM call options, individuals still influence
price volatility more than institutions do (
1
3,
4), but market makers negativelyaffect price513 Panel B shows a combination of same and different results of panel A in the put options market. The same results indicate that individuals still influence price volatility more than
institutions (
1
3,
4) dofor all moneyness options, meaning individual investors also engagein more noise trading that destabilizes prices. On the other hand, the different results indicate that institutional investors are better informed than individual investors and trade rationally, thus moderating price volatility.Meanwhile,the different results indicate that market makers negativelyaffect price volatility. This phenomenon clearly indicatesthat market makers are important suppliers of liquidity in the put market, potentially stabilizing price volatility. Table 1 shows that the put volume is always smaller than the call volume. Therefore, market makers bear responsibilityfor supplyingput market liquidity.
Finally,
indicates the effect of inverse expected trading durationson TXO options volatility. Numerousprevious studies suggest that duration conveysinformation, meaning informed traders trade immediately following any signal or news. Consequently,long duration suggests no news.Engle and Russell (1998) demonstrate that inter-trade duration is inversely related to information flow and asset price volatility. Furthermore, Dufour and Engle (2000a; 2000b)find that shorter trade durations are associated with faster quote adjustment. Therefore, this investigation views the trading-duration of the options market as an important information flow variable.This studyfindsthe same result that inverse expected trading durations positively affect price volatility in ATM and ITM call and put markets.However,this study findsthat the inverse expected trading durations negatively affect price volatility in OTM call and put markets. Short duration thus is attributed to uninformed trading, and thus the associated price volatility is low.The results presented in this study are the same as those of Cellier (2003), who findsa significant positive relationship between duration and past volatility. Cellier (2003)claims that the liquidity trading dominates the French stock market. Therefore, the research results verifythat liquidity-based trading dominates the OTM call and put markets. These results are associated with the OTM options having higher liquidity because oftheir higher trading volume than ATM and ITM options. Informed-based trading dominates the ATM and ITM markets, because shorter durations imply information flow and thus higher volatility.
Table- 4. The ACD(1,1)-GARCH(1,1) model results
OTM ATM ITM
Panel A: Call market
0
0.0230 0.2830 *** 0.4794 ***1
-0.6281 *** -0.6770 *** -0.7034 ***a
0.0990 *** 0.3390 *** -25.7660 ***b
0.0098 *** 0.0212 *** 0.0274 ***c
0.9905 *** 0.9800 *** 0.9678 ***1
0.1098 *** 0.0083 *** 60.7714 ***2
1.2188 *** 0.5403 *** -2.7319 ***3
-0.2439 *** -1.8276 *** 27.8746 ***4
-0.1390 *** -2.4258 *** 8.3232 ***
-0.0943 *** 0.6714 *** 15.4314 *** Likelihood function -6308126.37 -1640236.37 -1698435.99 Panel B: Put market0
-0.7005 *** 0.3746 *** 1.3164 ***1
-0.6231 *** -0.6940 *** -0.7055 ***a
52.9482 *** 0.4472 *** -36.2436 ***b
0.0113 *** 0.0193 *** 0.0584 ***c
0.9872 *** 0.9811 *** 0.9316 ***1
16.5985 *** 1.4299 *** 89.7593 ***2
514 3
-38.0695 *** -3.4889 *** 1.75944
-14.8780 *** -7.0427 *** 24.4304 ***
-14.2719 *** 3.6203 *** 31.1153 *** Likelihood function -8095316.05 -1088353.19 -638340.49Note: Significance level of 1% is represented by ***.
5.
CONCLUSIONS
Because relatively few studies have examined the behavior of different trader typesin the options market, this investigation conducts an empirical study examiningthe impact of trader typeonprice volatility in the TXO options market.This study examines these issues in the options market because of the belief that informed investors might choose to trade options because oftheir higher leverage,which makes them attractive to speculators seeking to benefit from variations in the underlying price.This study examineswhether institutional investors are more informed than individual investors, and also illuminates whether market makersact as traditional specialists to provide liquidity and thus stabilize options price, or whether they can also act as opportunistic traders. Furthermore, this studyaims to discover the relationshipbetween trading duration and options price volatility toclarifywhether liquidity-based trading or informed-based trading dominates the TXO market.This study applies the ACD model to capture the expected trading durations in the TXO market, and includesbehavior of different trader types to examineits impact on volatility in the TXO market using theACD-GARCH model.
This study obtains several interesting findings. First, investors in the TXO market are more likely to open long positions in further OTMoptions. Investors apparently prefer to trade OTM options because of their higher leverage compared to ATM and ITM options. Notably, this studyfindsthat individuals prefer to trade OTM and ATM options, while foreign institutions prefer to trade OTM and ITM options. Meanwhile, market makers prefer to trade ITM optionsbecause oftheir lowerliquidity. Therefore, this study infersthat market makers are the main liquidity suppliers in the ITM options market.Second, this study findsthat there is more active trading during the market opening and closing period than the middle of the day. The figures all exhibitan inverted U shape for intraday trading duration. Furthermore, foreigninstitutional investors trade more actively in mid-horizon contracts (61-179 days, 42.39%) andother long-horizon contracts (longer than 179 days, 4.12%)than other investors do.Based on the above observation, this study speculates that foreign institutional investors have more private information than otherinvestors, and consequently are more likely to trade higher leverage options(OTM and long-horizon options).Third, this study findsthat individuals and market makers affect OTM and ATM call volatility more than institutions do. This result supports the observations of previous studies whereinstitutional investors are better informed than individual investors, since institutions are likely to herd to undervalued stocks and drive their prices towards fundamental value. Consequently, the stabilizing behavior of institutional investorsshould reduce volatility. As for ITM call options, individuals still influence price volatility more than institutions do, but market makers negativelyaffect price volatility. This study conjectures that market makers for the OTM and ATM call options markets are liquidity demandersseeking profit rather than liquidity suppliers. However, in the put market the market makerssupply all liquidity.
515
REFERENCES
Bessembinder, H. and P.J. Seguin, 1993. Price volatility, trading volume, and market depth: Evidence from futures markets. Journal of Financial and Quantitative Analysis, 28(0): 21-39.
Black, F., 1986. Noise. Journal of Finance, 41(3): 529-543.
Bollerslev, T., 1986. Generalized autoregressive conditional heteroskedasticity. Journal of Econometrics, 31(0): 307-327.
Campbell, J. and A. Kyle, 1993.Smart money, noise trading and stock price behavior. Review of Economic Studies, 60(0): 1–34.
Cellier, A., 2003. Duration-volume-volatility: A VAR GARCH model, working paper of JEREM.
Chakravarty, S., G. Huseyin and M. Stewart, 2004.Informed trading in stock and option markets. Journal of Finance, 54(3): 1235-1257.
Chang, C.C., P.F. Hsieh and H.N. Lai, 2009. Do informed option investors predict stock returns? Evidence from the Taiwan stock exchange. Journal of Banking & Finance, 33(0): 757-764.
Chen, Y.J., J.C. Duan and M.W. Hung, 1999. Volatility and maturity effects in the 17 nikkei index futures. The Journal of Futures Markets, 19(8): 895-909.
Chiang, S.J., L.J. Tsai, P.G. Shu and S.L. Chen, 2012. The trading behavior of foreign, domestic institutional, and domestic individual investors: Evidence from the Taiwan stock market. Pacific-Basin Finance Journal, 20: 745-754.
Corsi, F., 2009.A simple long memory model of realized volatility, Journal of Financial Econometrics, 7(2), 174-196.
Daigler, R.T. and M.K. Wiley, 1999.The impact of trader type on the futures volatility–volume relation. Journal of Finance, 54(0): 2297–2316.
De Long, J. B., Shleifer, A., Summers, L. H., Waldmann, R. J., 1991. The survival of noise traders in financial markets. The Journal of Business, 64(0), 1-19.
Diamond, D.W. and R.E. Verrechia, 1987. Constraints on short-selling and asset price adjustments to private information. Journal of Financial Economics, 18(0): 277-311.
Dufour, A. and R.F. Engle, 2000a. The ACD model: Predictability of the time between consecutive trades, discussion paper, ISMA centre, University of Reading.
Dufour, A. and R.F. Engle, 2000b.Time and the impact of a trade. Journal of Finance, 55(0): 2467-2498. Easley, D. and M. O’Hara, 1987.Price, trade size, and information in securities markets. Journal of Financial
Economics, 19(0): 69-90.
Easley, D. and M. O’Hara, 1992. Time and the process of security price adjustment. Journal of Finance, 47(0): 577-606.
Engle, R.F. and J.R. Russell, 1998. Autoregressive conditional duration: A new model for irregularly spaced transaction data. Econometrica, 66(0): 1127-1162.
Engle, R.F., 1982. Autoregressive conditional heteroskedasticity with estimates of the variance of U.K. inflation. Econometrics, 50(0): 987-1008.
Engle, R.F., 2000. The econometrics of ultra-high frequency data.Econometrica, 68(0): 1-22.
Eom, K. S., and S. B. Hahn, 2005. Traders’ strategic behavior in an index options market. Journal of Futures Markets 25(0): 105-133.
Foucault, T., D. Sraer and D. Thesmar, 2008.Individual investors and volatility, working paper. Heynen, R. and H. Kat, 1994.Partial barrier options. Journal of Financial Engineering, 3(0): 253-274. Heynen, R.C., 1995. Essays on derivatives pricing theory. Thesis Publishers: Amersterdam.
Hong, G. and B.S. Lee, 2011. The trading behavior and price impact of foreign, institutional, individual investors and government: Evidence from Korean equity market. Japan and the World Economy, 23(18): 273-287.
Kaniel, R., G. Saar and S. Titman, 2008.Individual investor trading and stock returns. Journal of Finance, 63(0): 273-310.
Kraus, A. and H.R. Stoll, 1972. Price impacts of block trading on the New York stock exchange. Journal of Finance, 27(3): 569-588.
Kuo, W.H. and T.Y. Lin, 2011. Does the put-call ratio forecast market returns? Evidence from an emerging market. International Research Journal of Finance and Economics, 69(0): 1450-2887.
Lakonishok, J., I. Lee, N.D. Pearson and A.M. Poteshman, 2007.Option market activity. Review of Financial Studies, 20(3): 813-857.
Lin, J., G. Sanger, and G. G. Booth, 1995. Trade Size and Components of the Bid-Ask Spread, Review of Financial Studies, 8(4): 1153-1183.
Matthew, C.C. and K.W. Woon, 2008. The role of market makers on the Taiwan options markets. International Research Journal of Finance and Economics, 22(0): 122-134.
Meitz, M. and T. Terasvirta, 2006.Evaluating models of autoregressive conditional duration. Journal of Business and Economic Statistics, 24(0): 104-124.
516 Meyer, R. and J. Yu, 2000.Bugs for a bayesian analysis of stochastic volatility models. Econometrics Journal,
3(0): 198–215.
Ng, W.L., 2008.Analysing liquidity and absorption limits of electronic markets with volume durations. Quantitative Finance, 8(4): 353-361.
Nofsinger, J.R. and R.W. Sias, 1999.Herding and feedback trading by institutional and individual investors. Journal of Finance, 54(0): 2263–2295.
Oomen R., (2006). Properties of Realized Variance Under Alternative Sampling Schemes. Journal of Business and Economic Statistics, 24(2): 219-237.
Shome, D.K. and S. Singh, 1995. Firm value and external block holdings. Financial Management, 24(4): 3-14. Theoret, R., F.E. Racicot and A. Coen, 2008. Forecasting UHF financial data: Realized volatility versus
UHF-GARCH models. International Advances in Economic Research, 14(1): 112-124.
Wang, J., 1993. A model of intertermporal asset prices under asymmetric information. Review of Economic Studies, 60(0): 249–282.